ACFI330 - Commercial banks risk management
1/116
There's no tags or description
Looks like no tags are added yet.
Name | Mastery | Learn | Test | Matching | Spaced | Call with Kai |
|---|
No analytics yet
Send a link to your students to track their progress
117 Terms
Interest rate risk
The risk incurred by an FI when the maturities of its assets
and liabilities are mismatched and interest rates are volatile.
Liquidity risk
the risk that a sudden and unexpected increase in liability
withdrawals may require an FI to liquidate assets in a very short period of time
and at low prices.
Credit Risk
the risk that promised cash flows from loans and securities held by
FI’s may not be paid in full.
Market Risk
The risk incurred in trading assets and liabilities due to changes in
interest rates, exchange rates, and other asset prices.
Off balance sheet risk
the risk incurred by an FI as the result of its activities
related to contingent assets and liabilities.
Foreign exchange risk
the risk that exchange rate changes can affect the value
of an FI's assets and liabilities denominated in foreign currencies.
Country or Sovereign risk
the risk that repayments by foreign borrowers may
be interrupted because of interference from foreign governments or other
political entities.
Technology Risk
the risk incurred by an FI when its technological investments
do not produce anticipated cost savings.
Operational risk
the risk that existing technology or support systems may
malfunction, that fraud that impacts the FI's activities may occur, and/or that
external shocks such as hurricanes and floods may occur.
Digital disruption and fintech risk
the risk that fintech firms could disrupt
business of financial services firms in the form of lost customers and lost
revenue
Insolvency Risk
the risk that an FI may not have enough capital to offset a
sudden decline in the value of its assets relative to its liabilities.
Interest rate risk
Interest rate risk is the type of risk incurred by a Financial
Institution (FI) when the maturities of its assets and liabilities are
mismatched.
Two methods of measuring interest rate risk exposure for Financial institutions
Repricing gap model
Duration model
Repricing gap model
Repricing gap is the difference between the rate sensitive assets (𝑅𝑆𝐴) and the rate sensitive liabilities (𝑅𝑆𝐿) calculated at their book values over a specified time horizon ti
Duration Model
Duration is weighted-average time to maturity on an
investment, using the relatives
Repricing
Repricing can be the result of:
• a rollover of an asset or liability
• e.g., a loan is paid off at or prior to maturity and the funds are
used to issue a new loan at current market rates,
• or it can occur because the asset or liability is a variable-
rate instrument
• e.g., a variable-rate mortgage whose interest rate is reset every
quarter based on movements in a prime rate.
Goal of repricing gap model
Measure the asset-liability gap exposure of an FI
Rate sensitivity
Rate sensitivity means that the asset/ liability will be repriced at
current market interest rates within a certain time horizon.
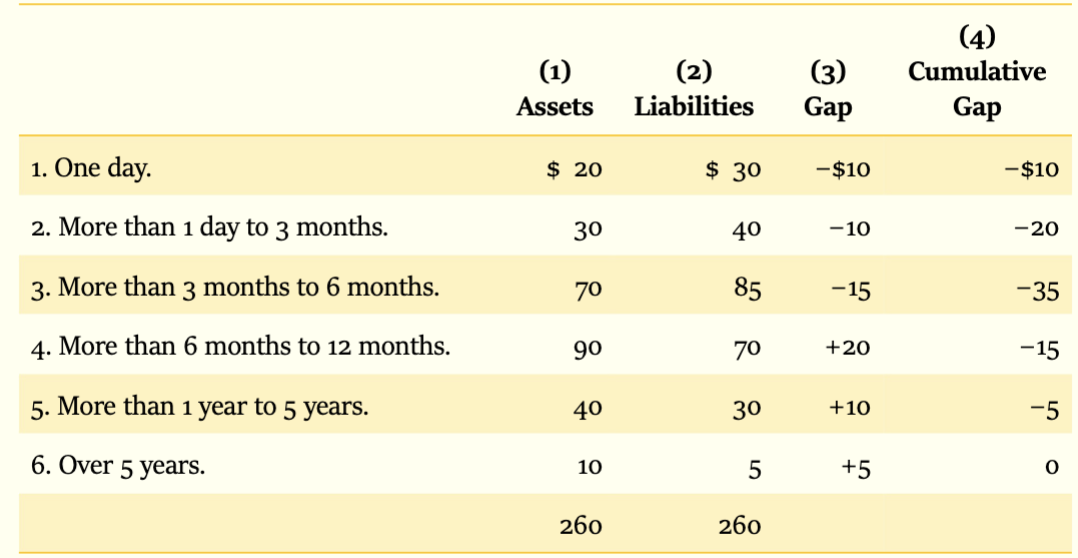
What are the six maturity buckets that commercial banks use to report repricing gaps?
One day
More than one day to three months
More than three months to six months
More than six months to twelve months
More than one year to five years
More than five years
Repricing Gap:
Example
Refinancing risk
The risk that the cost of rolling over or re-borrowing funds will rise above the returns being earned on asset investments. This occurs when interest expense increases more than interest revenue.
Reinvestment Risk
The risk that returns on funds to be reinvested will fall below the cost of funds. This happens when an FI holds shorter-term assets relative to liabilities and rates drop.
Applying the repricing model: Within each maturity bucket
Applying the repricing model:
Equal changes in rates on RSAs and RSLs
Unequal changes in rates on RSAs and RSLs
• The previous relationship holds when we have equal changes in the rates of
rate-sensitive assets and liabilities.
• What if there’s a spread (difference) between these two?
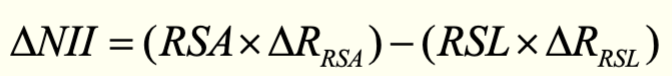
• In this case, the change in the net interest income is given by the spread
effect
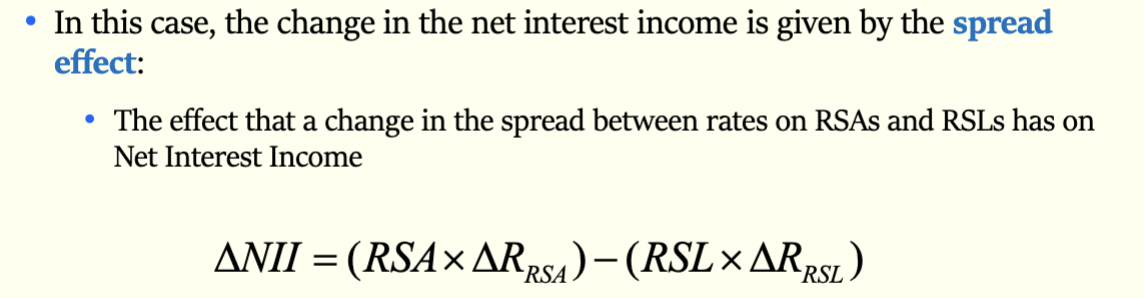
The spread effect
The effect that a change in the spread between rates on RSAs and RSLs has on
Net Interest Income
Weaknesses of the repricing model
1. Ignores market value effects on the assets/ liabilities due to interest
rate changes (i.e. ignores capital losses)
2. Over-aggregative: The distribution of assets & liabilities within
individual buckets is not considered. Mismatches within maturity
buckets can be substantial.
3. Ignores effects of runoffs: Bank continuously originates and retires
consumer and mortgage loans.
• Runoff of rate-insensitive asset/liability is rate-sensitive
4. Ignores off-balance sheet (OBS) cash flows. Off-balance-sheet items
are not included when considering cash flows.
• Hedging effects of off-balance-sheet items not captured.
• Example: Interest rate futures contracts.
Causes of liquidity risk
• Liability-side liquidity risk
When depositors seek to cash in their financial claims immediately
• With low cash holdings, FI may be forced to liquidate assets too
rapidly
• Faster sale may require much lower prices (fire-sale price)
• Asset-side liquidity risk
When a borrower requests its loan commitments
A FI can meet such liquidity need by running down its cash assets,
selling other assets, or borrowing additional funds.
Liquid assets
Liquid assets are those that can be converted to cash quickly if needed to meet financial obligations
To remain viable, a financial institution must have enough liquid assets to meet its near-term obligations, such as withdrawals by depositors
Capital
Capital acts as a financial cushion to absorb unexpected losses and its the difference between all of a firm’s assets and its liabilities
Liability-side liquidity risk for DIs
• In theory at least, a DI that has 20% of its liabilities in demand deposits
must stand ready to pay out that amount by liquidating an equivalent
amount of assets on any banking day.
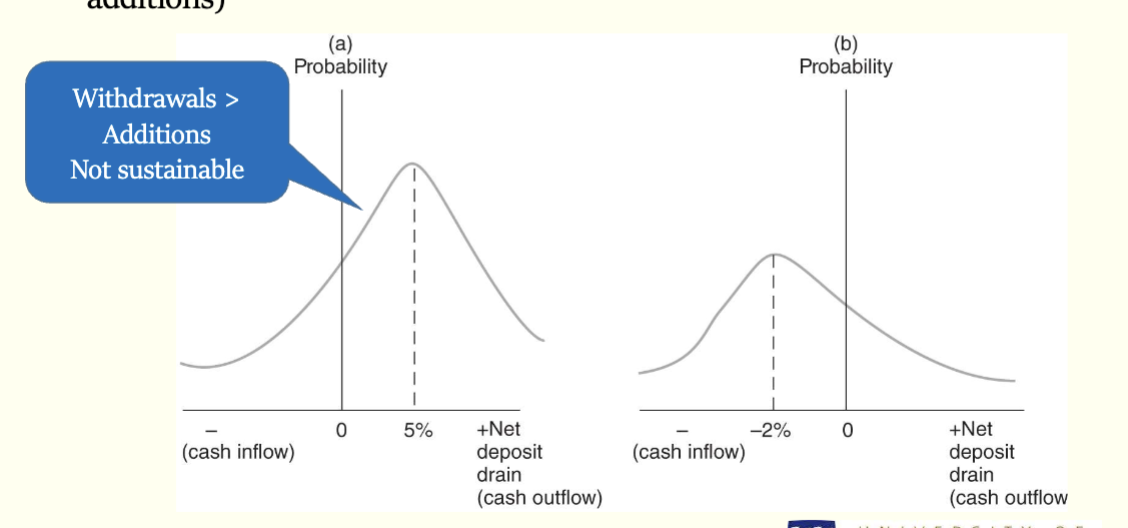
• In reality, a depository institution knows that normally only a small
proportion of its deposits will be withdrawn on any given day.
Depository institutions need to be able to predict the distribution of net
deposit drains (difference between deposit withdrawals and deposit
additions)
Purchased liquidity management
• A DI manager who purchases liquidity turns to the market for
purchased funds such as the federal funds market and/or the
repurchase agreement markets, which are interbank markets for
short-term loans
• The higher the costs of purchased funds relative to the rates
earned on assets, the less attractive this approach becomes
• This approach allows the DI to maintain its overall balance sheet
size without disturbing the size and composition of the asset side of
its balance sheet
Stored liquidity management
• The FI liquidates some of its assets
• Also the FI should have a minimum reserve requirements for
the cash reserves (established by the Federal Reserve)
• In addition, banks tend to hold excess reserves
• Downsides:
• Opportunity cost of holding excessive cash or other liquid
assets
• Requires holding excess low return or zero return assets
• Decreases size of balance sheet
Asset side liquidity risk
Asset side liquidity risk is the risk that an entity cannot convert assets into cash quickly enough to meet short-term payment obligations without incurring significant losses. This can occur due to the illiquid nature of the assets themselves, a market crisis that reduces the liquidity of many assets, or high withdrawal demands that require quick asset sales. For example, a fund manager might face this risk if many investors try to redeem their shares at once, but the fund's assets are illiquid, forcing the manager to sell them at a lower-than-market price
Liquidity coverage ratio
Maintenance of LCR is intended to ensure that DIs can survive a severe
liquidity stress scenario for at least 30 days
Net stable funding ratio
Ensure that long-term assets are funded with minimum amount of stable
liabilities. It limits reliance on short-term funding which was a major problem
in the financial crisis
consequences of liquidity risk
• Major liquidity problems can arise if deposit drains are
abnormally large and unexpected due to:
• Concerns about a DI’s solvency relative to those of other DIs
• Failure of a related DI leading to depositor concerns about the
solvency of other DIs (the contagion effect)
• Sudden changes in investor preferences
• As a bank run increases in intensity, more depositors join the
withdrawal line, and liquidity crisis develops, which may turn
into a solvency problem
Measures to reduce likelihood of bank runs
• Deposit insurance (FDIC)
• Direct government actions (e.g. TARP in 2008)
• Federal reserve lending to financial institutions
What does the repricing gap model concentrate on?
The impact of interest rate changes on a financial institution's net interest income (NII).
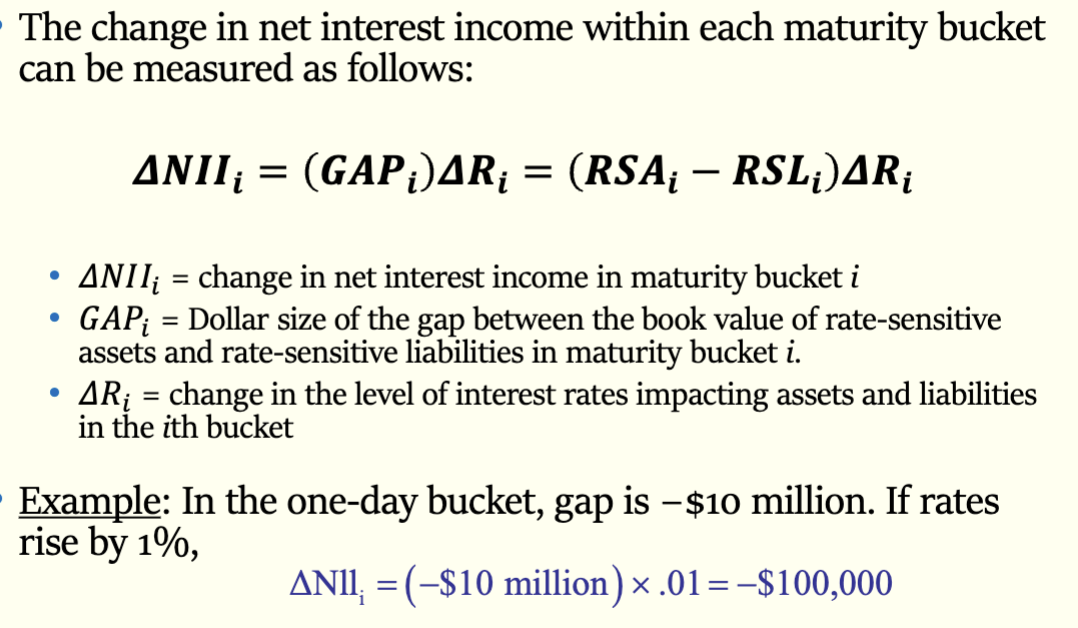
What formula measures the change in net interest income within each maturity bucket?
ΔNII_i = GAP_i × ΔR_i = (RSA_i - RSL_i) × ΔR_i
Where:
ΔNII_i = change in net interest income in maturity bucket i
GAP_i = dollar size of the gap in bucket i
ΔR_i = change in interest rates
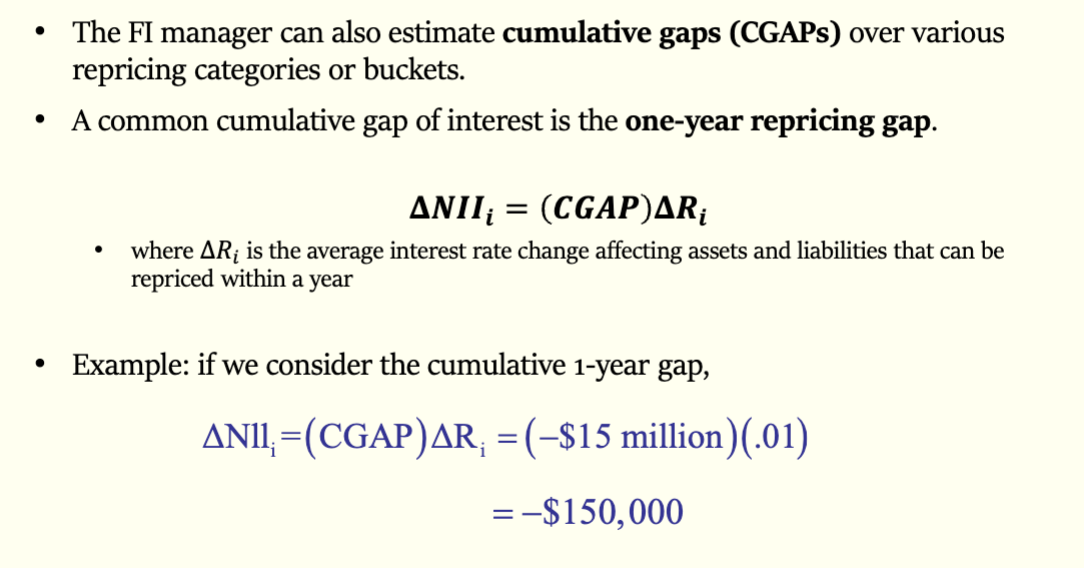
: What is the cumulative gap (CGAP)?
The sum of individual gaps over various repricing categories or buckets. The one-year repricing gap is a common measure.
What is the gap ratio and what does it measure?
Gap ratio = CGAP/Assets. It provides the direction and scale of interest rate exposure.
What is reinvestment risk?
The risk that returns on funds to be reinvested will fall below the cost of funds. This happens when an FI holds shorter-term assets relative to liabilities and rates drop.
What is the spread effect in the context of interest rate risk?
The effect that a change in the spread between rates on RSAs and RSLs has on Net Interest Income. Formula: ΔNII = (RSA × ΔR_RSA) - (RSL × ΔR_RSL)
What are the four main weaknesses of the repricing gap model?
Ignores market value effects on assets/liabilities (ignores capital losses)
Over-aggregative: doesn't consider distribution within buckets
Ignores effects of runoffs
Ignores off-balance sheet (OBS) cash flows
Q: What is the difference between a bank's liquidity and its capital?
Liquidity: Liquid assets that can be converted to cash quickly to meet near-term obligations (like withdrawals)
Capital: Acts as a financial cushion to absorb unexpected losses; it's the difference between all assets and liabilities
What are the two types of liquidity risk?
Liability-side liquidity risk: when depositors seek to cash in their claims immediately
Asset-side liquidity risk: when borrowers request their loan commitments
What is liability-side liquidity risk?
The risk that depositors seek to cash in their financial claims immediately, potentially forcing the FI to liquidate assets rapidly at low "fire-sale" prices.
What is asset-side liquidity risk?
The risk that arises when a borrower requests to draw down their loan commitment, requiring the FI to provide funds immediately.
What is a fire-sale price?
A much lower price that may be required when an FI is forced to sell assets too rapidly due to liquidity needs.
What are the two main approaches to managing liquidity drains?
Purchased liquidity management
Stored liquidity management
What is purchased liquidity management?
When a DI manager turns to the market for purchased funds (such as federal funds market or repurchase agreement markets) to meet liquidity needs. This maintains overall balance sheet size without disturbing assets.
What is stored liquidity management
When the FI liquidates some of its assets (such as cash reserves) to meet liquidity needs. This decreases the size of the balance sheet.
What are the downsides of purchased liquidity management?
: The higher the costs of purchased funds relative to rates earned on assets, the less attractive this approach becomes.
What are the downsides of stored liquidity management?
Opportunity cost of holding excessive cash or liquid assets
Requires holding excess low-return or zero-return assets
Decreases size of balance sheet
What are minimum reserve requirements?
Cash reserves that banks must hold as established by the Federal Reserve. Banks also tend to hold excess reserves beyond this requirement.
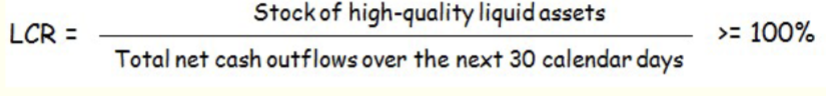
What is the BIS Liquidity Coverage Ratio (LCR)?
LCR = (Stock of high-quality liquid assets) / (Total net cash outflows over next 30 calendar days) ≥ 100%
It ensures DIs can survive a severe liquidity stress scenario for at least 30 days.
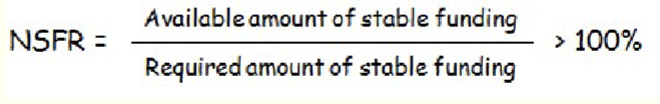
What is the BIS Net Stable Funding Ratio (NSFR)?
NSFR = (Available amount of stable funding) / (Required amount of stable funding) > 100%
It ensures long-term assets are funded with minimum amounts of stable liabilities, limiting reliance on short-term funding.
What can cause abnormally large and unexpected deposit drains?
Concerns about a DI's solvency relative to other DIs
Failure of a related DI (contagion effect)
Sudden changes in investor preferences
What measures reduce the likelihood of bank runs?
Deposit insurance (FDIC)
Direct government actions (e.g., TARP in 2008)
Federal Reserve lending to financial institutions
What is the economic cost of bank run protections?
These protections can encourage DIs to increase liquidity risk (moral hazard problem).
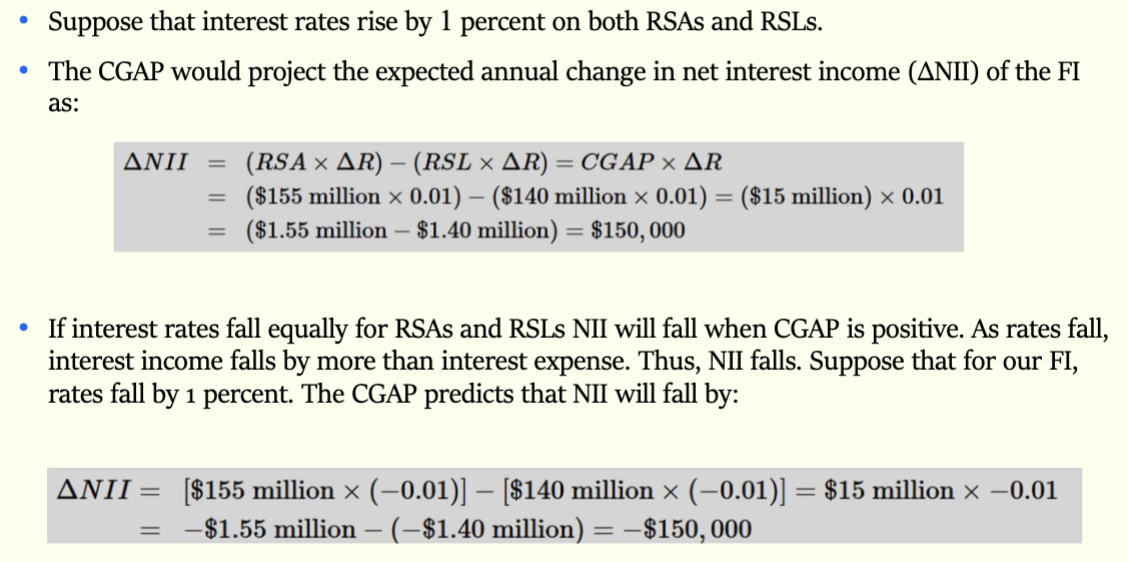
If a bank has RSA = $155 million, RSL = $140 million, and rates rise by 1%, what is the change in NII?
ΔNII = ($155M × 0.01) - ($140M × 0.01) = $1.55M - $1.40M = $150,000
If CGAP = -$15 million and rates rise by 1%, what happens to NII?
ΔNII = -$15M × 0.01 = -$150,000 (NII decreases by $150,000)
A bank has a one-day gap of -$10 million. What does this indicate about its interest rate risk position?
The bank has more rate-sensitive liabilities than assets in the one-day bucket (RSL > RSA by $10M), exposing it to refinancing risk if rates rise.
In the example balance sheet, deposits are 82.19% of liabilities and borrowings are 5.47%. What liquidity challenge does this present?
The high proportion of deposits means the bank must be prepared to meet withdrawal demands, requiring adequate liquid assets or access to purchased liquidity.
List the 11 major types of risks faced by financial institutions.
Interest rate risk
Liquidity risk
Credit risk
Market risk
Off-balance sheet risk
Foreign exchange risk
Country or sovereign risk
Technology risk
Operational risk
Digital disruption and fintech risk
Insolvency risk
What are rate-sensitive assets (RSAs)?
Assets that will be repriced at current market interest rates within a certain time horizon. Examples include:
Short-term consumer loans (repriced at maturity)
Three-month Treasury bills (repriced every 3 months)
Six-month Treasury notes (repriced every 6 months)
Floating-rate mortgages (rate reset periodically, e.g., every 9 months)
What are rate-sensitive liabilities (RSLs)?
Liabilities that will be repriced at current market interest rates within a certain time horizon. Examples include:
Three-month CDs
Three-month bankers acceptances
Six-month commercial paper
One-year time deposits
What are examples of NON-rate-sensitive assets?
Assets whose interest rates are fixed over the time horizon being considered:
Long-term consumer loans (two-year maturity)
Three-year Treasury bonds
10-year fixed-rate mortgages These generate interest income that won't change over the next year even if market rates change.
What are examples of NON-rate-sensitive liabilities?
Liabilities whose interest rates don't change with market rates over the time horizon:
Equity capital (non-interest paying)
Demand deposits (non-interest paying)
Passbook savings (fixed rate)
Two-year time deposits (fixed rate)
What are the main STRENGTHS/ADVANTAGES of the repricing gap model?
Simplicity - Easy to understand and calculate
Information value - Clearly points to net interest income exposure to interest rate changes
Practicality - Widely used by smaller depository institutions as their primary measure of interest rate risk
Book value basis - Uses readily available accounting data
What is the FIRST major weakness of the repricing model?
Ignores market value effects - The model ignores the impact of interest rate changes on the market value of assets and liabilities. It focuses only on book values and doesn't capture capital gains or losses that occur when interest rates change
What is the SECOND major weakness of the repricing model?
Over-aggregative - The distribution of assets and liabilities WITHIN individual maturity buckets is not considered. There can be substantial mismatches within buckets that the model doesn't capture. For example, in the "3-6 month" bucket, one asset might mature in 3 months while another in 6 months.
What is the THIRD major weakness of the repricing model?
Ignores effects of runoffs - Banks continuously originate and retire consumer and mortgage loans. The runoff (early repayment) of rate-insensitive assets/liabilities is actually rate-sensitive because those funds must be reinvested at current rates, but the model doesn't account for this.
What is the FOURTH major weakness of the repricing model?
Ignores off-balance sheet (OBS) cash flows - Off-balance sheet items like loan commitments, letters of credit, and interest rate futures contracts are not included. This means the hedging effects of off-balance sheet items are not captured in the gap analysis.
Why is the repricing model still widely used despite its weaknesses?
Because of its simplicity, information value, and practicality. Smaller depository institutions (the vast majority) still use this model as their primary measure of interest rate risk because it's easy to implement and understand.
What is the PRIMARY cause of liability-side liquidity risk?
When depositors seek to cash in their financial claims immediately. With low cash holdings, the FI may be forced to liquidate assets too rapidly at fire-sale prices (prices much lower than market value under normal conditions).
What is the PRIMARY cause of asset-side liquidity risk?
When a borrower exercises their loan commitment, requesting funds immediately. The FI must provide the committed funds, creating a liquidity need.
What three factors can cause abnormally large and unexpected deposit drains?
Concerns about solvency - Depositors worry about the DI's solvency relative to other DIs
Contagion effect - Failure of a related DI leads to depositor concerns about the solvency of other DIs
Sudden preference changes - Sudden changes in investor preferences (e.g., moving to safer institutions)
How can a liquidity crisis develop into a solvency problem?
As a bank run increases in intensity, more depositors join the withdrawal line. The bank may be forced to sell assets at fire-sale prices (below market value), which can create losses that erode capital. What starts as a liquidity problem (can't meet short-term obligations) becomes a solvency problem (liabilities exceed assets).
What is the contagion effect in banking?
When the failure of one depository institution leads depositors to become concerned about the solvency of other, similar DIs. This can trigger bank runs at healthy institutions simply because they're perceived as similar to the failed bank
What is purchased liquidity management?
A strategy where the DI manager turns to the market for purchased funds (borrowed funds) to meet liquidity needs, rather than selling assets. The FI borrows additional funds to meet withdrawal demands or loan commitments.
What are the main sources of purchased liquidity?
Federal funds market - Interbank market for short-term loans (usually overnight)
Repurchase agreement (repo) markets - Short-term borrowing secured by securities
Other wholesale funding markets
What is the MAIN ADVANTAGE of purchased liquidity management?
It allows the DI to maintain its overall balance sheet size without disturbing the size and composition of the asset side of its balance sheet. The bank doesn't have to sell loans or securities.
What is the MAIN DISADVANTAGE of purchased liquidity management?
Cost - The higher the costs of purchased funds relative to the rates earned on assets, the less attractive this approach becomes. During stress periods, the cost of borrowing can spike dramatically or funding may become unavailable.
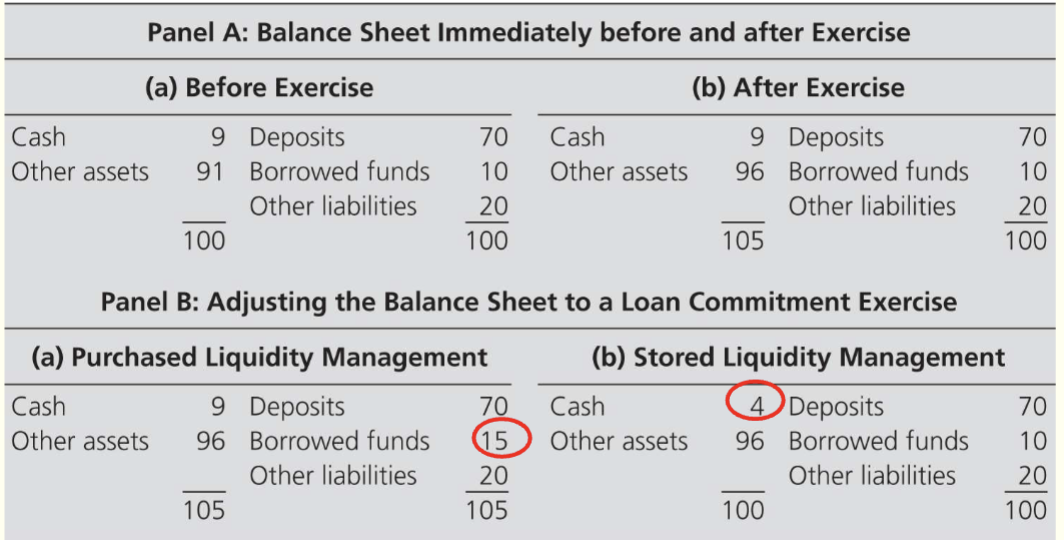
Using the balance sheet example, how does purchased liquidity management work when deposits fall by $5 million?
BEFORE: Deposits = $70M, Borrowed funds = $10M
Deposit drain of $5M occurs
AFTER: Deposits = $65M, Borrowed funds = $15M (increase by $5M)
Total assets remain at $100M
The bank borrows $5M to replace the lost deposits
Why might purchased liquidity management fail during a financial crisis?
During a crisis, wholesale funding markets can freeze up or become prohibitively expensive. If lenders doubt the bank's solvency, they may refuse to lend or demand very high interest rates, making this strategy unavailable or too costly.
What is stored liquidity management?
A strategy where the FI liquidates (sells) some of its assets to meet liquidity needs. The bank holds liquid assets in anticipation of potential liquidity demands.
What assets are typically used in stored liquidity management?
Cash reserves (required and excess reserves)
Treasury securities (highly liquid, low-risk)
Other liquid, marketable securities These are assets that can be quickly converted to cash without significant loss
What are banks' reserve requirements?
Minimum reserve requirements are cash reserves that banks must hold as established by the Federal Reserve. Banks also tend to hold excess reserves beyond this minimum for liquidity management purposes.
: What is the FIRST major disadvantage of stored liquidity management?
Opportunity cost - Holding excessive cash or other liquid assets means sacrificing returns. Cash earns zero return, and Treasury securities typically earn low returns compared to loans. This reduces profitability.
What is the SECOND major disadvantage of stored liquidity management?
Requires holding excess low-return or zero-return assets - The bank must continuously maintain these liquid assets on the balance sheet, tying up resources that could be used for higher-return investments.
What is the THIRD major disadvantage of stored liquidity management?
Decreases size of balance sheet - When liquid assets are used to meet withdrawals, the balance sheet shrinks. This reduces the bank's lending capacity and overall business volume.
Using the balance sheet example, how does stored liquidity management work when deposits fall by $5 million?
BEFORE: Cash = $9M, Other assets = $91M, Deposits = $70M
Deposit drain of $5M occurs
AFTER: Cash = $4M, Other assets = $91M, Deposits = $65M
Total assets shrink from $100M to $95M
The bank uses $5M of its cash reserves to pay depositors
Why do banks hold excess reserves despite the opportunity cost?
To ensure they can meet unexpected liquidity demands without having to:
Sell assets at unfavorable prices
Access expensive wholesale funding markets
Risk failing to meet withdrawal demands (which could trigger a bank run)
Compare the balance sheet impact of purchased vs. stored liquidity management.
Purchased liquidity: Balance sheet size maintained, liability composition changes (less deposits, more borrowings)
Stored liquidity: Balance sheet size decreases, asset composition changes (less cash/liquid assets)
What is asset-side liquidity risk?
The risk that arises when a borrower exercises their loan commitment, requiring the FI to provide funds immediately. This creates an unexpected demand for liquidity from the asset side of the balance sheet.
What is a loan commitment?
A contractual agreement where a bank promises to lend up to a certain amount to a borrower upon request. The borrower can "draw down" or exercise this commitment at their discretion (within the terms of the agreement).