measurements and errors
 Call Kai
 Learn
Learn Practice Test
 Spaced Repetition
 Match
Match Flashcards
 Knowt Play
1/39

There's no tags or description
Looks like no tags are added yet.
Name | Mastery | Learn | Test | Matching | Spaced | Call with Kai | Chat |
|---|
No analytics yet
Send a link to your students to track their progress
40 Terms
what are SI units
-they are fundamental base units
what are SI units made up of
-mass (kg)
-temperature(k)
-length(m)
-time(s)
-amount of substance(mol)
-electric current (A)
what can happen to the Si units
they can be derived eg f=ma to find the SI units of force (F0 multiply the units of mass and acceleration kg x ms -2 to kgm s -2 (Also known as N)
wwhat are the multiplier of the prefixes which could be added before any of the above SI units:
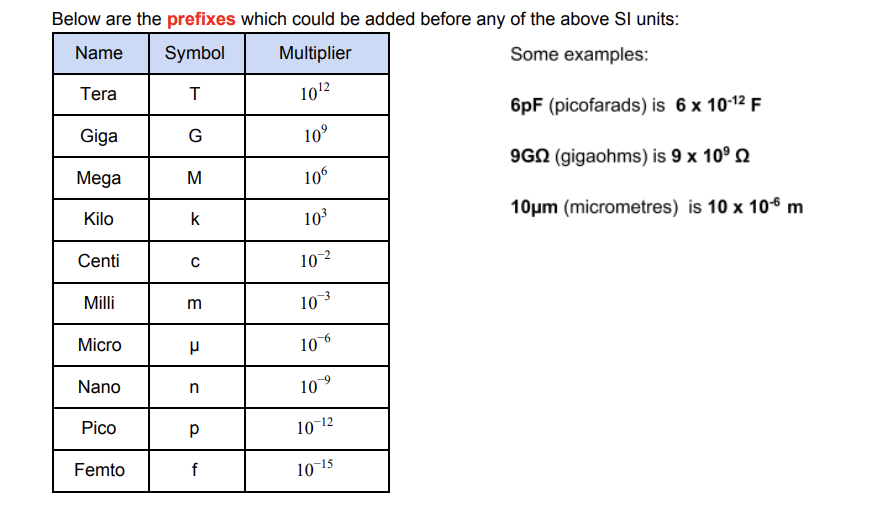
-convert mega electrons volts to joules
-convert kWh to joules

random errors
affect precision meaning they cause differences in measurements which causes a spread about the mean. you cannot get rid of all random errors
what are ways to reduce random errors
Take at least 3 repeats and calculate a mean, this method also allows anomalies to be identified.
● Use computers/data loggers/cameras to reduce human error and enable smaller intervals.
● Use appropriate equipment, e.g a micrometer has higher resolution (0.1 mm) than a ruler (1 mm).
systematic errors
affect accuracy and occur due to the apparatus or faults in the experimental method. systematic errors cause all results to be too high or too low by the same amount each time
to reduce systematic error
-calibrate apparatus by measuring known value and if the reading is inaccurate then the systematic error is easily identified
-in radiationn experiments correct for background radiation by measuring it beforehand and excluding it from final results
-read the meniscus (central curve on the surface of a liquid) at eye level ( to reduce parallex error) and use controls in experiments
precision
precise measurements are consistent, they fluctuate slightly about a mean value-this doesnt indicate the value is accurate
repeatability
if the original experimenter can do the experiment with the same equipment and method then get the same results it is repeatable
reproducibility
if the experiment is redone by a different person or with different techniques and equipment and the same results are found, it is reproducible
resolution
the smallest change in the quantity bein measured that gives a recognisable change in the reading
accuracy
a measurement close to the true value is accurate
uncertainty
is the bounds in which accurate value can be expected to life
absolute uncertainty
uncertainty given as a fixed quantity
fractional uncertainty
uncertainty given as a fraction of the measurement
percentage uncertainty
uncertainty as a percentage of the measurement
how to reduce percentage or fractional uncertainty
you can measure larger quantities
what is the uncertainty in a reading
The uncertainty in a reading is ± half the smallest division, e.g. for a thermometer the smallest division is 1°C so the uncertainty is ±0.5°C.
the uncertainty in a measurement
The uncertainty in a measurement is at least ±1 smallest division, e.g. a ruler, must include both the uncertainty for the start and end value, as each end has ±0.5mm, they are added so the uncertainty in the measurement is ±1mm.
uncertainty in digital readings
Digital readings and given values will either have the uncertainty quoted or assumed to be ± the last significant digit e.g. 3.2 ± 0.1 V, the resolution of an instrument affects its uncertainty.
uncertainty for repeated data
For repeated data the uncertainty is half the range (largest - smallest value), show as mean ± .range/2
how to reduce uncertainty
You can reduce uncertainty by fixing one end of a ruler as only the uncertainty in one reading is included. You can also reduce uncertainty by measuring multiple instances, e.g. to find the time for 1 swing of a pendulum by measuring the time for 10 giving e.g. 6.2 ± 0.1 s, the time for 1 swing is 0.62 ± 0.01s (the uncertainty is also divided by 10)
what significant figure should uncertainties be given at
Uncertainties should be given to the same number of significant figures as the data.
combining uncertainities
Adding / subtracting data - ADD ABSOLUTE UNCERTAINTIES
-Multiplying / dividing data - ADD PERCENTAGE UNCERTAINTIES
-Raising to a power - MULTIPLY PERCENTAGE UNCERTAINTY BY POWER
-rooting- DIVIDE PERCENTAGE UNCERTAINTY BY THE NUMBER
uncertainties in graphs
Uncertainties are shown as error bars on graphs, e.g. if the uncertainty is 5mm then have 5 squares of error bar on either side of the point A line of best fit on a graph should go through all error bars (excluding anomalous points).
how can the uncertainty in a gradient be found
he uncertainty in a gradient can be found by lines of best and worst fit, this is especially useful when the gradient represents a value such as the acceleration due to gravity: ● Draw a steepest and shallowest line of worst fit, it must go through all the error bars. ● Calculate the gradient of the line of best and worst fit, the uncertainty is the difference between the best and worst gradients.
percentage uncertainty

When the best and worst lines have different y intercepts, you can find the uncertainty in the y-intercept, which is |best y intercept-worst y intercept|:

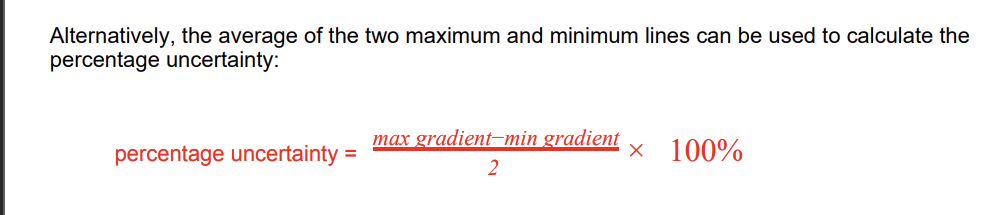
Alternatively, the average of the two maximum and minimum lines can be used to calculate the percentage uncertainty:
orders of magnitude
powers of ten which describe the size of an object and which can also be used to compar the sizes of object
You may be asked to give a value to the nearest order of magnitude,

what is the purpose of estimation
Estimation is a skill physicists must use in order to approximate the values of physical quantities, in order to make comparisons, or to check if a value they’ve calculated is reasonable.
resolution
is the smallest change in the quantity being measured that gives a recognisable change in the reading
vernier calipers
have. a resolution of 0.1mm which is better than a ruler 1mm meaning they can make more accurate measurements. they have two scales, the main scale and the vernier scale
in order to read any instrument with a vernier scale you must
find the milimetre value from main scale, by taking the marked value below zeron on the vernier scale. in the example, it would be 12mm
find the mark on the vernier scale which aligns perfectly with the marked reading on main scale. in the example this would be the 4th mark along (the markss from both scale with form a straight line) which represents 0.4mm, as each mark on the vernier scale represents a tenth of a milimeter
add you two measured values

micrometers
-work in a similar fashion to vernier caliper however they have a higher resolution of 0.01mm and are usually used to measure diameter or thickness of an object.
how to use a micrometer
place the object to be measured between jaw of the micrometer
the barrel of the micrometer has two scales one which is horizontal (barrel scale) and one which is vertical (thimble scale). the barrel scale will give a reading of milimeters and half milimeters
read the barrel scale by looking at the edge of the micrometer thimble (this is the part that tunrs) if the thimble is over the 4th milimeter marking after 10 mm, you are reading 14 mm andif it is on/just over the half milimeter marking after 14mm, then the reading is 14.5 mm
for more precise measurements, find where the thimble scale lines up exactly with the axis of the barrel scale, each mark on the thimble scale represents 0.01 of a mm. if this is 33 then add 0.33 to the barrel scale reading (14.5mm) to give a measurement of 14.83mm