MicroEC Midterm Practice
1/24
Earn XP
Description and Tags
Name | Mastery | Learn | Test | Matching | Spaced | Call with Kai |
|---|
No analytics yet
Send a link to your students to track their progress
25 Terms
The basic concern of microeconomics is:
A) Keep business firms from losing money.
B) Prove that capitalism is better than socialism.
C) Study the choices people make.
D) Use unlimited resources to produce goods & services to satisfy limited wants.
C) Study the choices people make.
Scarcity in economics means that:
A) We often do not have sufficient resources to achieve our objectives.
B) The wants of people are limited.
C) There must be poor people in rich countries.
D) Shortages exist in nearly all markets.
A) We often do not have sufficient resources to achieve our objectives.
The opportunity cost of something is:
A) Larger during periods of rising prices.
B) Equal to the monetary cost.
C) Smaller during periods of falling prices.
D) What is given up to acquire it.
D) What is given up to acquire it.
If you decide to go to Cancún with your friends during spring break, you cannot go to Paris with your sister in the summer. Which economic principle does this statement BEST represent?
A) The true cost of something is its opportunity cost.
B) “How much” is a decision at the margin.
C) People usually respond to incentives, exploiting opportunities to make themselves better off.
D) There are gains from trade.
A) The true cost of something is its opportunity cost.
Because people usually exploit opportunities to make themselves better off, if the price of gasoline falls and stays low for an extended period, we expect people to:
A) reduce their reliance on gasoline-powered cars.
B) buy larger and less fuel-efficient cars.
C) use more public transportation.
D) ride bicycles.
B) Buy larger & less fuel-efficient cars.
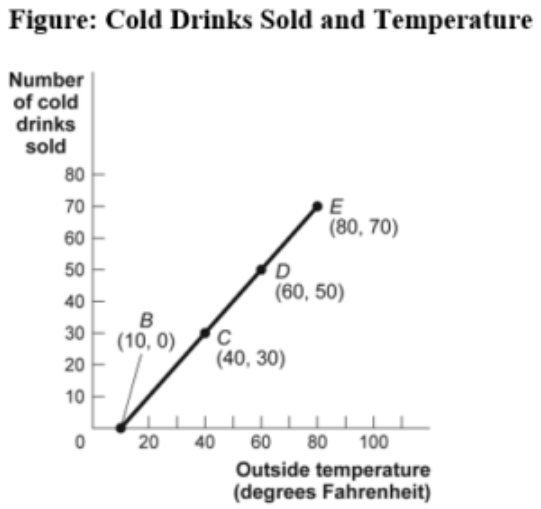
(Figure: Cold Drinks Sold and Temperature) Use Figure: Cold Drinks Sold and Temperature. If we move from point B to point C in the figure, the outside temperature has _____ degrees and the number of cold drinks sold has _____.
A) decreased by 30; decreased by 30
B) increased by 20; increased by 20
C) increased by 30; increased by 30
D) increased by 40; increased by 40
C) increased by 30; increased by 30
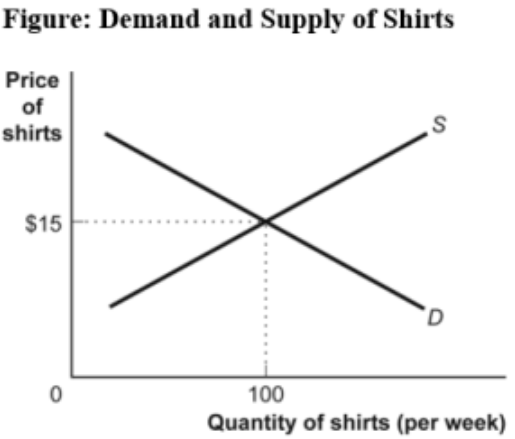
(Figure: Demand and Supply of Shirts) Use Figure Demand and Supply of Shirts. If the line labeled S shows how many shirts per week will be offered for sale at various prices, then it is clear that, for supply, quantity and price are:
A) the same.
B) positively related.
C) negatively related.
D) not related.
B) Positively related.
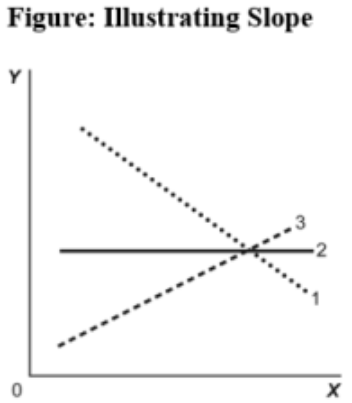
(Figure: Illustrating Slope) Use Figure: Illustrating Slope. In the graph, line 3 depicts X and Y to be:
A) positively related.
B) unrelated.
C) negatively related.
D) both fixed in value.
A) Positively related.
A scatter diagram shows:
A) how far apart dependent variables are.
B) individual points of data showing both variable values.
C) the slope of a line.
D) the intercept of a curve.
B) The individual points of data showing both variable values.
The ratio of the change in the variable on the vertical axis to the change in the variable on the horizontal axis, measured between two points on the curve, is the:
A) axis.
B) slope.
C) dependent variable.
D) independent variable.
B) Slope
When building a model, economists:
A) simplify reality to highlight what really matters.
B) attempt to duplicate reality in all of its complexity.
C) ignore the facts and instead try to determine what the facts should be.
D) are careful to avoid the scientific method.
A) Simplify reality to highlight what really matters.
Technological improvements will:
A) leave the production possibility frontier unchanged.
B) shift the production possibility frontier inward.
C) shift the production possibility frontier outward.
D) necessarily lead to increased unemployment.
C) Shift the production possibility frontier outwards.
The opportunity cost of production:
A) is the price of a good.
B) is what you give up to produce the good.
C) decreases as production increases.
D) is what you gain by producing the good.
B) Is what you give up to produce the good.
If farmer Sam MacDonald can produce 200 pounds of cabbages and no potatoes or no cabbages and 100 pounds of potatoes and if he faces a linear production possibility frontier, the opportunity cost of producing an additional pound of potatoes is _____ pound(s) of cabbage.
A) 0.5
B) 2
C) 100
D) 200
B) 2
Because Casey can type reports faster and more accurately than Ahmet, Casey has a(n) _____ in typing reports.
A) comparative advantage
B) absolute advantage
C) opportunity cost
D) specialization
B) Absolute Advantage??
The market for corn in Kansas is considered to be competitive. This means there are _____ buyers and _____ sellers of corn in Kansas.
A) many; few
B) few; many
C) many; many
D) few; few
C) many; many
A negative relationship between quantity demanded and price is called the law of:
A) demand.
B) increasing returns.
C) market clearing.
D) supply.
A) Demand
An announcement that smoking will harm your ability to think clearly will MOST likely result in:
A) an increase in the quantity of cigarettes demanded.
B) a decrease in the demand for cigarettes.
C) no change in smoking habits.
D) an increase in the price of cigarettes.
B) A decrease in the demand for cigarettes.
If goods A and B are substitutes, a decrease in the price of good B will:
A) increase the demand for good A.
B) increase the demand for good B.
C) decrease the demand for good A.
D) increase the demand for good B and decrease the demand for good A.
C) Decrease in the demand for good A.
The primary difference between a change in supply and a change in the quantity supplied is that:
A) a change in quantity supplied is a movement along the supply curve, while a change in supply is a shift in the supply curve.
B) both a change in quantity supplied and a change in supply are movements along the supply curve, only in different directions.
C) a change in supply is related to the supply curve, while a change in quantity supplied is related to shifts in the demand curve that shift the supply curve.
D) a change in supply is a movement along the supply curve, while a change in quantity supplied is a shift in the supply curve.
A) A change in quantity supplied is a movement along the supply curve, while a change in supply is a shift in the supply curve.
Which factor would cause an INCREASE in the supply of a good?
A) input prices rising
B) a fall in the price of the good
C) an increase in the number of sellers
D) expectations of future price increases
C) An increase in the number of sellers.
Excess supply occurs when the:
A) price is above the equilibrium price.
B) quantity demanded exceeds the quantity supplied.
C) price is below the equilibrium price.
D) quantity demanded exceeds the quantity supplied and the price is below the equilibrium price.
A) Price is above the equilibrium price.
Market equilibrium occurs when:
A) there is no incentive for prices to change in the market.
B) quantity demanded equals quantity supplied.
C) the market clears.
D) there is no incentive for prices to change in the market, quantity demanded equals quantity supplied, and the market clears.
D) There is no incentive for prices to change in the market, quantity demanded equals quantity supplied, & the market clears.
A decrease in the price of eggs will result in a(n):
A) increase in the demand for eggs.
B) increase in the supply of eggs.
C) shift in the supply curve for eggs.
D) movement along the demand curve for eggs.
D) Movement along the demand curve for eggs.
The _____ tomatoes will decrease if fertilizer prices rise.
A) demand for
B) shortage of
C) supply of
D) equilibrium price of
C) supply of