Teeling L3 & L4: Cladistics and Phylogenetic
1/430
There's no tags or description
Looks like no tags are added yet.
Name | Mastery | Learn | Test | Matching | Spaced | Call with Kai |
|---|
No analytics yet
Send a link to your students to track their progress
431 Terms
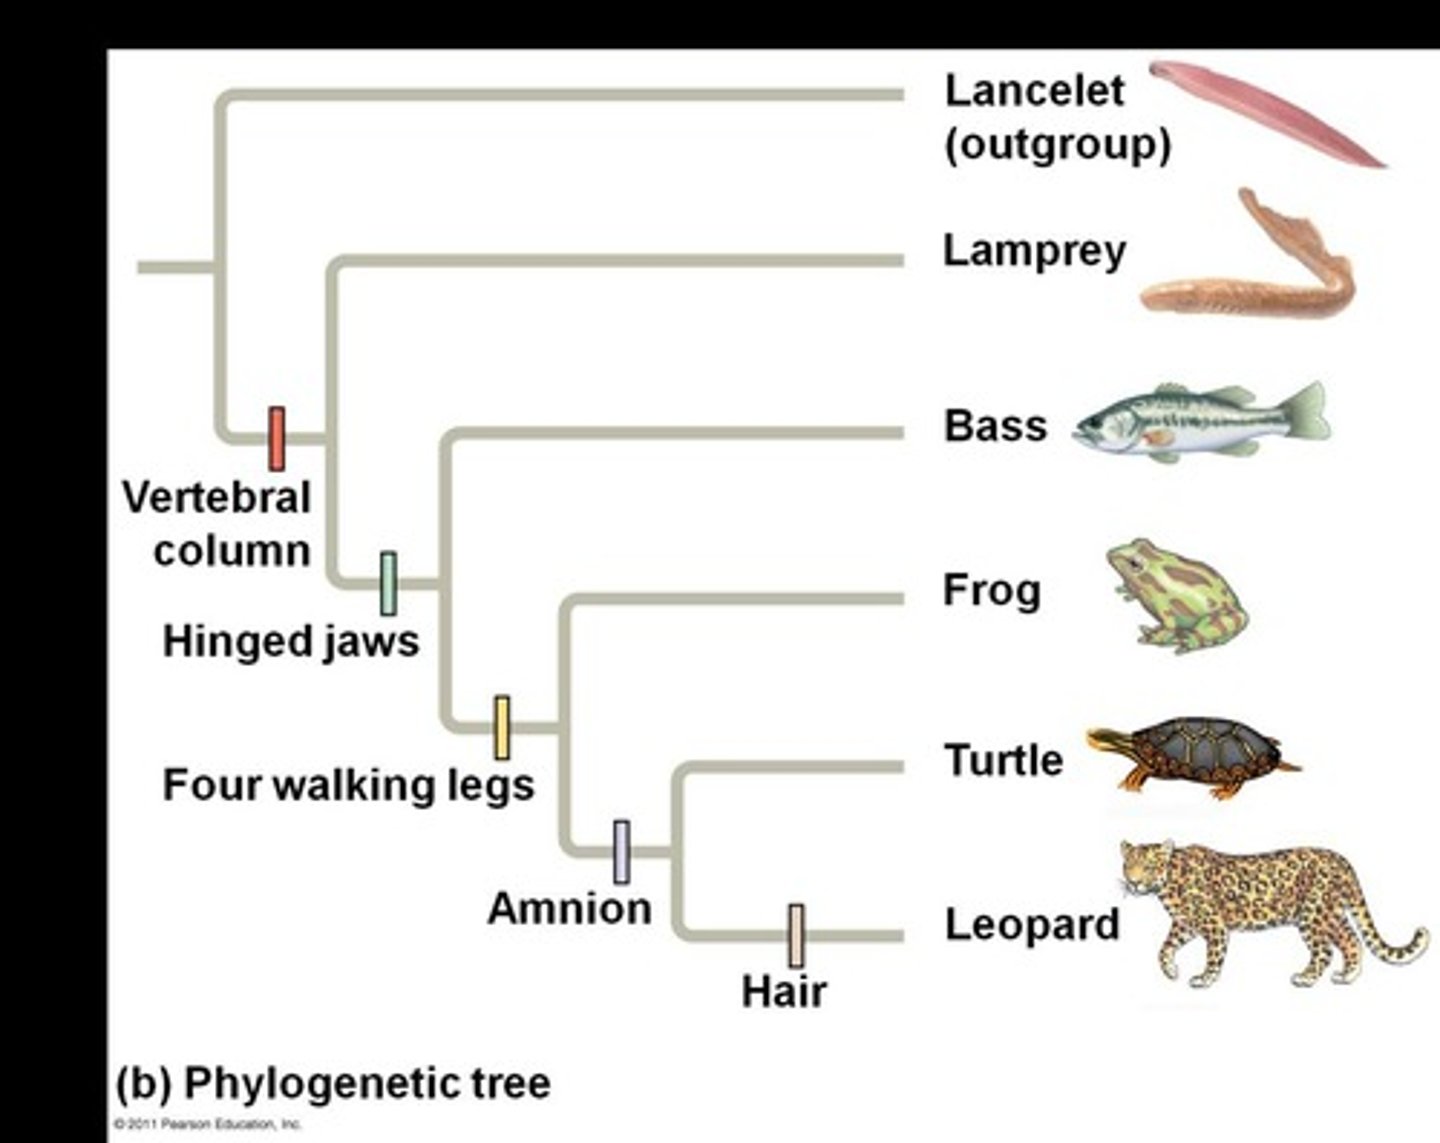
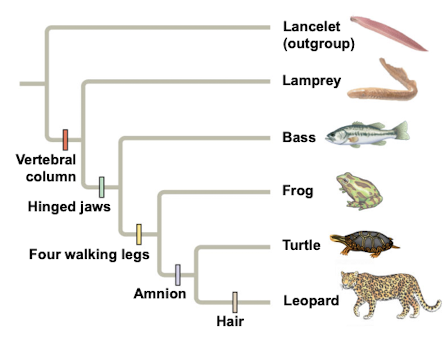
Phylogenetic tree
Diagram showing evolutionary relationships among species.
Homologous characters
Traits derived from a common ancestor.
Cladistics
Classification of organisms based on common descent.
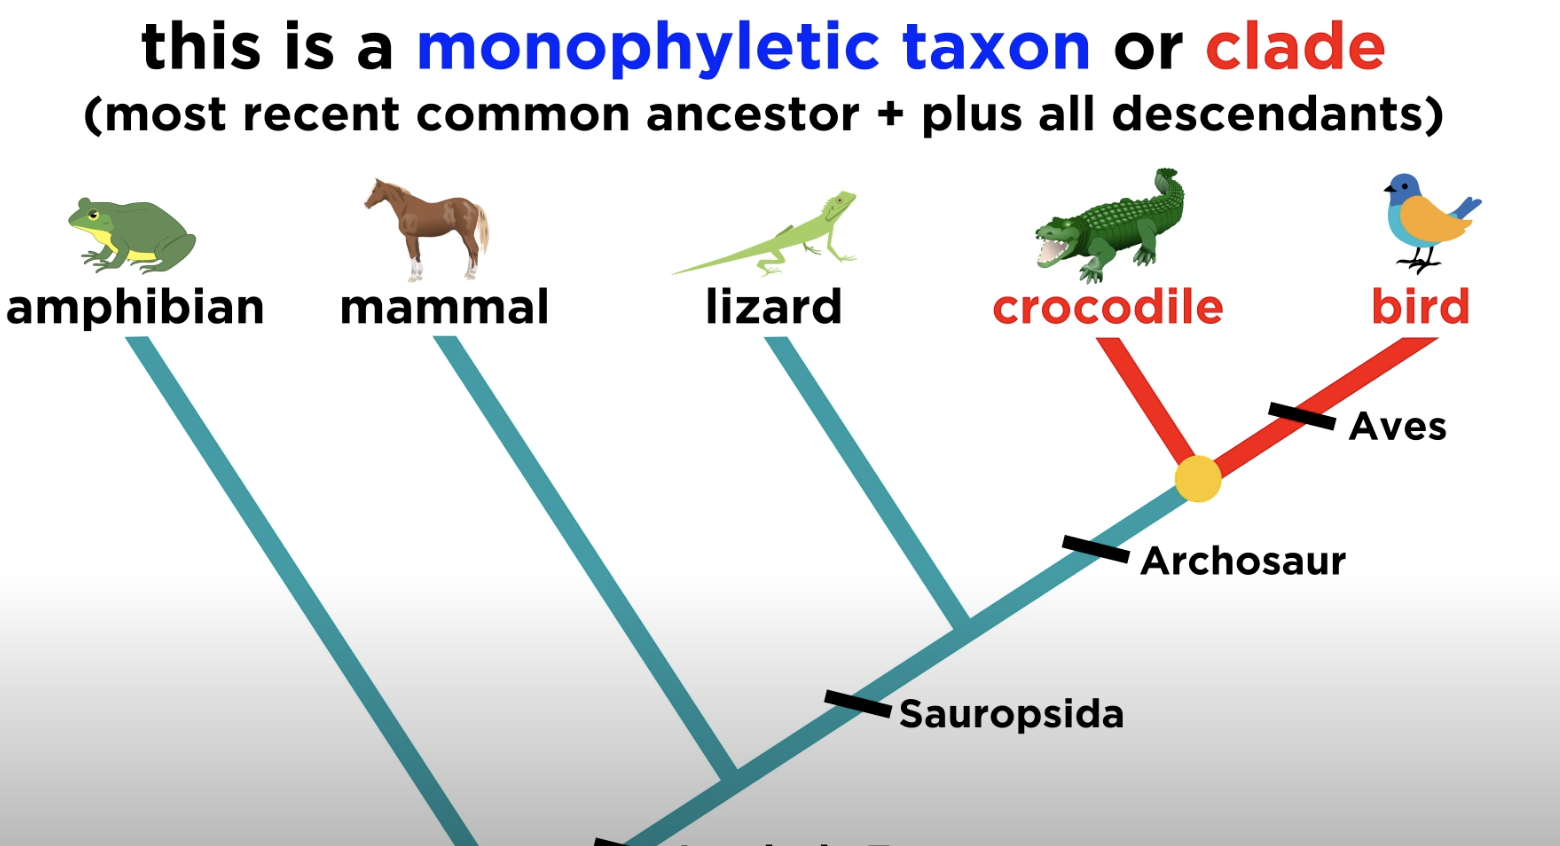
Clade
Group including an ancestor and all descendants.
Monophyletic group
A clade consisting of a common ancestor and all its descendants.
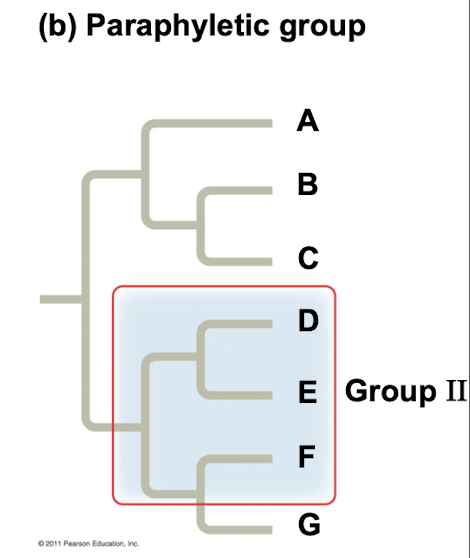
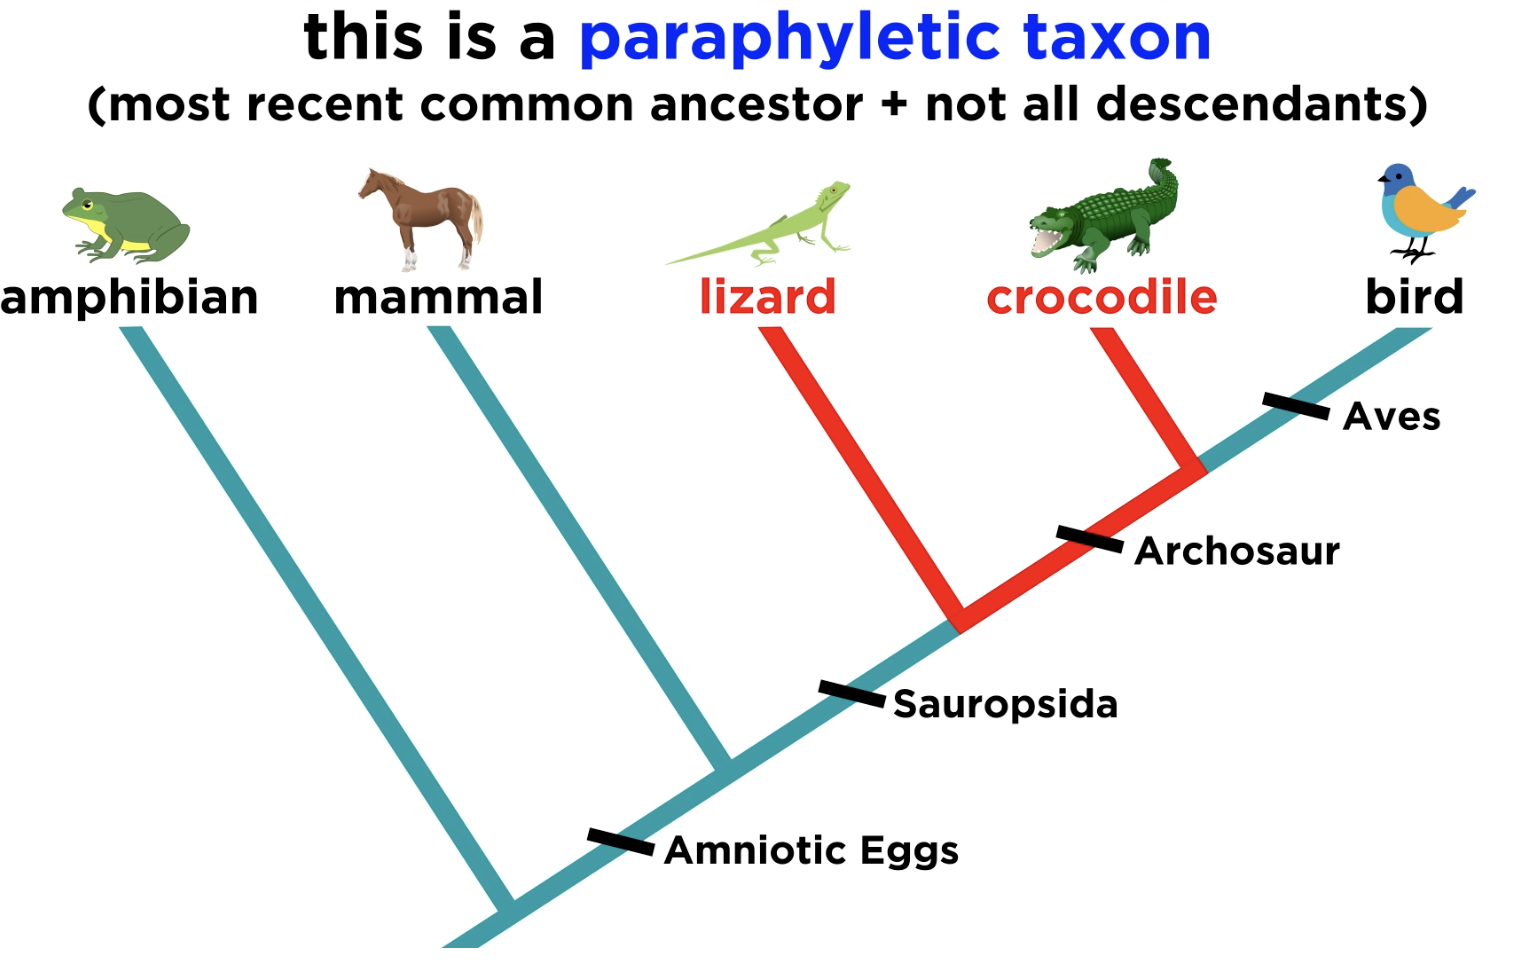
Paraphyletic group
Grouping consists of an ancestral species with some, but not all, descendants.
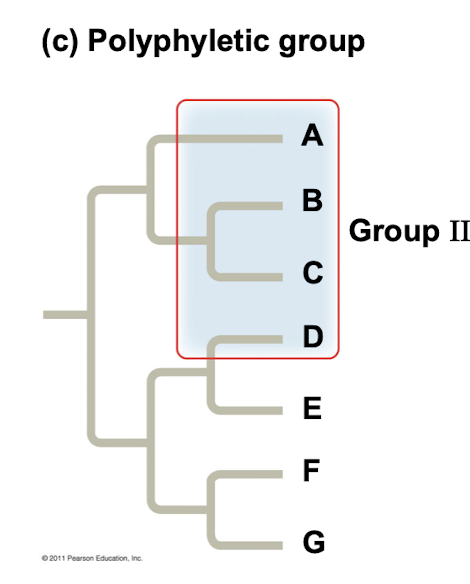
Polyphyletic group
Grouping consists of various species from different ancestors, doesn’t include recent common ancestry

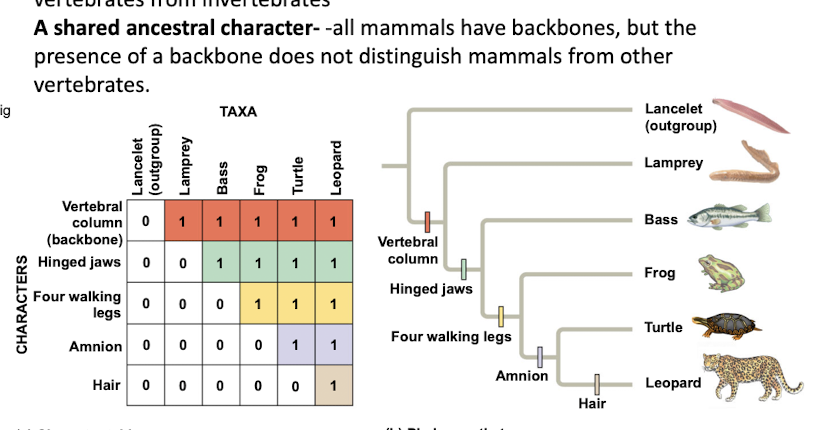
Shared ancestral character
Trait originating in an ancestor of the taxon.
It is used in cladistics to help construct phylogenetic trees, indicating common ancestry among species.
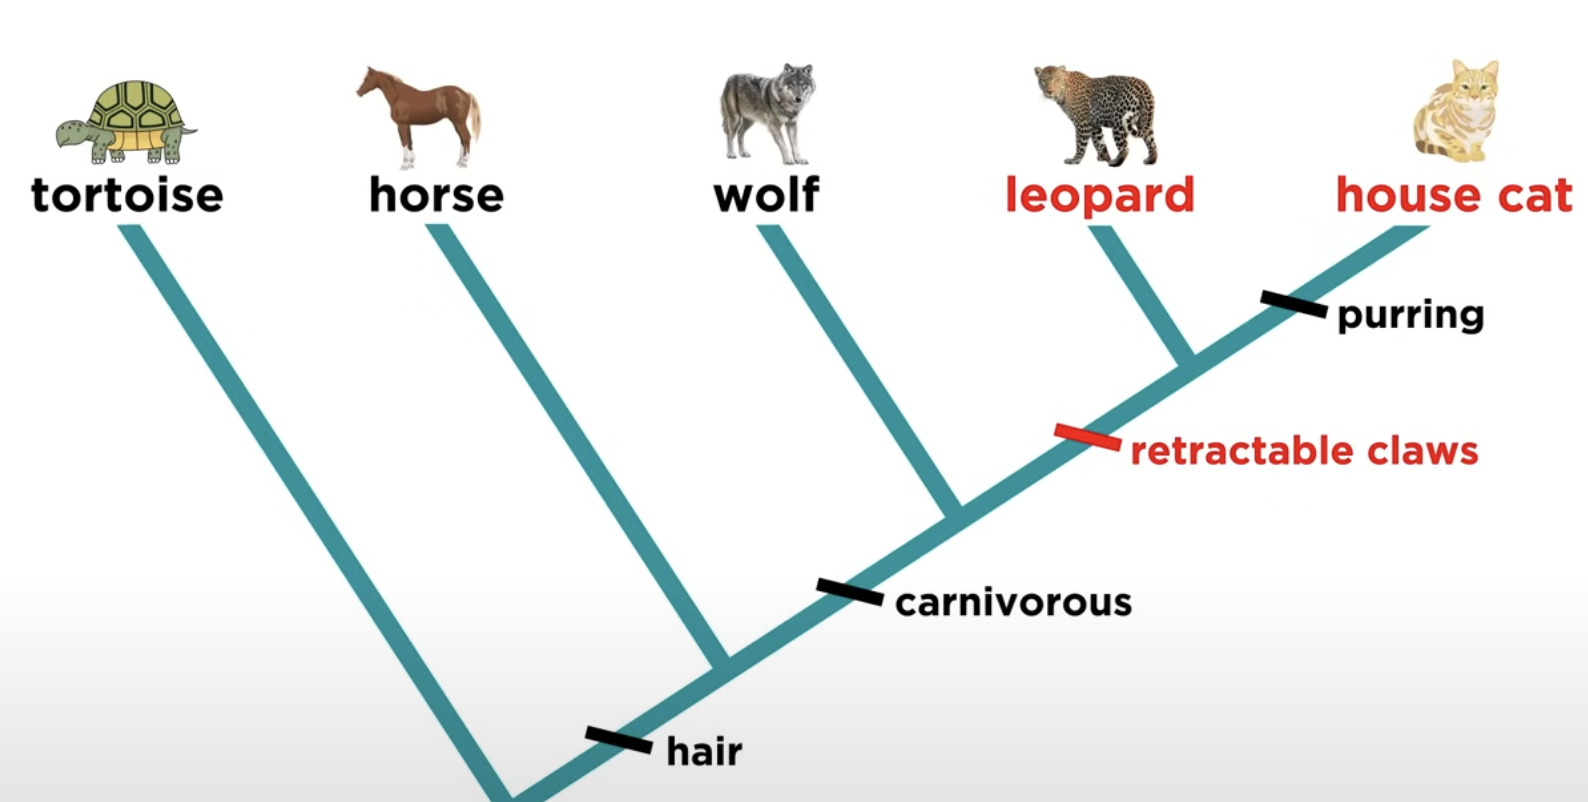
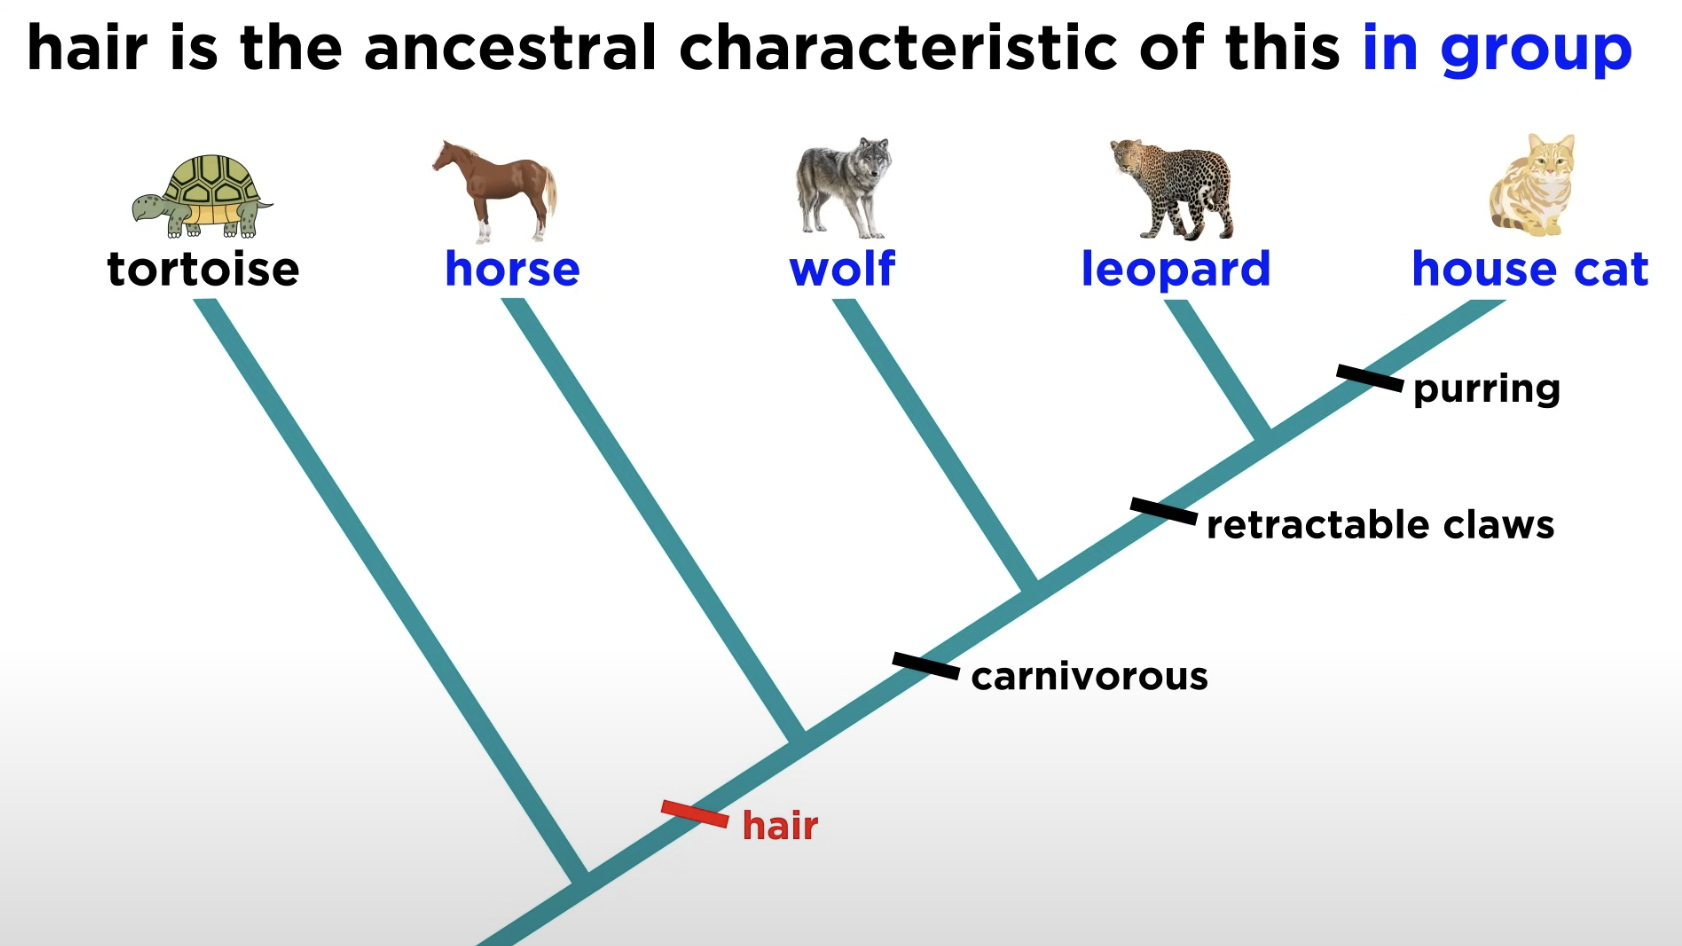
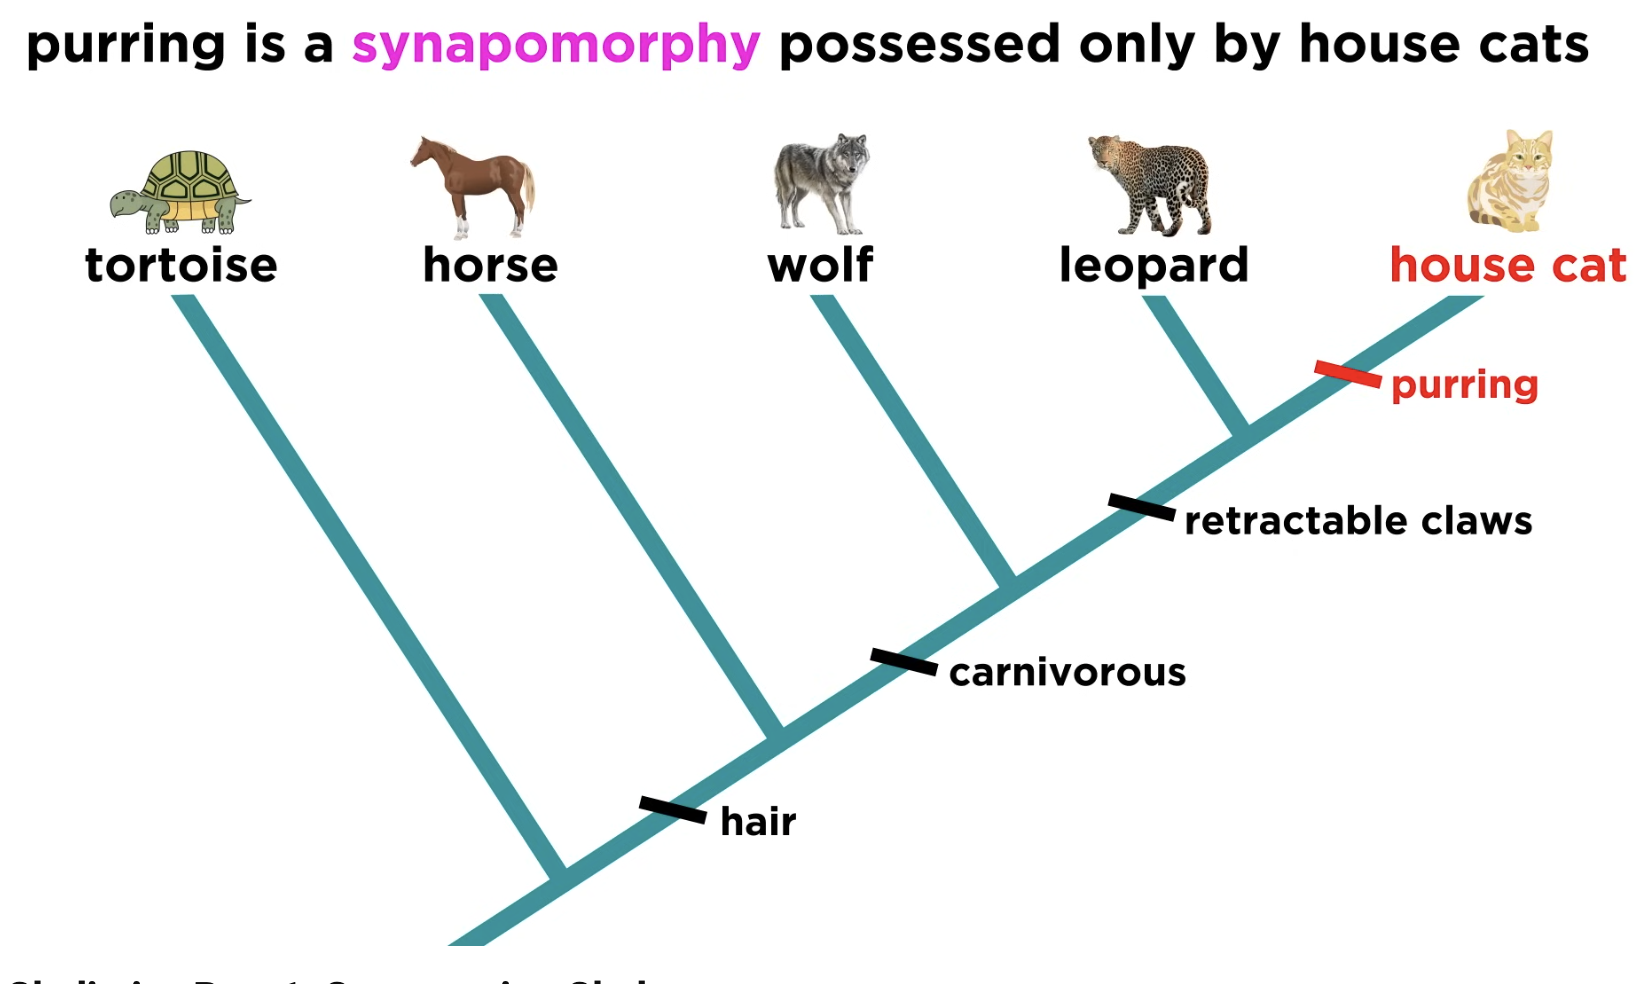
Shared derived character
Novel trait unique to a specific clade.
eg Hair is a shared derived character that identifies mammals and distinguishes them from other vertebrates.
Character status
Relative classification of traits in phylogenetic analysis.
Evolutionary relationships
Connections between species based on shared traits.
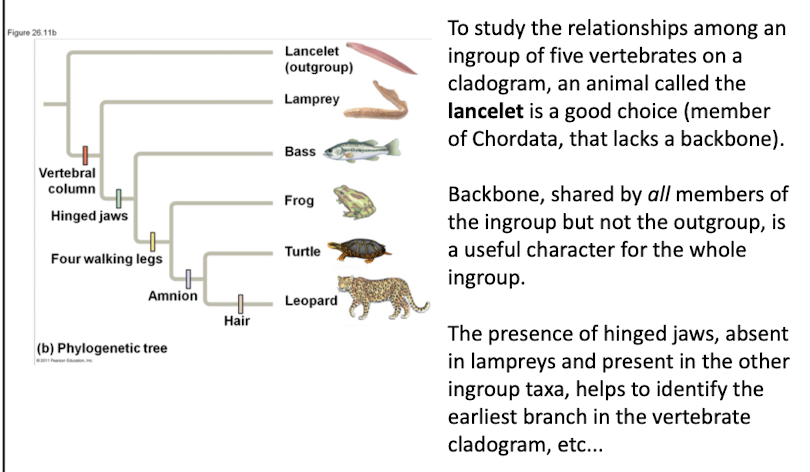
Outgroup
An outgroup is a species or group of species that is closely related to the ingroup, the various species being studied
• The outgroup is a group that has diverged before the ingroup
• Systematists compare each ingroup species with the outgroup to differentiate between shared derived and shared ancestral characteristics
• Characters shared by the outgroup and ingroup are ancestral characters that predate the divergence of both groups from a common ancestor
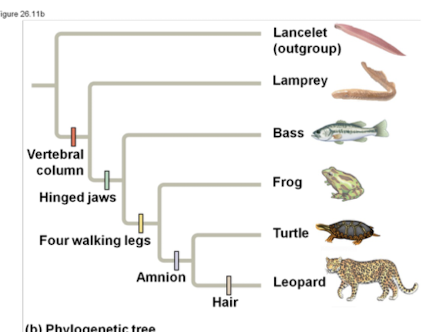
Vertebral column
Backbone distinguishing vertebrates from invertebrates.
Hinged jaws
Derived character present in some vertebrates.
Four walking legs
Derived trait in certain tetrapods.
Amnion
Membrane surrounding embryo in amniotes.
Character table
Matrix displaying presence/absence of traits across taxa.
Phylogenetic analysis
Study of evolutionary relationships using shared traits.
Taxon
Group of one or more populations of organisms.
Evolutionary novelty
New trait that appears in a clade.
Branch point
Node in a phylogenetic tree indicating divergence.
Nested clades
Clades contained within larger clades.
Cladogram
Tree diagram representing clades and their relationships.
Outgroup
Species related to ingroup, diverged earlier.
Ingroup
Group of species being studied in analysis.
Shared derived characters
Traits evolved in a common ancestor, unique to a group.
eg the backbone is a shared derived character that at branch point distinguishes vertebrates from invertebrates
Shared ancestral characters
Traits present in both outgroup and ingroup.
eg backbone is shared by all members in the ingroup but not the outgroup (lancelet)
Cladistic analysis
Method to study evolutionary relationships among species.
Maximum parsimony
Tree requiring fewest evolutionary events is preferred.
Maximum likelihood
Tree reflecting most probable evolutionary sequence is preferred.
Character table
Matrix displaying traits across different taxa.
Chordata
Phylum including vertebrates and lancelets.
Vertebral column
Backbone structure present in vertebrates.
Hinged jaws
Jaw structure allowing movement, found in some vertebrates.
Four walking legs
Limbs adapted for terrestrial locomotion in some species.
Synapomorphy
Shared derived trait used to define a clade.
Convergent evolution
Independent evolution of similar traits in different species.
Reversal evolution
Return to an ancestral trait after divergence.
Lancelet
Outgroup species lacking a backbone, member of Chordata.
Lamprey
Jawless fish, part of vertebrate ingroup.
Bass
Type of fish within the vertebrate ingroup.
Turtle
Reptile with a shell, part of vertebrate ingroup.
Leopard
Mammal with hair, part of vertebrate ingroup.
Phylogenetic Hypotheses
Proposed explanations for evolutionary relationships among species.
Parsimony
Method minimizing the number of evolutionary changes.
Molecular Systematics
Study of genetic data to understand evolutionary relationships.
Ancestral Sequence
Original DNA sequence from which species diverged.
Phylogenetic Trees
Diagrams representing evolutionary relationships among species.
Branch Length
Indicates genetic changes or chronological time in trees.
Phylogenetic Bracketing
Predicting ancestor features from descendant characteristics.
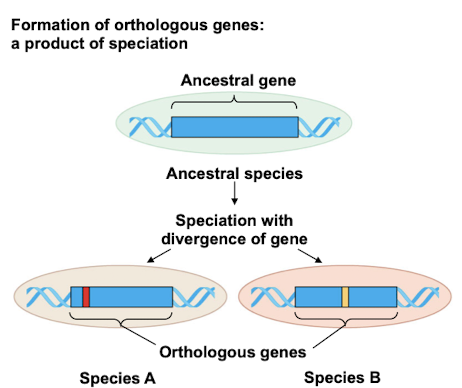
Orthologous Genes
Genes diverged due to speciation events and retain the same function in different species. They are used to study evolutionary relationships between species.
Paralogous Genes
Genes diverged within the same species via duplication where they acquire different functions over time.
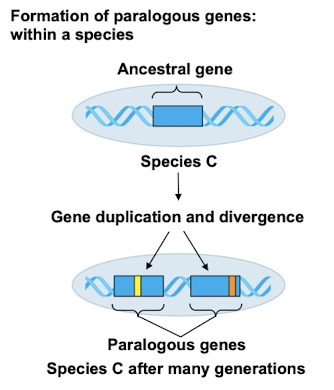
Gene Duplication
Process increasing gene number for evolutionary opportunities.
• Repeated gene duplications result in gene families
• Like homologous genes, duplicated genes can be traced to a common ancestor
Gene Families
Groups of related genes from repeated duplications.
Pseudogenes
Non-functional genes that have lost coding ability.
Can be formed from paralogous genes through mutation or gene duplication, often resulting in sequences that are similar to functional genes but do not produce proteins.
They will have relatively high rates of mutation and may provide insights into evolutionary history.
Morphological Data
Physical characteristics used in phylogenetic analysis.
Molecular Data
Genetic information utilized to infer evolutionary relationships.
Fossil Record
Historical evidence of past life forms and evolution.
Common Ancestor
Most recent species from which multiple species evolved.
Evolutionary Changes
Alterations in genetic makeup over generations.
Speciation
Formation of new species through evolutionary processes.
Natural Selection
Process where advantageous traits become more common.
Mutation Rates
Frequency of changes in DNA sequences over time.
Chronological Time
Time scale used to represent evolutionary history.
Genetic Changes
Alterations in DNA sequences across generations.
Divergence of Genes
Evolutionary process where genes evolve differently.
Gene Duplication
Process increasing gene number in genomes.
Olfactory Receptor Genes
Largest gene family in mammalian genomes.
OR Gene Count
Approximately 1000 intronless genes, each 1kb.
Class I OR Genes
Over 51 genes for waterborne odors.
Class II OR Genes
1-50 genes for airborne odors.
Functional OR Gene Repertoires
Comparison across 50 mammalian genomes.
Ecological Traits
Factors influencing OR gene repertoires.
Heatmap Analysis
Visual representation of functional gene distribution.
Ecotype Partitioning
Grouping OR genes by ecological categories.
Terrestrial Environment
Land-based ecological group for OR genes.
Aquatic Environment
Water-based ecological group for OR genes.
Semi-Aquatic Environment
Mixed habitat for OR gene adaptation.
Volant Environment
Airborne habitat influencing OR gene variation.
Loss of Function
Evolutionary reduction in gene functionality.
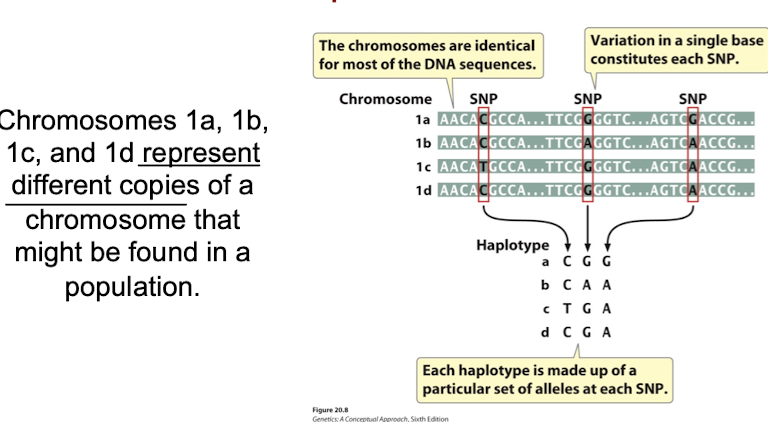
Single-Nucleotide Polymorphisms (SNPs)
Variations at single base pairs in genomes.
Haplotype
Specific set of SNPs & other genetic variations on a chromosome.
Linkage Disequilibrium
Non-random association of alleles at loci.
Genome-Wide Association Studies
Research linking SNPs to traits or diseases.
Nonsynonymous SNPs
Variants altering amino acids in proteins.
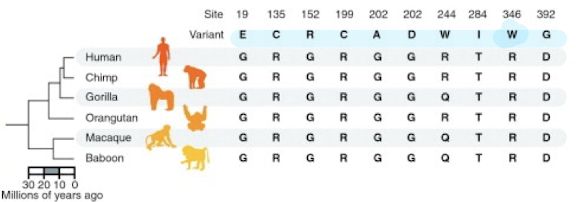
What disease is associated with variation in a gene ?
Miller Syndrome - Rare disorder linked to DHODH gene mutations:
Causes distinctive craniofacial and limb abnormalities / malformations
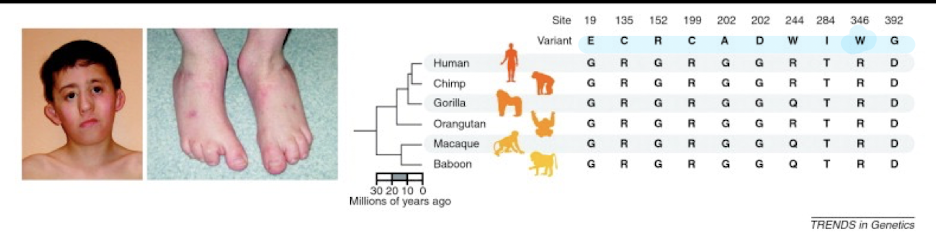
DHODH Mutations
10 different non-synonymous (AA- altering) mutations associated with Miller Syndrome that are not found in other mammals
50% of mutations are found at completely conserved positions in over 46
vertebrates.
These sites evolve 40% slower than sites in DHODH associated with non-
disease polymorphism
Visual Impairment Statistics
314 million affected globally, 45 million blind.
Hearing Impairment Statistics
1 in 1000 newborns affected, >50% elderly.
Genetic Disorder Awareness
Only 10% of affected individuals know causes.
Genotype
Genetic constitution of an organism.
Phenotype
Observable characteristics resulting from genotype.
Disease Prediction
Forecasting disease risk using genetic data.
Evolutionary Conservation
Preservation of genetic sequences over time.
Horseshoe Bat
Species used in comparative genetic studies.
Philippine Tarsier
Another species in comparative genetic studies.
Non-synonymous SNPs
Mutations that alter amino acid sequences.
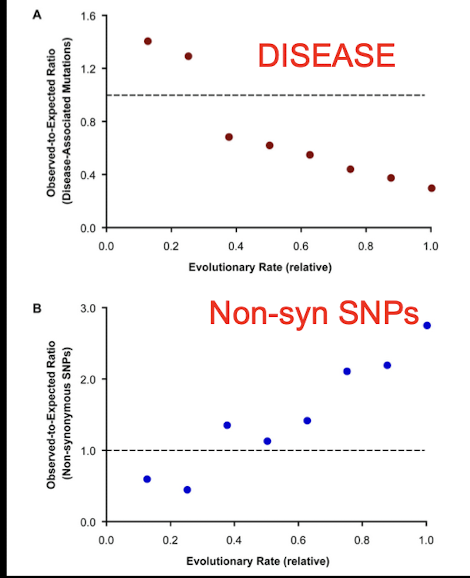
How can we predict what SNPs will cause disease?
Fine-tuned disease prediction:
Evolutionary anatomies of positions and types of disease-associated and neutral amino acid mutations in the human genome eg Subramanian and Kumar 2009
541 genes analysed in human, mouse, chicken, fungi
Disease-Associated Mutations: in conserved regions
Non-synonymous SNPs in regions under positive/relaxed selection
Comparative studies can help categorizing SNPs into benign, possibly-damaging, and probably- damaging categories
Positive Selection
Natural selection favoring advantageous mutations.
Relaxed Selection
Reduced selection pressure on genetic variations.