1.6 Market Equilibrium and Changes in Equilibrium
1/17
There's no tags or description
Looks like no tags are added yet.
Name | Mastery | Learn | Test | Matching | Spaced |
|---|
No study sessions yet.
18 Terms
Equilibrium
When supply = demand, there is equilibrium in the market
Equilibrium creates a single price and quantity for a good/service for that market
Requirements for a supply & demand graph
Label ACES
Axis
Curves
Equilibrium
Shifts
Changes in Equilibrium
When supply or demand changes, the equilibrium price & quantity change
Increase in Demand graph
D →
P increase
Q increase
Decrease in Demand graph
D ←
P decrease
Q decrease
Increase in Supply graph
S →
P decrease
Q increase
Decrease in Supply graph
S ←
P increase
Q decrease
Simultaneous Increase in Supply and Demand
P ? indeterminate
Q increase
Simultaneous Decrease in Supply and Demand
P ? indeterminate
Q decrease
Simultaneous Supply decrease & Demand increase
P increase
Q ? indeterminate
Simultaneous Supply increase & Demand decrease
P decrease
Q ? indeterminate
Market Disequilibrium
Surplus (Price Floor)
Shortage (Price Ceiling)
Surplus
Price is TOO high, so consumers’ demand is lower than supply
Shortage
Price is TOO low, so consumers’ demand is higher than supply
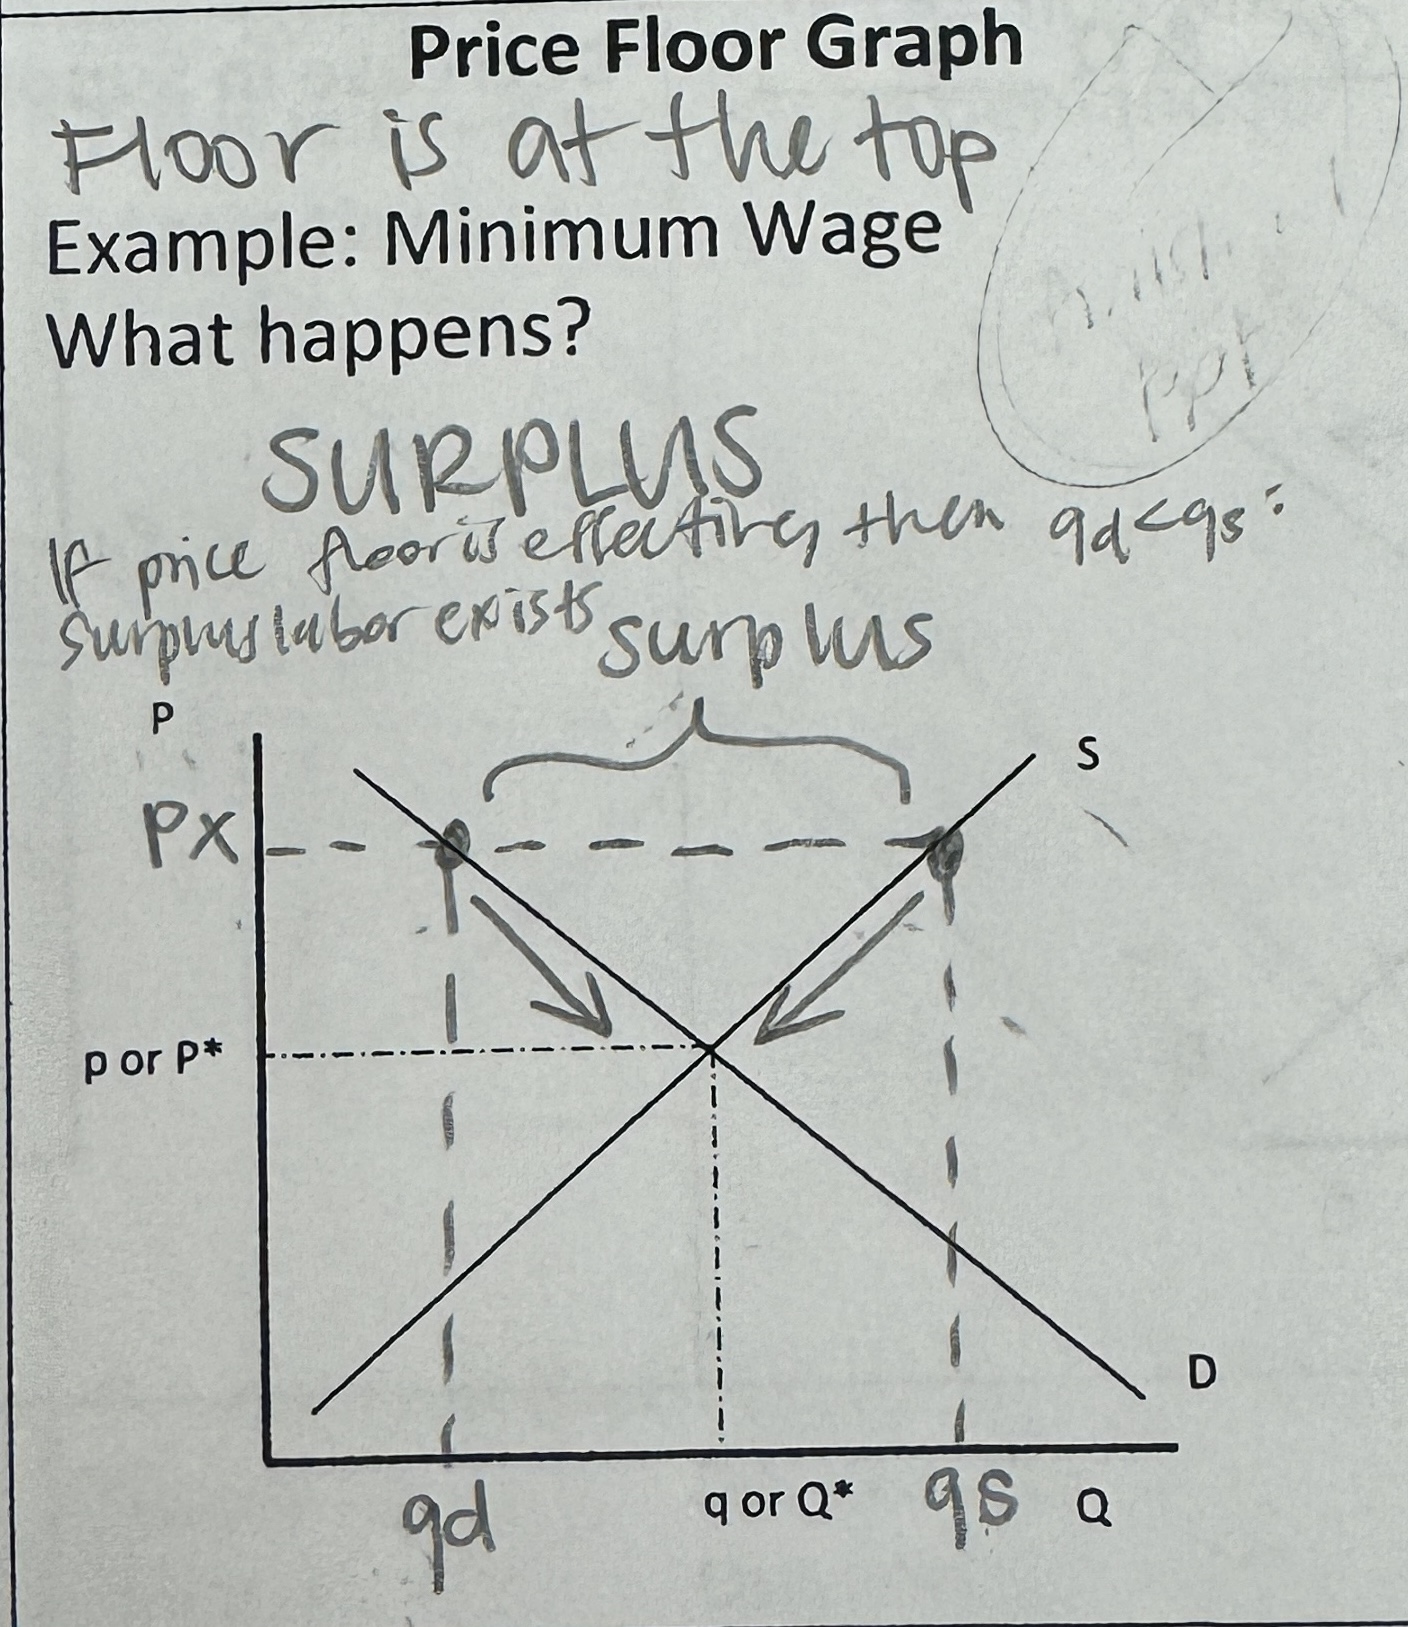
Price Floor
Minimum price for a good/service determined outside of the market (typically by govt.)
ex. minimum wage
raises the bar
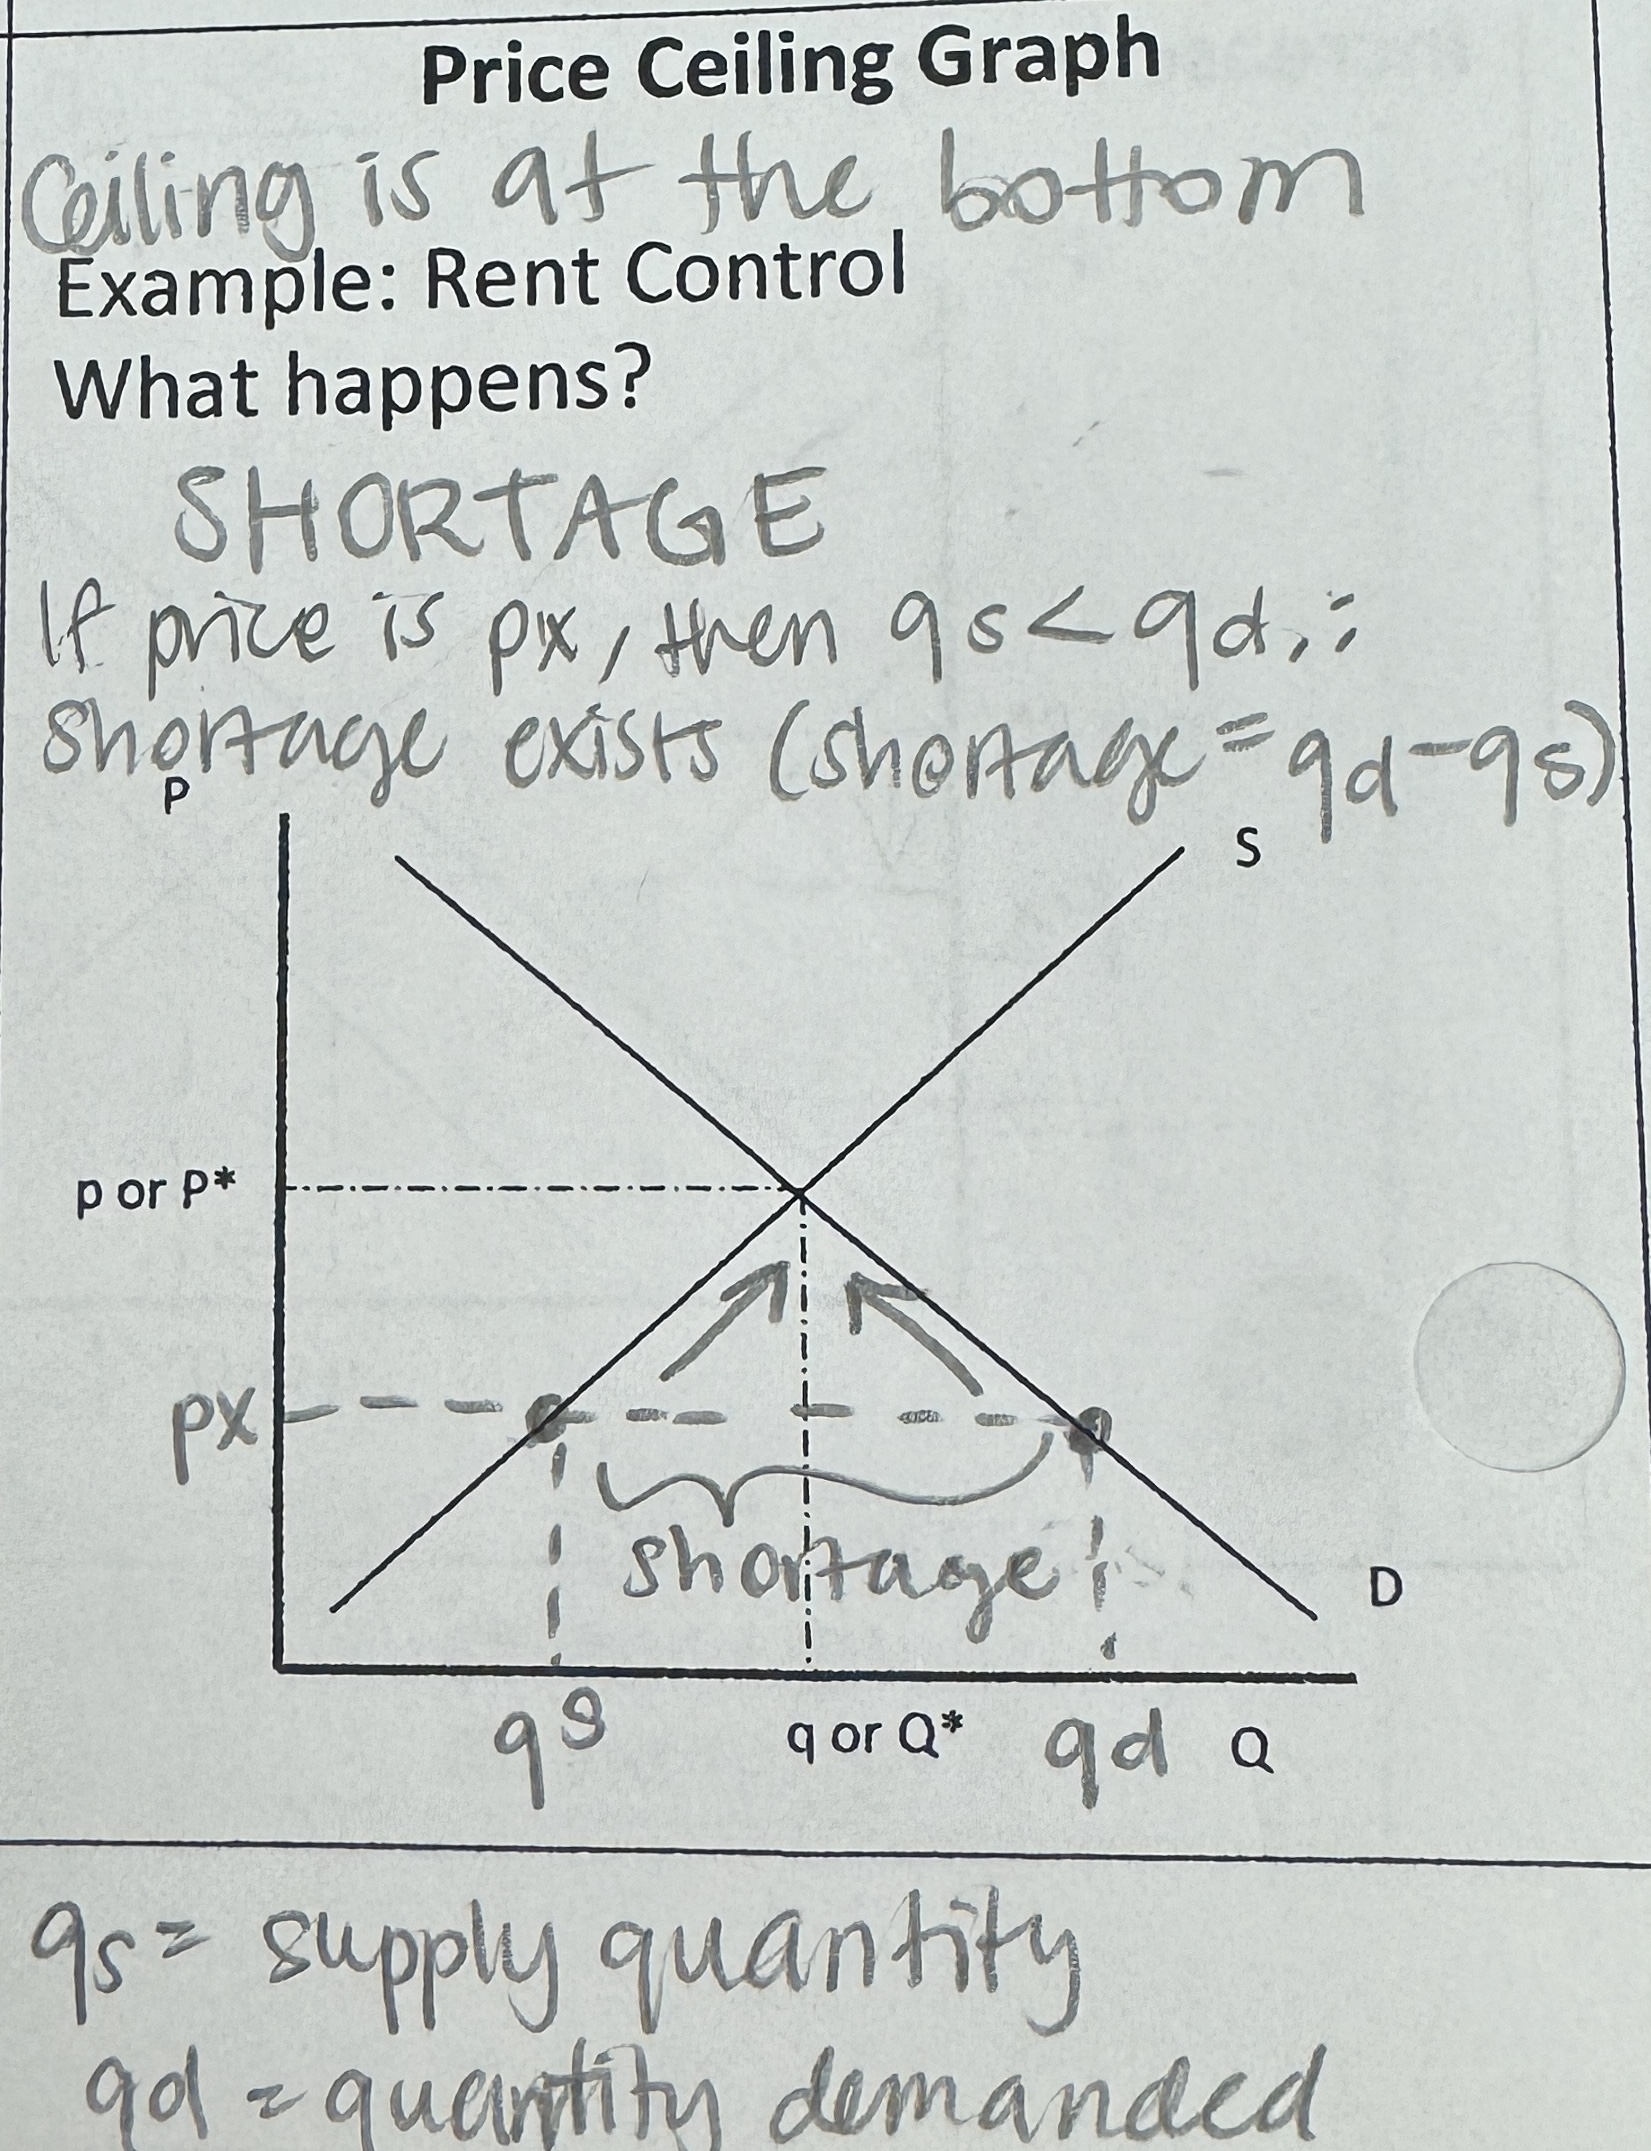
Price Ceiling
Maximum price for a good/service or resource determined outside of the market
like a lid
Price Floor Graph
=SURPLUS
(Price, px, below Equilibrium price, pe)
Floor is at the top
ex. Minimum Wage - meant to increase standard of living but creates a labor surplus because companies can’t have as many employees
if price floor is effective, then qd < qs : surplus labor exists
Price Ceiling Graph
= SHORTAGE
(Price, px, below Equilibrium price, pe)
Ceiling is at the bottom
Ex. Rent control
if price is px, then qs < qd : shortage exists (shortage = qd - qs)