Intro to AI: Machine Learning, Types of Learning, K Calculations
1/101
There's no tags or description
Looks like no tags are added yet.
Name | Mastery | Learn | Test | Matching | Spaced | Call with Kai |
|---|
No analytics yet
Send a link to your students to track their progress
102 Terms
Machine Learning
Subset of AI that deals with learning agents
Doesn’t require us to directly manipulate it
Based on past experiences or data to arrive at an output
Deep learning
Part of ML involving artificial neural networks
Deep because if more than 3 layers then deep learning
How can you say an agent is learning?
Is learning if it improved performance after making observations about the world
Machine Learning when an agent is a computer
Observes data
Build a model based data
Model: hypothesis about the world and software that can solve problems
Types of Learning
Supervised learning
Learn a function from labeled data
EX. There’s an answer key
Unsupervised Learning
Learn patterns from unlabeled data
Output is not labeled but you can still make sense of it
Reinforcement Learning
Learn best actions from experience of rewards and punishments
Learning by itself
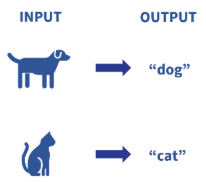
Supervised Learning
Labeled data
Input-output pairs where label is the output
Agent is taught by examples of labeled data
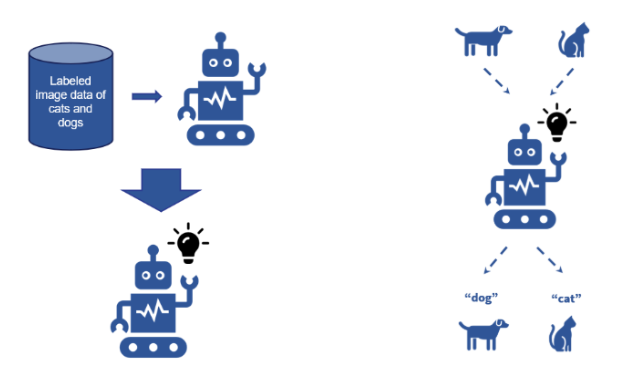
What does Supervised Learning do with labeled data?
Observes the labeled data and learns a function or builds a model based on that data
Uses the function or model to process input data and give an output
Types of Supervised Learning
Classification
Regression
Classification
Output:
Finite set of values called classes or labels
EX. true/false, sunny/rainy/cloudy
Agent learns from observed values to determine what label new observations belong
Regression
Output:
Number
EX. temperature, which can be an integer or a real number
Agent estimates and understands the relationship among variables
Useful for prediction and forecasting
Supervised Learning Algorithms
Nearest neighbors
Decision trees
Neural networks
Support vector machines
Linear regression
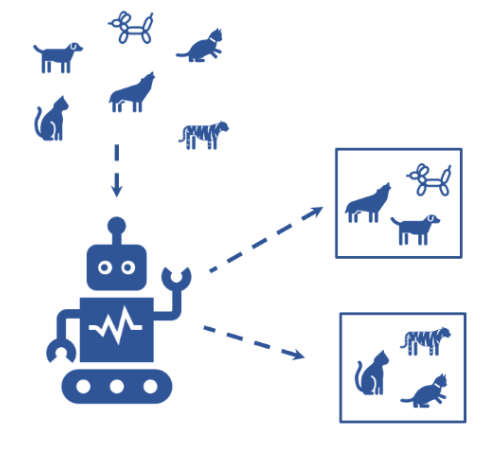
Unsupervised Learning
Agents learn patterns from input without feedback (unlabeled data)
Example:
Input: Images of animals
Output: Groups of similar images
Types of Unsupervised Learning
Clustering
Association Rule Mining
Clustering
Input
Unlabeled dataset
Output
Sets of similar data (based on defined criteria)
Useful for discovering segments in data and applying different business strategies for each segment
Association Rule Mining
Output
Correlations and associations
EX. Which items shoppers tend to purchase together (frequently bought together or market basket analysis)
Unsupervised Learning Algorithms
K Means Clustering
Hierarchical Clustering
Gaussian Mixture Models
Apriori Algorithm (Association rule mining)
Reinforcement Learning
Agent learns from rewards and punishments
Decides on actions towards more rewards
Agent needs to balance exploration and exploitation
Exploration VS Exploitation
Exploitation: stay with what has given most reward
Exploration: try other options to get additional information
EX:
Gambling agent that:
Chooses a slot machine that gave the most returns (reward)
Avoids slot machines that have not (punishment)
Reinforcement Learning Algorithms
Q-Learning
State-Action-Reward-State-Action (SARSA)
Deep Q Network
Input of Classification
Labeled Dataset
Instances with labels
Instances = examples
Classification: What would an instance need to have?
A set of features/attributes
A label
Instances = ______
Features = ______
Labels = ______
Rows, Columns, Last Column (usually)
What is the goal of Classification?
Derive a function (also called a model) based on a dataset
Predict the label of an instance with unknown label
Steps to Training and Testing a Machine Learning Model (Supervised Learning)
Model Training
Model Testing
Steps to Training and Testing a Machine Learning Model (Supervised Learning): Model Training
Start with labeled dataset
Features X is the input
Labels Y is the target used by the model to make predictions
Model learns from labeled data
Goal: learn the relationship between features and labels, so it can later make accurate predictions
Steps to Training and Testing a Machine Learning Model (Supervised Learning): Model Testing
Use test features (data that model never saw) to evaluate model
Model uses test features to make predicted labels (output classfications made by model)
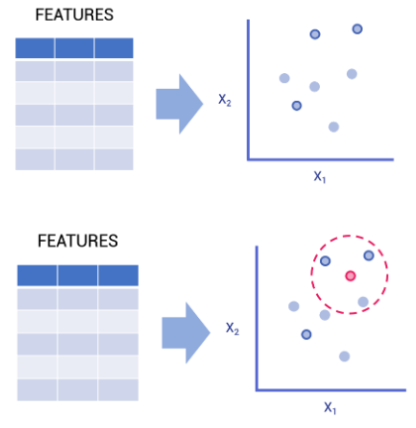
Classification Models: Nearest Neighbors or K Nearest Neighbors
Instances as labeled datapoints in a graph
Features = “coordinates”
For an unlabeled instance
Get the K nearest points
Get the label that represents most of these points
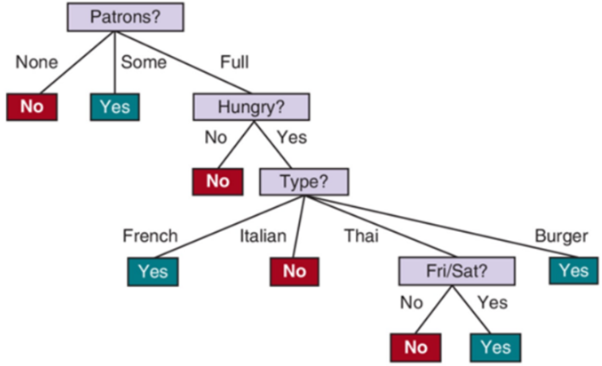
Classification Models: Decision Trees
A sequence of tests (decisions) induced from dataset
Each test is based on 1 feature
Eventually leads to a predicted label
Goal: A tree that consistently leads to the correct labels
Use first the feature that can best distinguish examples by their labels
What’s the problem with a decision tree?
Overfitting
Fits well with training dataset, but does not do well with new instances
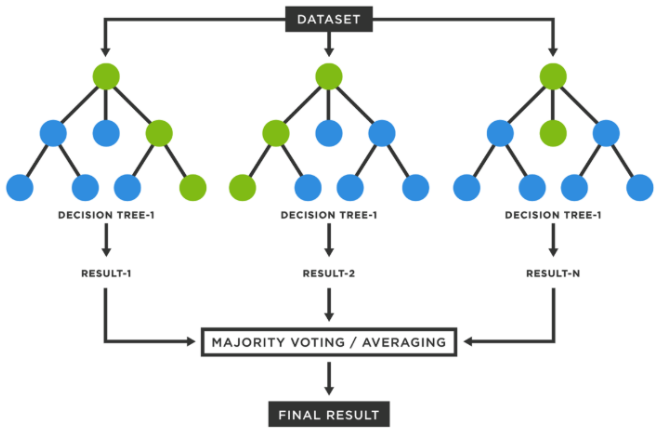
Solution: Random Forest
Classification Models: Random Forest
Predict labels based on multiple decision trees
Each decision tree is from a random sample of the main dataset
“ensemble method”
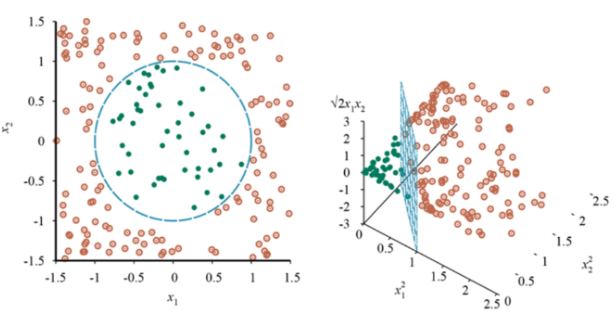
Classification Models: Support Vector Machines (SVM)
Instances as datapoints, and features as dimensions in a hyperplane
Goal: Linearly divide the labeled datapoints in the dataset
Make new dimensions if cannot separate
“Support Vectors”: points closest to boundary
Good in practice; popular in the early 2000s
Classification Models: Artificial Neural Networks (ANN)
ANN: layers of neurons connected to each other
Input layer: takes in input signals (like features)
Output layer: provides the output (like labels)
Hidden layers to facilitate computations
Each layer influence the neuron activation of succeeding layers
Most common method in the past few years!
Deep learning = multiple hidden layers
Uses back propagation to learn weights and thresholds
In an ANN, a “neuron” is activated based on what?
Input signals
Weights
Thresholds
Activation function
Among the classfication models, which one is the most recently popular?
Artificial Neural Networks (ANN)
Because of deep learning (multiple layers)
How do we evaluate a classification model
Split the dataset:
Training set: used to train the model
Test set: used to evaluate the model
Model Evaluation of a Classification Model: Computing for Accuracy
Accuracy = # of correct predictions / # of total predictions
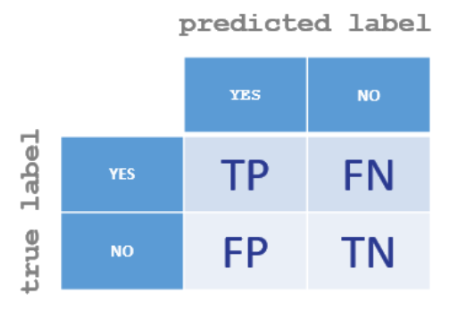
Model Evaluation of a Classification Model: Confusion Matrix
Show correct results against predicted results for each class (i.e. possible values of label)
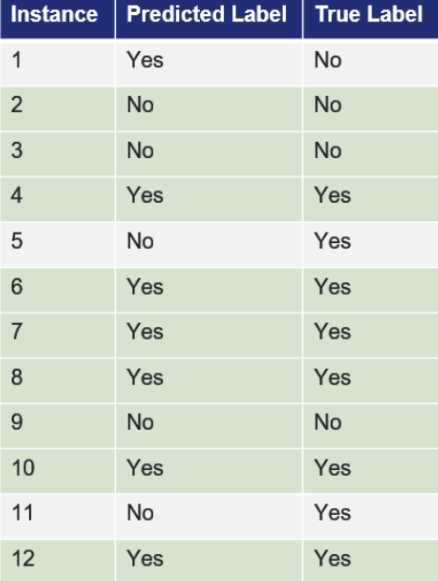
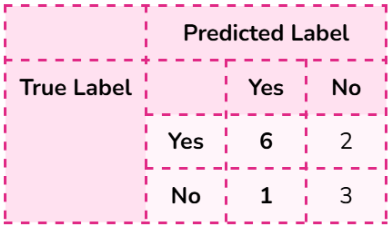
Do the Model Evaluation for this example
Accuracy:
Number of test instances: 12
Number of correct predictions: 9
9/12 = 0.75 or 75%
K Nearest Neighbors (KNN) Goal
Goal: Given a new unlabeled instance, predict its label based on nearest neighbors
KNN For an unlabeled instance
Get the k nearest points
What is the basis of what’s considered “nearest”?
What do we do with non-numeric values?
Get the label that represents most of these points
What do we do with ties?
Conclude that the instance belongs to the representative label
Distance Metrics to Choose from for KNN
Euclidean distance
Manhattan distance
Hamming Distance
For binary/categorical data
Data Transformation Options for KNN
Non-numeric values
Scale issues
Ways to Determine Majority Vote KNN
Dealing with Ties and Appropriate k
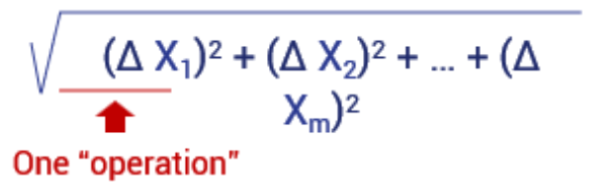
Euclidean Distance
Assumption: different dimensions are comparable
For 2D plane: √(x2-x1)2+(y2-y1)2 (where x and y are points)
For multiple features: √(△ x1)2+(△ x2)2 + … + (△ xm)2 (where x is a column)
Manhattan Distance
Best for datasets where additive differences of features are more appropriate
Add absolute values of column differences
Formula: | Δ x1 | + | Δ x2 | + … + | Δ xm |
Other Metrics for Distance
Minkowski Distance
Cosine Distance
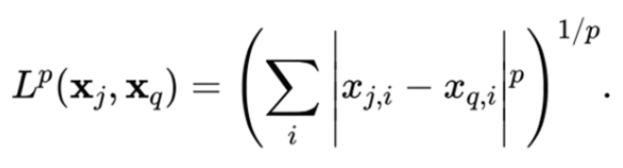
Minkowski Distance
Generalization based on value p
Includes Manhattan distance (p = 1) and Euclidean distance (p = 2)
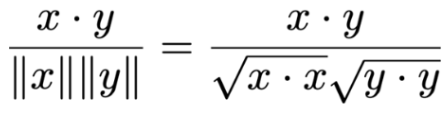
Cosine Distance
1 – cosine similarity
Inspects the angle between vectors
What’s the problem that can arise with these metrics?
Scaling
Categorical Features
Problem: Scaling
Some metrics work when values are of the same scale
Represent same info, but the scale of values are different
Features with much larger values tend to overshadow features with smaller values
Solution: normalize data
Problem: Categorical Features
Measuring distance between non-numerical features
Patrons: Some, None, Full
Type: French, Italian, Thai, Burger
Possible Solutions:
Convert to numbers
Count attribute matches
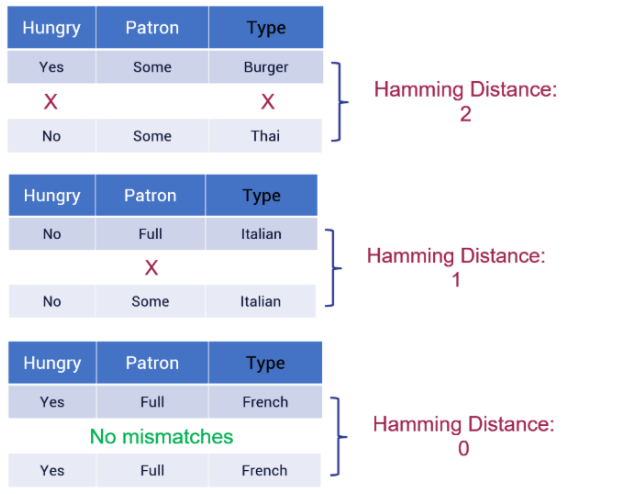
Hamming Distance
Used for categorical features
Counts number of mismatches among features
Closest point is when all features match
Works for KNN since you still get smallest values
How do we know which Distance metric to use?
Depends on dataset (usually default euclidean)
Important to consider scale and categorical data
Crucial to transform data before choosing and applying a metric
Try to reduce the variance
Why transform data?
“Format” of data incompatible with distance metric
Can’t apply same distance metric if inconsistent format among features
Inconsistent scaling can skew results to favor certain features
Data Transformation Types
Categorical to numerical
Numerical to categorical
Convert to levels
Bins
Consistent scaling: normalization
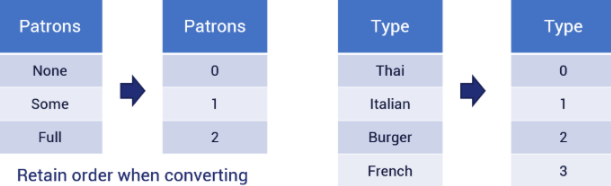
Data Transformation: Categorical to Numerical
Assign a number to each value type
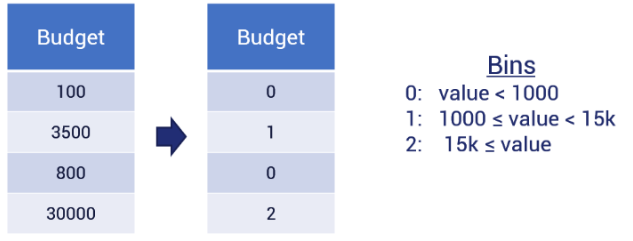
Data Transformation: Numerical to categorical
Usually do this if using Hamming distance
No need to convert numbers if there are only a few values
If there are many possible values (or even infinite), we can divide values and assign them to bins
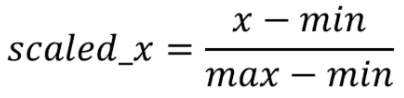
Data Transformation: Consistent scaling: normalization
Definition: scale down dataset so that all values fall between 0 and 1
Reduces bias on data
Standard preprocessing step in machine learning
Improves generalization, enabling better predictions on new data
Types of Scaling under Normalization
Min-Max Scaling
Standard Scaling
Min-Max Scaling Formula
x: value to be scaled
min: minimum value of the feature
max:maximum value of the feature
KNN: Majority Vote
After getting nearest points, label of majority is predicted label of new instance
EX. 2 Blue, 1 Red
Majority Label: Blue
Why do we usually choose an odd value for k in KNN?
To reduce the chances of a tie when determining the majority vote among nearest neighbors
True or False: Ties still occur in KNN even if k is odd?
True — Ties can still happen if two or more points are equally distant from the new instance, increasing the number of nearest points considered.
Give an example of when a tie might still occur in KNN even with an odd k.
If k = 3 and two points share the same distance for the 3rd nearest neighbor (e.g., both 1.50 units away), you’d effectively have 4 nearest points — causing a tie.
What can we do if ties cannot be completely avoided in KNN?
Apply tie-breaking methods
Random label choice
Consulting a domain expert
Comparing the next nearest instance
Weighting closer instances more heavily
How do we know which k to use?
Train multiple kNN models with different values of k
Apply evaluation methods (e.g. accuracy) on each model and pick the one that performs best
What factors affect how long KNN takes to predict a label for one instance?
Each prediction requires multiple distance computations
The number of instances in the training set
Each distance computation requires multiple operations
Proportional to the number of features
In KNN, what do the “operations” in distance computation depend on?
The number of features — each feature requires operations like squaring, adding, etc.
kNN’s time complexity for one new instance
O(mn)
m: number of features
n: number of instances (training set)
Questions to Ask/Answer when making a decision tree
How do we branch and determine terminal node?
How do we choose which features to use for branching?
GINI Index: How do we choose which feature to use?
For each feature, compute Gini index for each of its categories
Compute for the weighted average of the feature’s Gini indices
Select the feature with smallest (weighted average) Gini index
GINI Index Steps
Identify target label (outcome you’re trying to predict)
List all features (attributes)
Compute GINI for each category of a feature
Compute Weighted Average GINI for the feature
Repeat for other features
Choose feature with lowest Weighted Gini
Repeat process for each branch
What to do with new groups?
Leaf (terminal node)
All instances in the group have the same label
E.g. all yes or all no
Branch
Instances have mixed labels
e.g. mix of yes and no
Considered as a new group to split
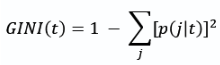
GINI Index Formula
GINI = 1- (j1 / total of t)2 - (j2 / total of t)2
t : node (e.g. the category like none/some/full for Patrons)
j : class (e.g. the label like Yes/No for Will Wait)
p ( j | t ) : relative frequency of the class in the group
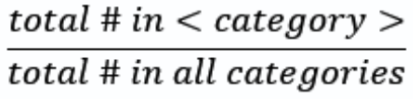
How do we compute for the weighted average of the feature’s Gini indices?
multiply GINI(category) by:
total # in category / total # in all categories
Then sum all values to get the weighted average
Aka GINI split
In a decision tree, number of branches equals to what?
number of categories
Clustering
Type of unsupervised learning (unlabeled data)
Learn patterns and derive groups (clusters) of similar instances
Each unlabeled instance is assigned to a cluster
Examples of clustering methods
K-Means clustering
Hierarchical clustering
Gaussian mixture models
Spectral clustering
How do we evaluate clustering results?
Inertia (elbow method)
Silhouette score
K-Means Clustering
Intuition: instances in the same cluster should be close to each other
Specify k: target number of clusters
Select k random instances as centroids of their clusters
Repeat
Assign each instance to the cluster of the closest centroid
For each cluster, get the mean for each feature and set the new centroid
Stop when cluster memberships stop changing
Hierarchical Clustering
Dendrogram
Instances = terminal nodes
Branches connect nodes/subgroups at different levels
Clusters can be derived from a dendrogram
Dendrogram
Tree diagram depicting closeness through its branches
Branches show which instances/groups are close to each other
Derive clusters from generating a dendrogram
2 ways to generate a dendrogram
Agglomerative clustering: bottom up
Start with treating each instance as one cluster
Repeatedly merge 2 closest clusters
Divisive clustering: top down
What can other Clustering Methods handle that K-Means cannot?
non-spherical boundaries
Other Clustering Methods
Gaussian Mixture Models
Spectral Clustering
Gaussian Mixture Models
Soft assignment since there’s a probability (?)
Learns a pattern from the dataset so it can make different gaussian models from the different probabilities
Covariance, not just means, determine the shape
Spectral Clustering
More based on whether it’s connected
Affinity (closest pair wise) and degree of connection to the next value
Graph-based machine learning technique that uses the eigenvectors of a graph's Laplacian matrix to find clusters within data, especially for non-convex shapes
Clustering Evaluation: How do we know if a clustering result is good?
Base it on
Homogeneity
Heterogeneity
Homogeneity
How similar the instances are within a cluster
More homogenous = more similar
Points in a cluster should ideally be similar to each other
Heterogeneity
How different the instances are across different clusters
More heterogeneous = more different
The further points are from one cluster to another, the better
How do we ensure best quality of clustering?
Try clustering methods with different k values and get the clustering with the best quality
Inertia
Measures homogeneity (within cluster sum of squares)
Elbow method to estimate best k
within-cluster sum of squares of distances
You want to keep inertia low
Silhouette score
Measures and weighs both homogeneity and heterogeneity
Compute a score for every instance, and then get the average
Homogeneity score
Heterogeneity score
Combining the homogeneity and heterogeneity scores
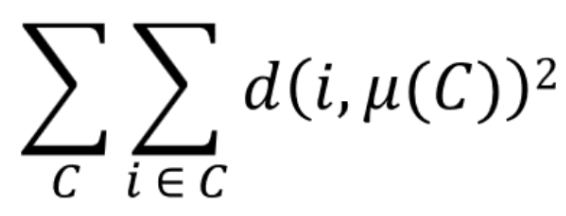
Steps to Compute Inertia
For each cluster, determine the cluster centroid
For each instance, square its distance from its cluster centroid
Sum all these squares
Inertia Formula
C: cluster
i: instance
d(i, μ(C)): distance between i and cluster C’s centroid
Inertia: Elbow Method
Used when picking between multiple k-means clusterings (different values of k)
Provides a balance between low k and low inertia
Process involves calculating a metric called inertia (AKA Within-Cluster Sum of Squares, or WCSS) and plotting it.
Inflection point
Tangent line forms an angle closest to 45 degrees
Determines the best k
In practice, we often just estimate from the shape of the graph
Inertia: Elbow Method Steps
Perform K-Means with different k values
Get the inertia score for each final clustering
Plot the k values and inertias
x-axis: k values
y-axis: inertia
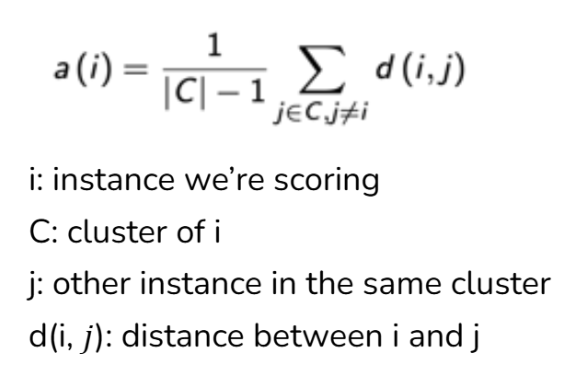
Silhouette Score: a(i): homogeneity score
Get the average distance between the instance and other instances within the same cluster
The smaller, the better
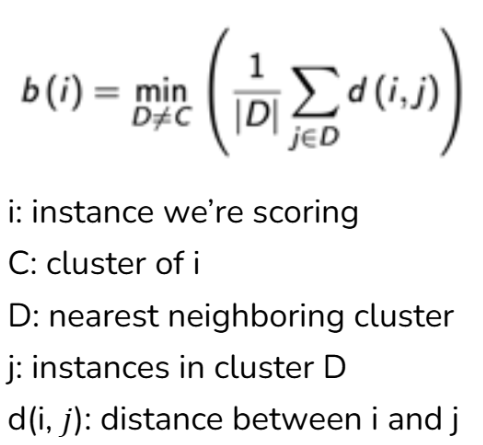
Silhouette Score: b(i) heterogeneity score
Get the average distance between an instance and instances from its nearest neighboring cluster
The larger, the better