Bio IAL- Prelabs and Quiz
1/45
There's no tags or description
Looks like no tags are added yet.
Name | Mastery | Learn | Test | Matching | Spaced | Call with Kai |
|---|
No analytics yet
Send a link to your students to track their progress
46 Terms
you will set up a chemical reaction and measure the amount of product produced in 30 second time intervals. You want to create a scatter plot of your data. Which variable should be on the y-axis? In other words, which is the dependent variable?
Amount of product
1 multiple choice option
Standard deviation
calculates the amount of variability in the data
3 multiple choice options
Chai Squared test
a statistical test to determine if two variables are associated or independent of each other
Standard Error of the mean
estimates how different the population mean is likely to be from a sample mean
1 multiple choice option
T test
a type of inferential statistical test used to determine if there is a significant difference between the means of two data sets.
Several sets of cells had parameter X measured pre- and post-treatment (on the same cells). You want to determine if the treatment significantly resulted in lowering parameter X. Which type of a t-test should be used?
paired (correlated) one tailed
3 multiple choice options
A statistical test has been performed to see if the means of two samples are considered to be statistically different from each other. A p-value of 0.03 was calculated.What is the chance the two means differ randomly and do you reject or accept the null hypothesis?
The chance that the two means differ randomly is 3% and you reject the null hypothesis.
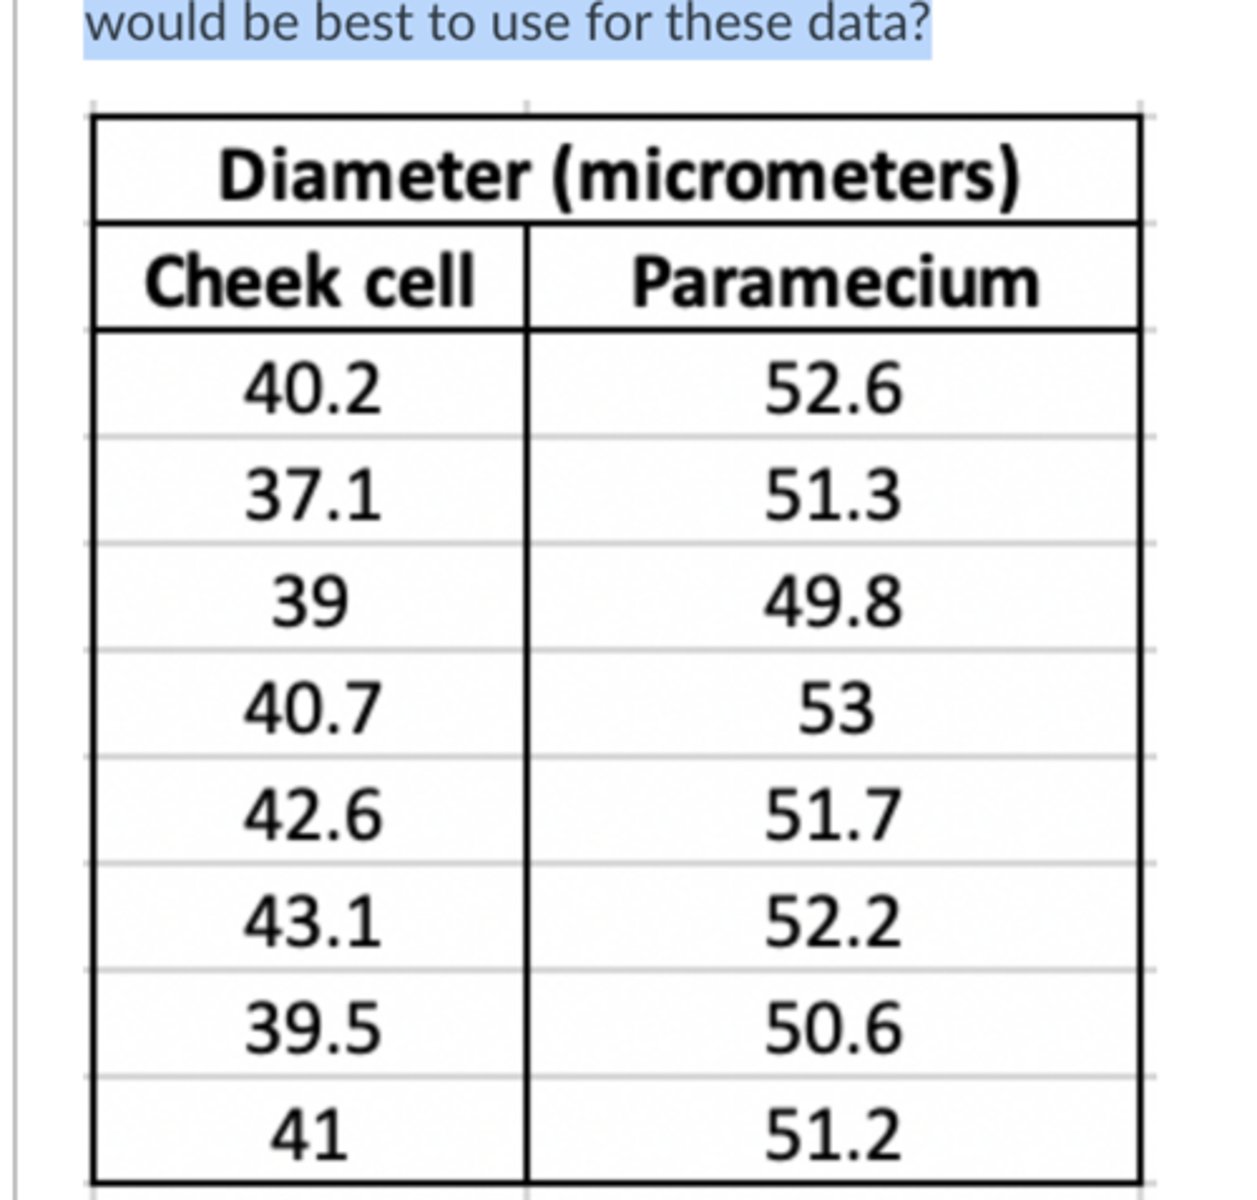
You measure the diameters of 8 human cheek cells and the diameters of 8 Paramecia (the short distance). The data are shown in the table below. You want to graph the data, so you can easily visualize and compare the average diameter between the two groups of data. What kind of graph would be best to use for these data?
line graph
2 multiple choice options
A student was interested in scoring the phenotype of the F1 generation by counting the number of mutant flies. In the F1 cross, they counted 217 mutant flies and 541 wildtype flies. The number 217 and 541 are examples of what type of data
discrete
3 multiple choice options
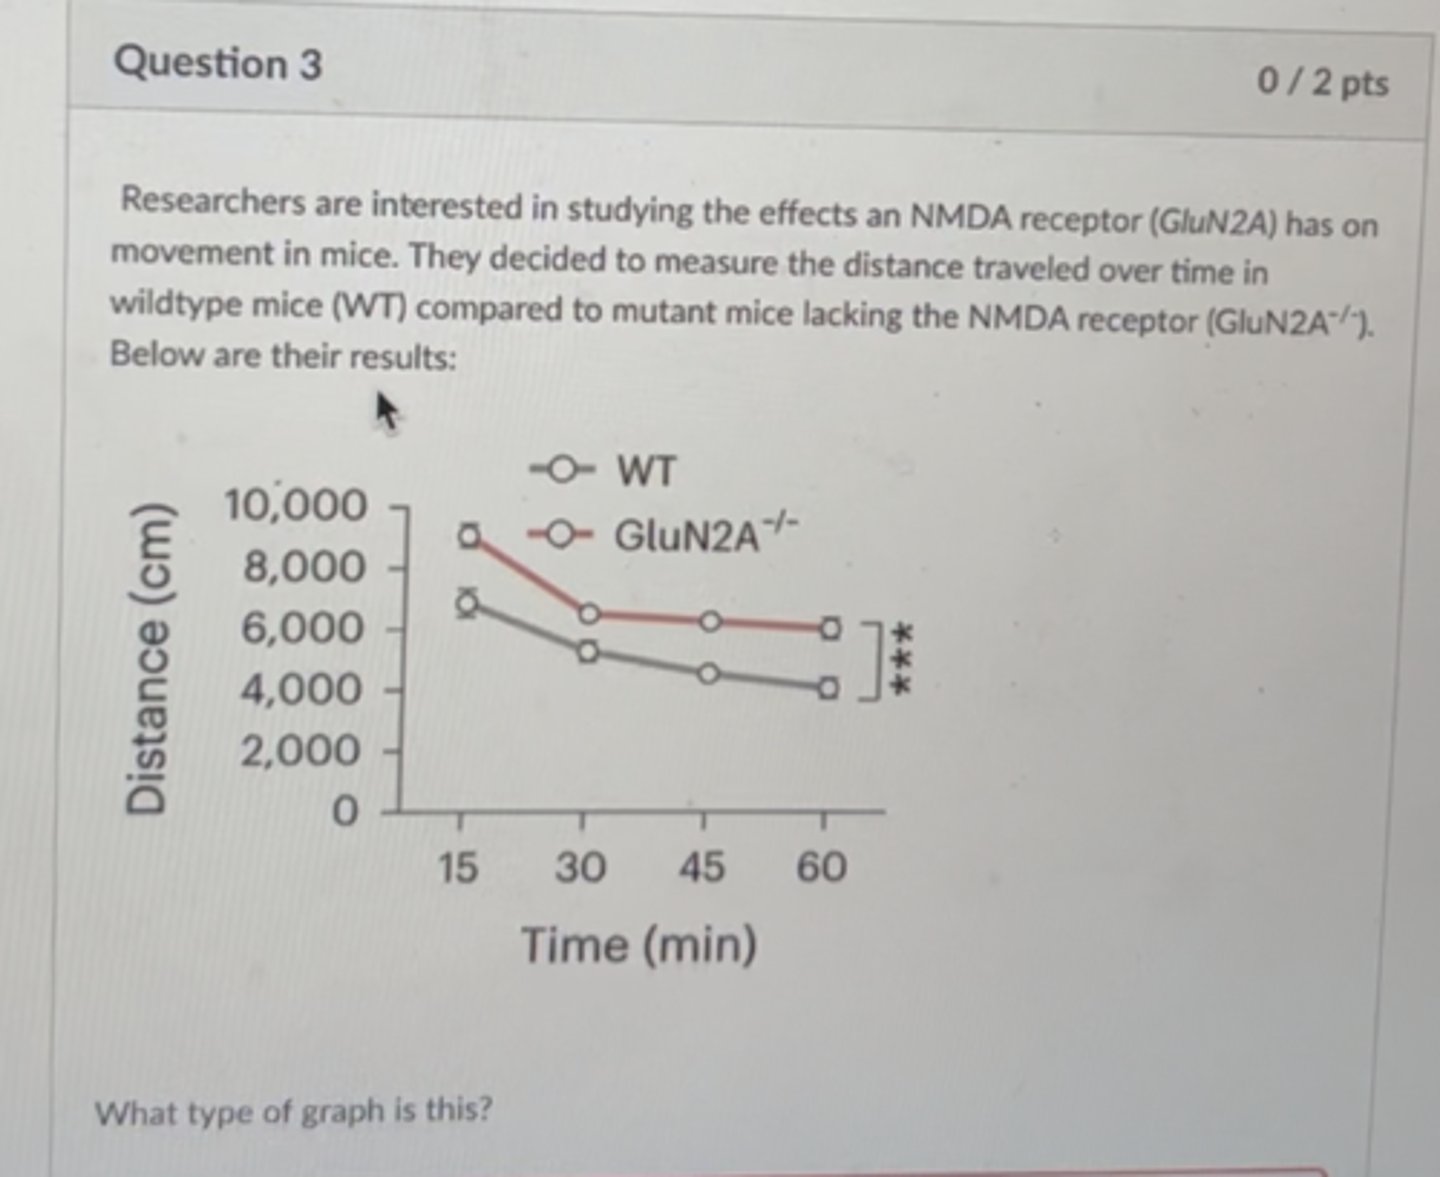
Researchers are interested in studying the effects an NMDA receptor has on movement in mice. They decide to measure distance traveled over time in WT mice comprared to mice lacking the NMDA receptor. What type of graph would have distance on Y axis, time on x axis and points connected by a line.
line graph
3 multiple choice options
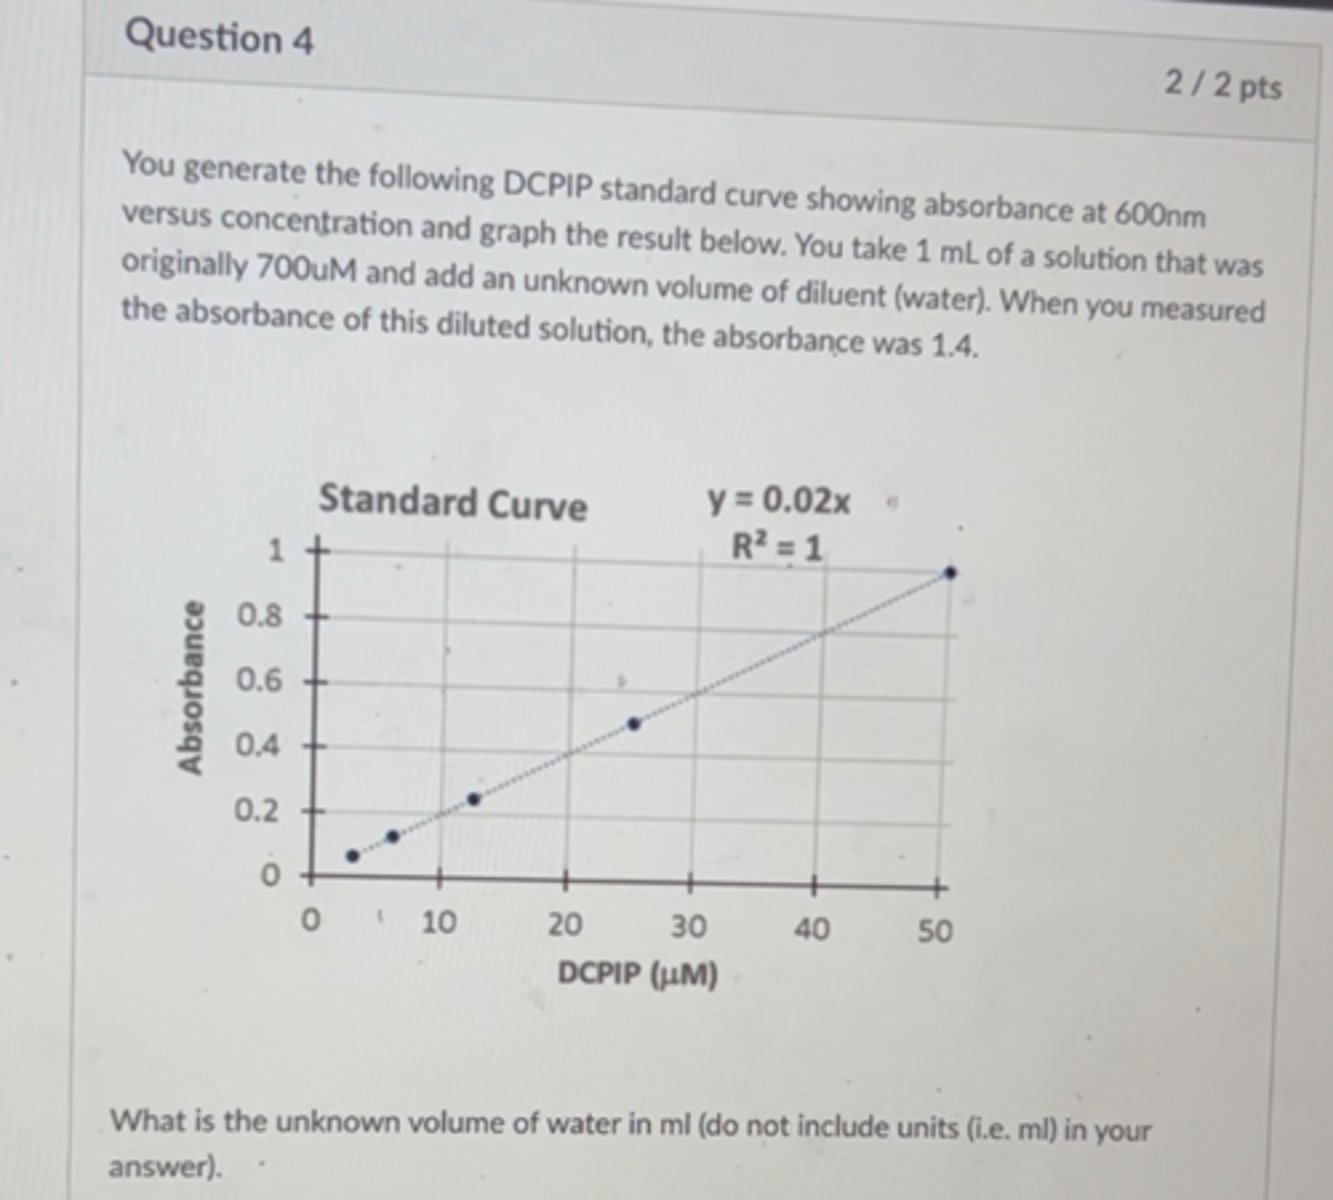
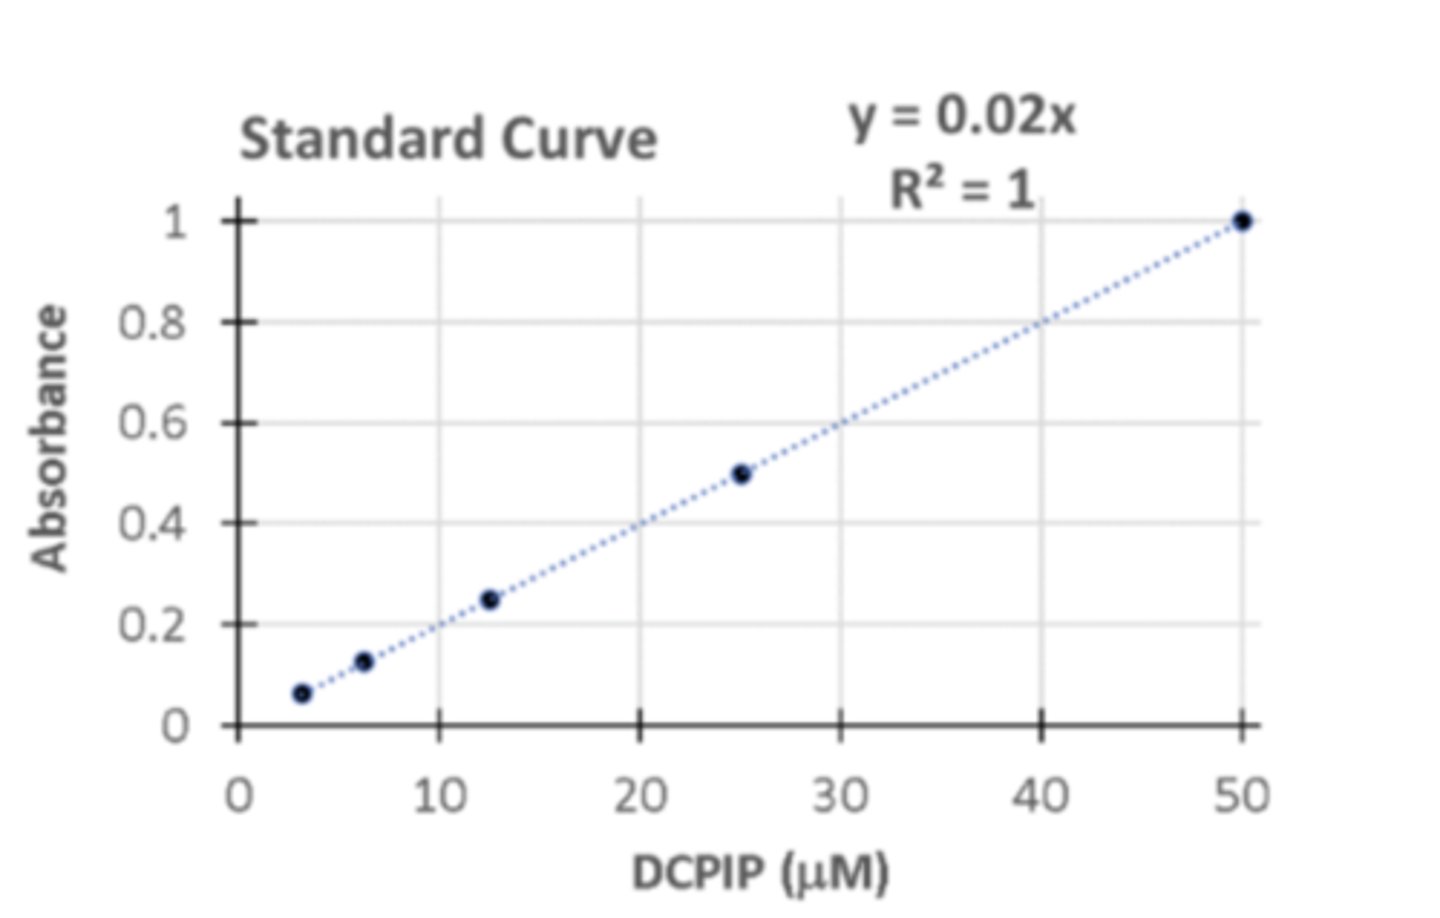
You generate the following DCPIP standard curve showing absorbance at 600nm versus concentration and graph the results below. You take 1mL of a solution that was originally 700 uM and add an unknown volume of diluent (water). When you measure the absorbance of this diluent solution, the absorbance was 1.4 what is the unknown volume of water in ml.
9
Researchers identify a new tumor suppressor gene that regulates cell division. they do a screen to identify chemicals that increase the rate of transcription of this TS gene. They compare the mean rates of cell division in wildtype cells (WT) and cells treated with chemical X. They are instersted in determining whether there is a decrease in mean cell growth in TS cells compared to WT cells. What type of statistical test should they conduct.
1 tailed independent t-test
3 multiple choice options
You are given a 2M stock solution of NaCL and diluent water and asked to make 100 mL of 100mM working solution. How many mL of diluent do you need to add? Provide answer in mL.
95
Labs routinely make concentrated solutions of stock reagents that they use repeatedly for various experiments. Calculate how many times more Buffer Q must be if it represents 10 microliters out of a final volume of 100 microliters (the other 90 microliters are due to the other reagents needed for the experiment).
10
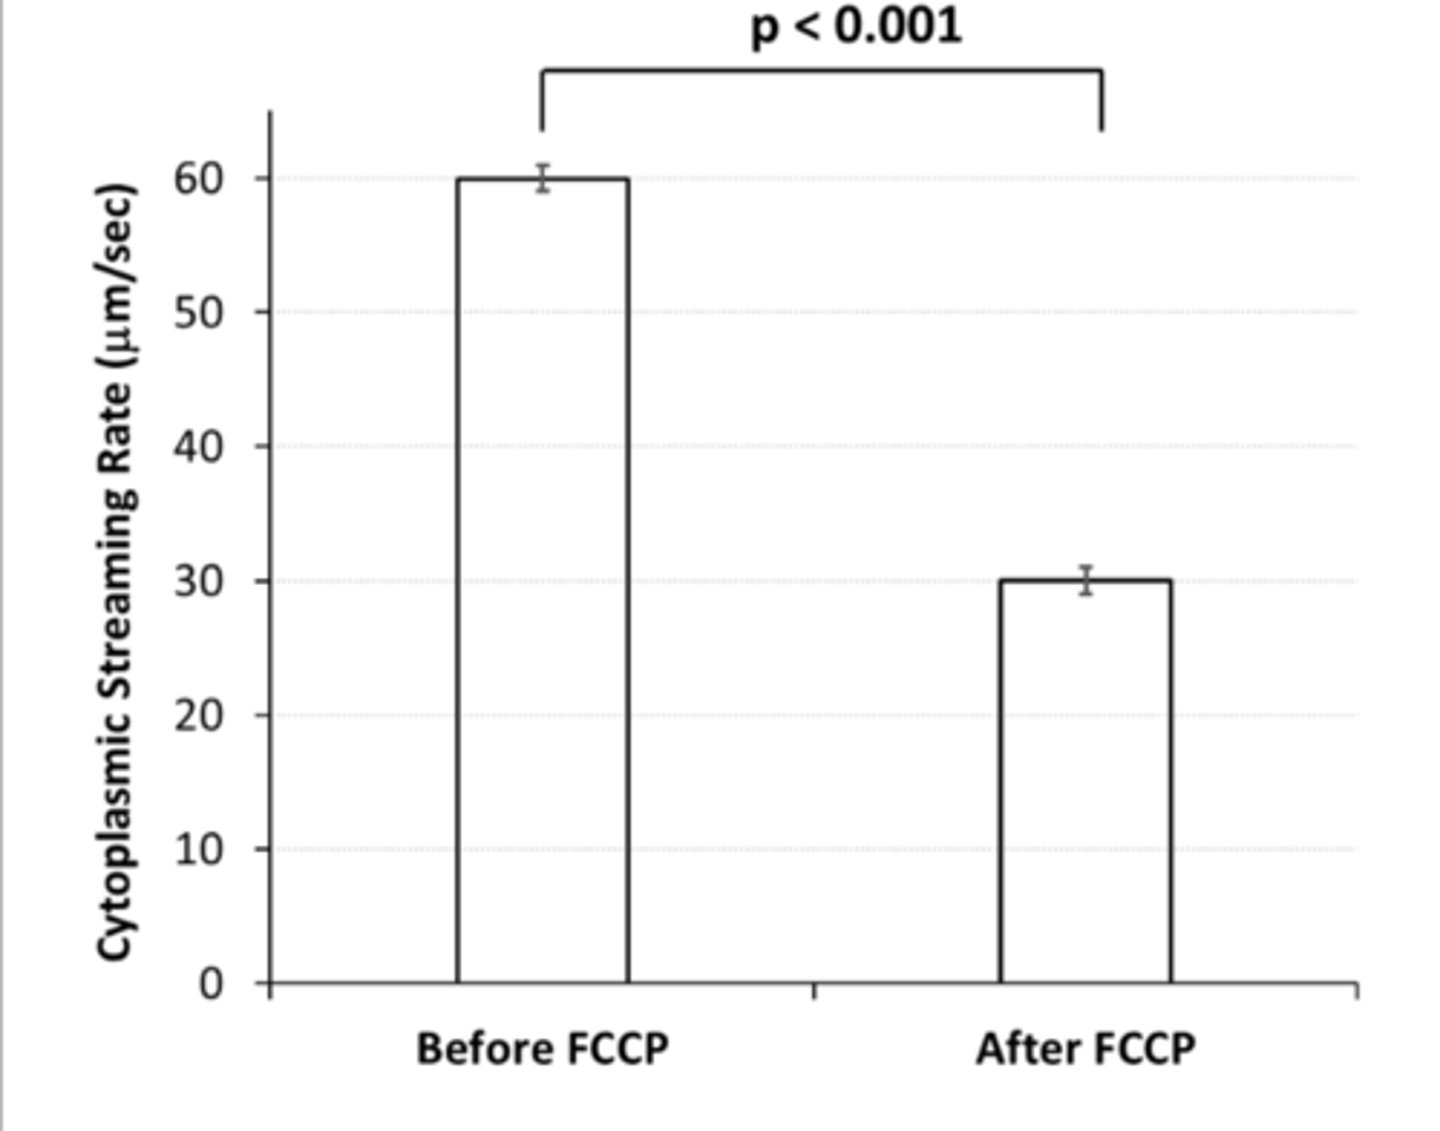
A Bio1AL lab section measured the movement of vesicles in Nitella before and after addition of FCCP. The results are summarized in the graph together with a T-test-based p value. Regarding the inhibitory role of FCCP on the streaming rates, data suggest to {reject/accept} the null hypothesis and the percent change that is based on the addition of the drug is approximately x?
reject null hypothesis
addition of the drug is approx -50%
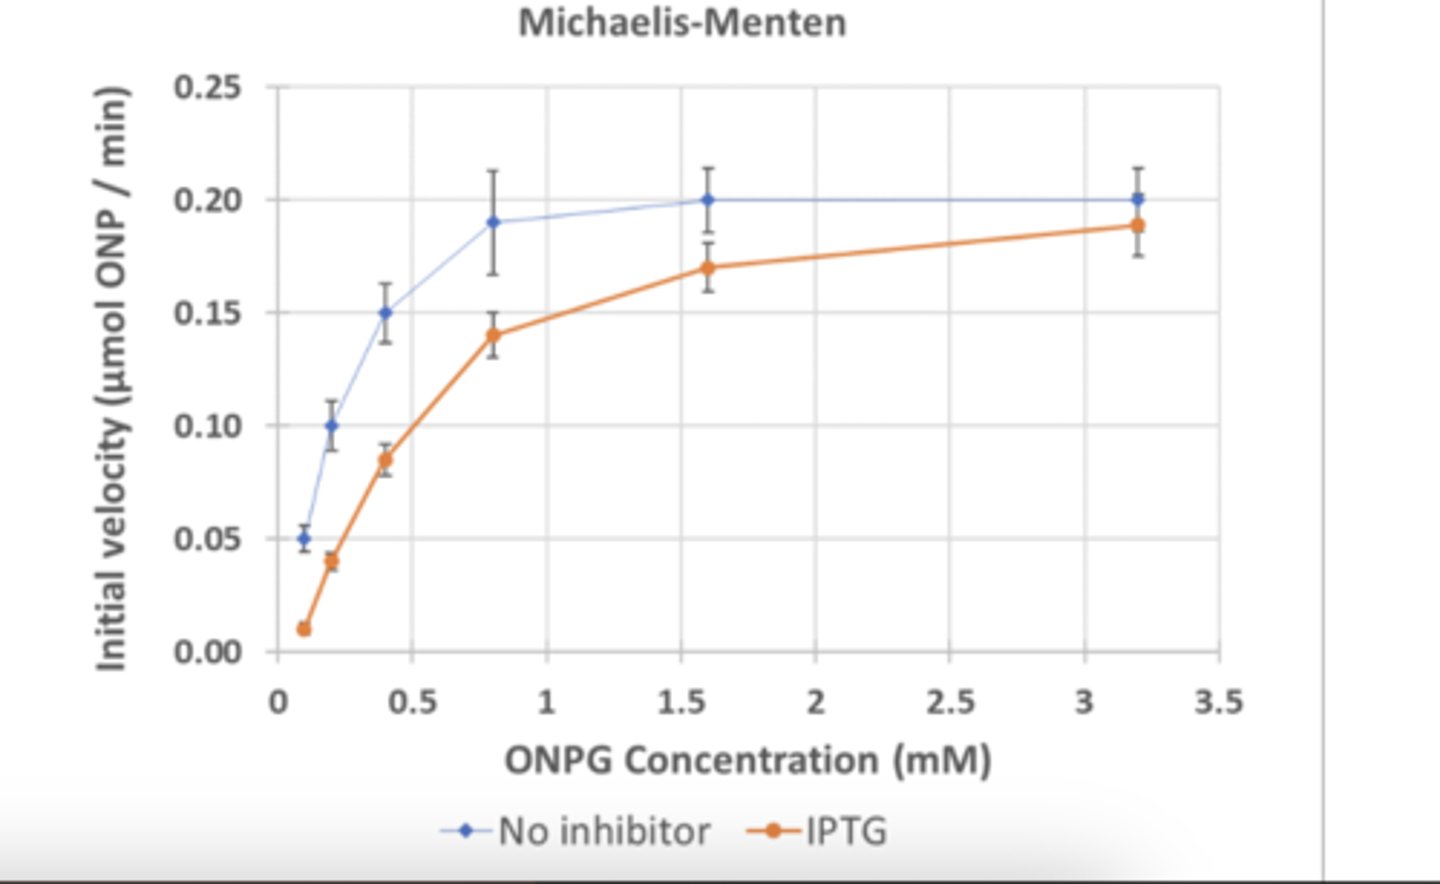
The following graph was generated during the enzyme lab. Based on the data, IPTG [ Select ] ["decreases", "increases"] the Km of beta galactosidase with ONPG. The Km for the enzyme (no inhibitor present) is approximately [ Select ] ["0.5mM ONPG", "0.2umol ONP/min", "0.1 umol ONP/min", "3.2 mM ONPG", "0.2mM ONPG"]
increases, 0.2mM ONPG
The affinity of an enzyme to its substrate is affected by:
a competitive inhibitor
3 multiple choice options
The SWC medium used to isolate Aliivibro can best be described as selective/unselective, defined/undefined
selective, undefined
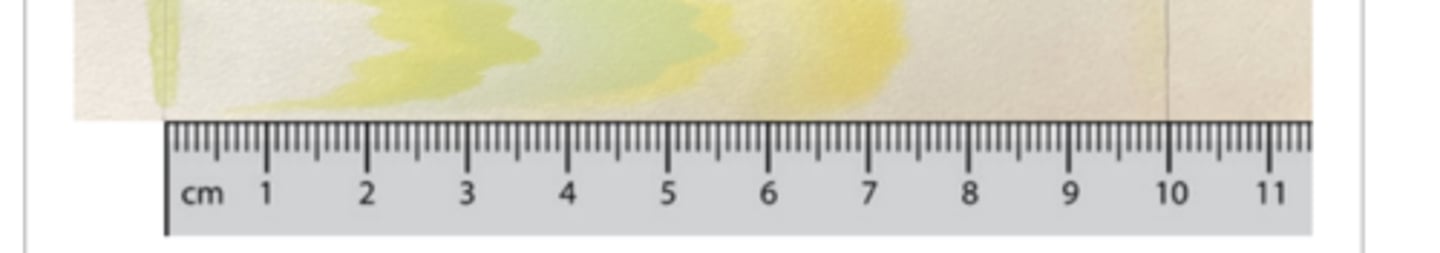
Based on the following chromatography results obtained during the photosynthesis lab, what is the approximate Rf value for chlorophyll b?
0.36
You study the reduction of DCPIP as outlined in lab 5 but isolate chloroplasts from broccoli (not from spinach). You obtain the following results with chloroplasts that were incubated in the dark (no light at all!) or with light exposure. The experiment with light is represented by the solid black curve, the dark control is represented by the dashed grey line. What is the light-dependent rate of DCPIP reduction for broccoli chloroplasts?
0.35
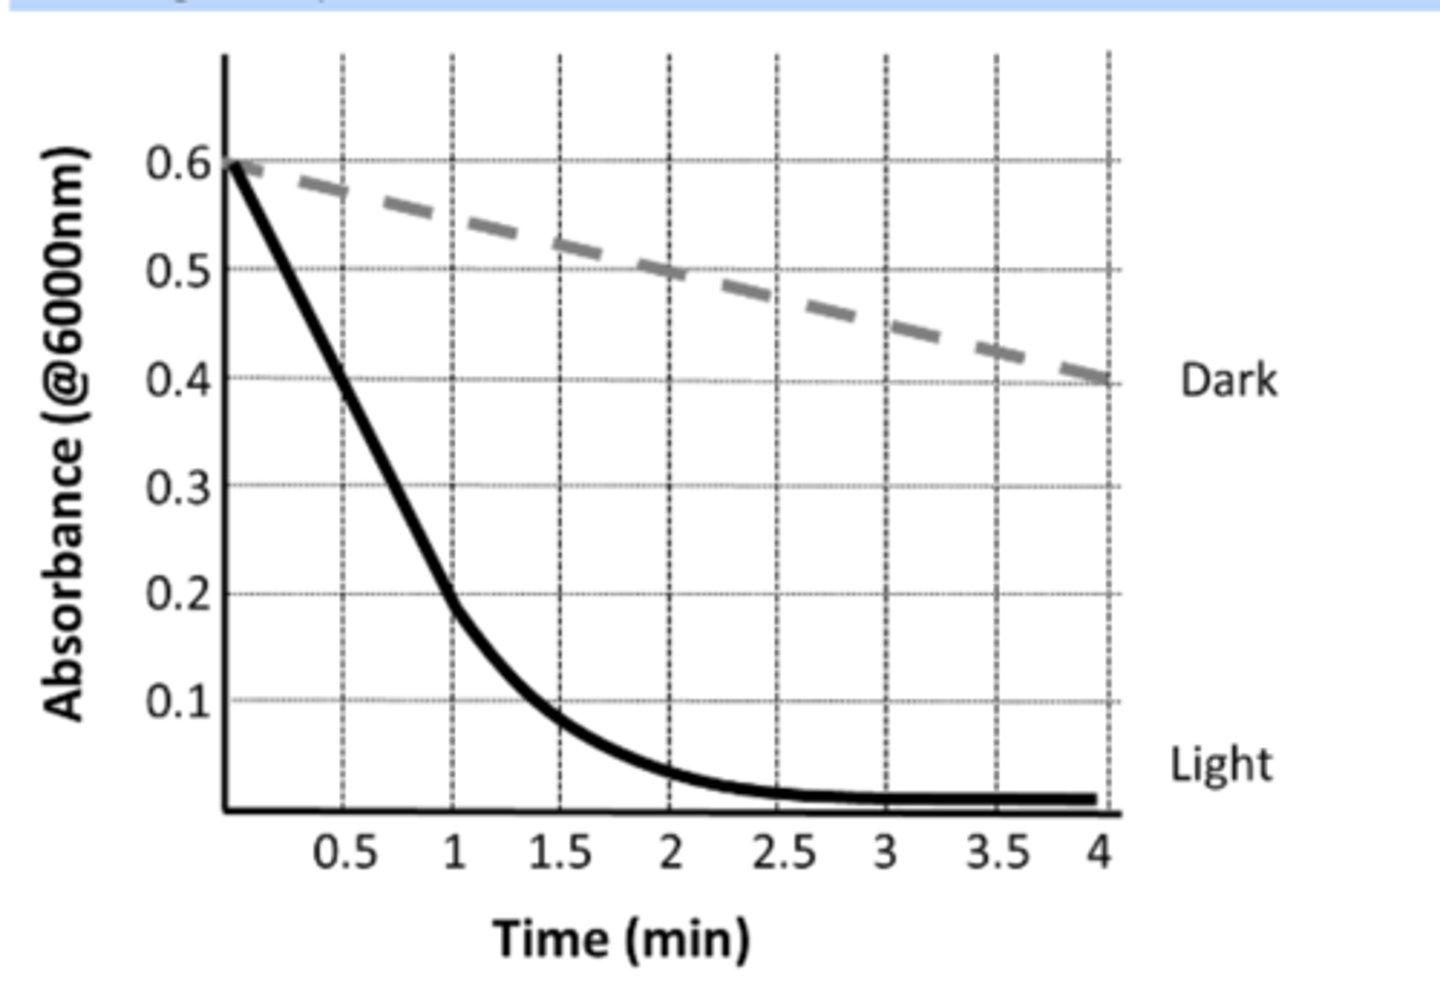
A student group measured the rate of DCPIP reduction by isolated spinach chloroplasts. The experimental parameters were identical to the ones outlined in the photosynthesis lab but the group tested the drug FCCP. You examined the effects of FCCP on cytoplasmic streaming. Assuming that FCCP has similar effects on chloroplasts and mitochondria, how would the rate of DCPIP reduction obtained with light exposure in the presence of FCCP differ from just light exposure (no FCCP)?
The rate of DCPIP reduction would be faster in the presence of FCCP
3 multiple choice options
Which of the following oligonucleotide sequences shown below will bind best to the ssDNA:
5' -AGTCAAGGTTCCAAAGGGTTTCCC -3'
5'-GGGAAACCCTTT-3'
3 multiple choice options
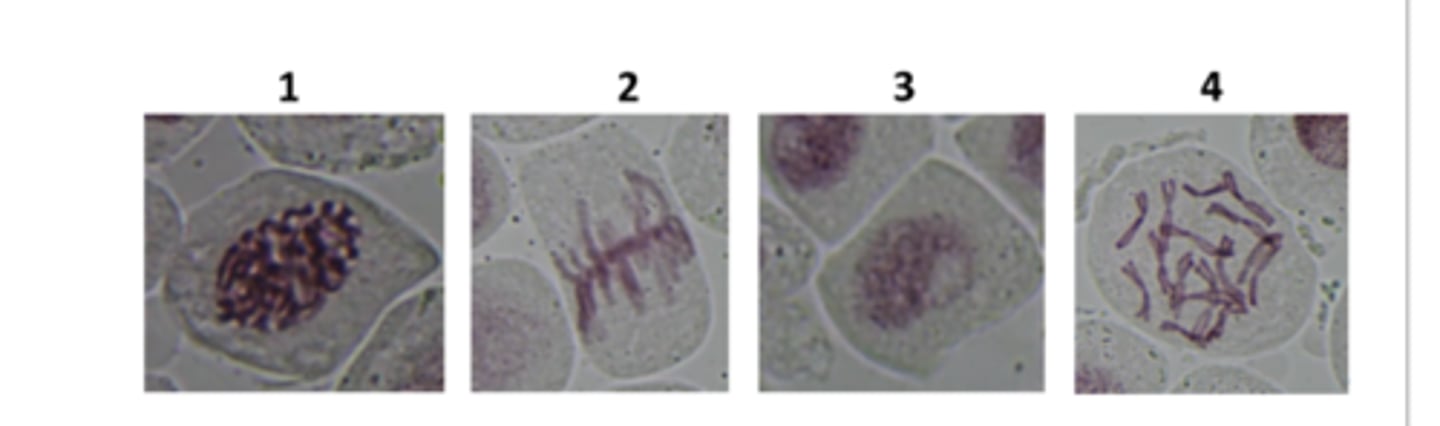
The following four images are from onion root tip cells stained following the same procedure used in Bio 1AL. Sort the following stages from early to late. Note that start with stage 3.
3 -> 1-> 4 -> 2
2 multiple choice options
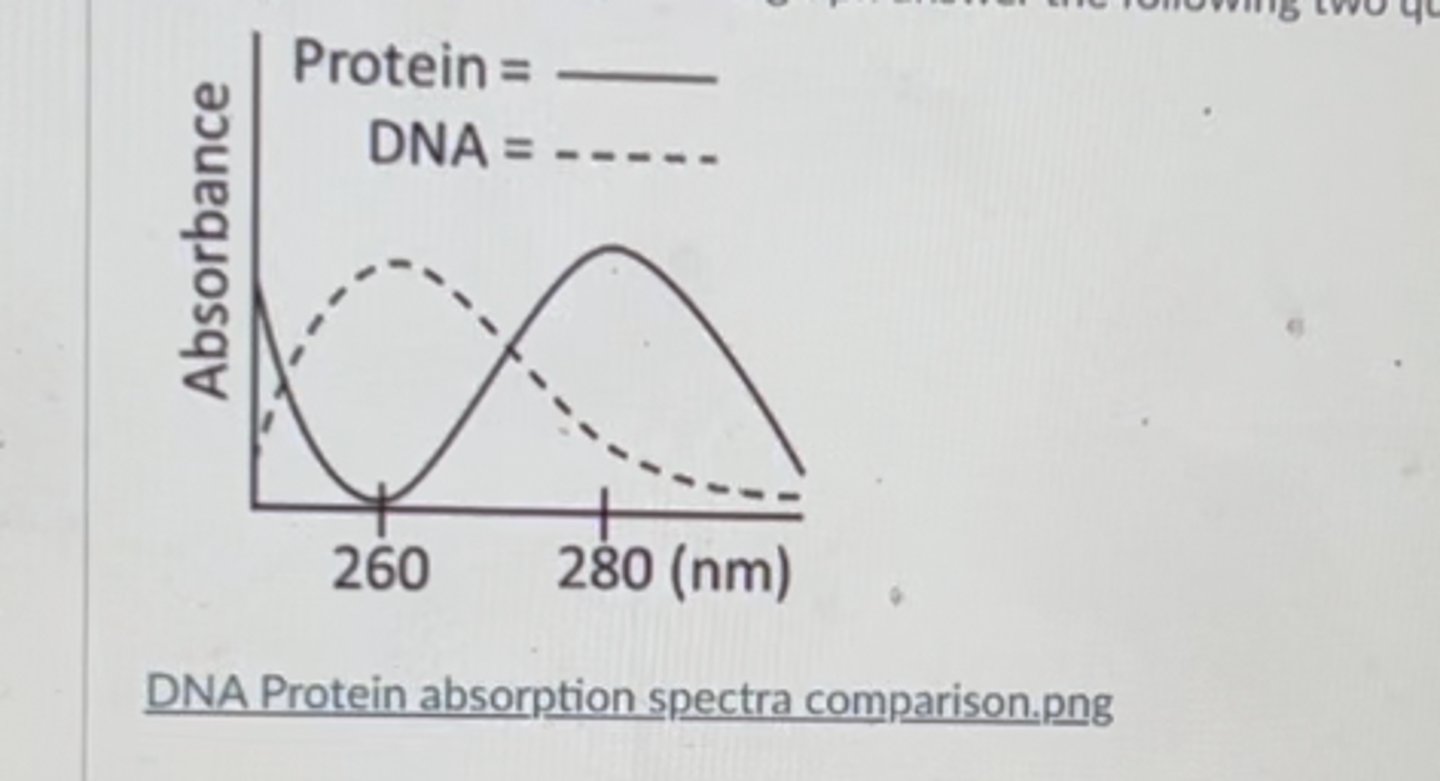
The following graph illustrates the absorption spectra of pure protein (solid lines) and DNA (dashed lines). A very nifty spectrophotometer has been designed to both quantify the concentration of nucleic acids and the contamination of the sample with protein. Based upon the graph answer the following questions. The ratio of 260/280 should be (high or low) for RNA samples with little protein concentration. What is the wavelength choosen to detrmine RNA concentration?
high, 260
In the cytoplasmic streaming lab one of the student groups this semester determined a baseline cytoplasmic streaming rate of 43.5 micrometers/sec and a cytoplasmic streaming rate of 20.8 micrometers/sec. These two data points are examples of what type of data?
continuous
3 multiple choice options
You generate the following DCPIP standard curve showing absorbance at 600nm versus concentration and graph the result below. You take 10 mL of a solution that was originally 800uM and add an unknown volume of diluent (water). When you measured the absorbance of this diluted solution, the absorbance was 0.4.
What is the unknown volume of water in ml (do not include units (i.e. ml) in your answer).
390
Researchers have identified control elements of a new tumor suppressor gene (TS) that regulates cell division. They do a screen to identify chemicals that increase the rate of transcription of this TS gene. They compare the mean rates of cell division in wildtype cells (WT) and cells treated with chemical X. They are interested in determining whether there is a decrease in mean cell growth in TS cells compared to WT cells. What types of statistical test should they conduct?
1-tailed, independent t-test
3 multiple choice options
You are given a 2M stock solution of NaCl and the diluent water and asked to make 100mL of a 100mM working solution. How many mL of diluent do you need to add? Provide you answer in mL.
95mL
LIII: Of the organisms we'll be looking at in Lab 3, which one is most closely related to animals?
Amoeba
3 multiple choice options
LIII: The fast and long-distance movement of mitochondria along the axon of animal nerve cells is thought to be facilitated mainly by the motor proteins dynein and kinesin. Which of the following drugs are expected to reduce movement of mitochondria between the cell body and the terminal branch of an axon in animal nerve cells?
FCCP (inhibits mitochondiral production of ATP) or Nocodazole (disrupts microtubles)
2 multiple choice options
LIII: The prepared slide of human cheek cells was prepared by adding methylene blue to the cells. Methylene blue binds to [ Select ] ["DNA", "sugar", "protein"] and it helps to increase the [ Select ] ["resolution", "contrast", "magnification"] .
DNA and contrast
LIII: The units you will use when determining the rate of cytoplasmic streaming in Nitella is micrometers/second. How will you determine the distance traveled in a given amount of time?
You will calibrate a known distance of 200 micrometers.
3 multiple choice options
LIII: What two organelles/structures might FCCP affect the most (directly) in Nitella?
chloroplasts and the mitochondria
3 multiple choice options
LIII: In the Nitella cytoplasmic streaming experiment, you will work with a stock solution of 20 μM FCCP that was dissolved in 2% DMSO. What will be the approximate final concentration of FCCP when you add 100 μL of 20 μM FCCP to your Nitella sample? Assume the final volume was 200 μL. Hint: Take into account how much FCCP was added to the sample and how much liquid already surrounded the specimen.
Write your answer (in μM) as a number only (with no decimals) in the space below.
10
LIII: why is ONPG used as the substrate for β-galactosidase assay rather than lactose?
The product of the ONPG reaction has a yellow color which allows us to measure the product concentration with the spectrophotometer
3 multiple choice options
LIII: What is the purpose of graphing the reciprocal of reaction velocity and substrate concentration (i.e. the Lineweaver-Burk plot)?
Vmax can be calculated from the y-intercept
3 multiple choice options
This is a standard absorption curve for ONP. You conduct the enzyme assay described in Lab 4 to produce ONP, and you measure an absorbance of 0.625 at 420 nm. Given the equation of the regression line in the standard curve, calculate the amount (μmoles) of ONP product generated in the assay tube for this absorbance value (420 nm wavelength). Note that you are calculating μmoles of ONP produced in the 3 mL assay volume, not simply the μM concentration. Write the number in the space provided (as a number only). Your number should have three digits after the decimal.
0.781
hat is the purpose of adding DCPIP to the chloroplast extracts when setting up the Hill reactions?
DCPIP is reduced by the electron transport chain, resulting in loss of color which we can measure
3 multiple choice options
Q4. For treatment 5 of the Hill reactions you will test the effect of methylamine on the rate of electron transport. You will use a t-test to determine if methylamine altered the rate of electron transport . Which other treatment should you compare the methylamine results to in your t-test?
Treatment 4 - Light
3 multiple choice options
Q5. In the paper chromatography experiment in Part III of the lab, select the best statement regarding the expected migration of chlorophyll a compared to chlorophyll b.
Chlorophyll a is less polar than chlorophyll b and as such would migrate faster than chlorophyll b (larger Rf value for chlorophyll a).
3 multiple choice options
Q6. In a plant, when light excites a chlorophyll molecule in the light harvesting complex (antennae) of a photosystem in an intact chloroplast, that energy is released primarily by
resonance energy (excitation energy) transfer to another pigment molecule
3 multiple choice options
Q2. You are on Part IV and need to calculate the volume of the enriched chloroplast suspension (from Tube "E") that you need to add to 5 mL of cold sucrose buffer to get a standardized suspension of 0.1 mg chlorophyll/mL. You follow steps 1-8 in the procedures and measure an absorbance of 0.29 in Tube "L".
From the absorbance value, first calculate the concentration of chlorophyll in Tube "E" (Cx). Then use that value to calculate the volume of Tube "E" (Vx) you need to add to 5 mL of buffer to get the standardized 0.1 mg chlorophyll/mL.
Enter your answer for Vx (in mL) and include only two places after the decimal and no units (eg. 1.48).
1.1
You collect absorbance data for the β-galactosidase assay in Lab 4. You enter your data into the Enzyme Data Analysis Excel file and calculate the μmoles of ONP present at each time point for the reaction that started with 3.2 mM of ONPG. μmoles ONP data for time points 0.5 - 2 minutes is shown in the table below. You decide to use time points 0.5 min and 1.5 min to calculate the initial velocity. At 0.5mins μmoles ONP= 0.10 and at 1.5 mins μmoles ONP=0.28. What is the initial reaction velocity in μmoles of ONP/min? Write the numerical value in the space provided (include all the numbers after the decimal point).
(0.288-0.10)/1= 0.188
Initial Velocity=(Change in μmoles ONP)/(change in time)
5. For the following Michaelis-Menten graph, what is the Km (in mM)? Write your answer in the box below (as a number only). You only need to include one number after the decimal.
0.5
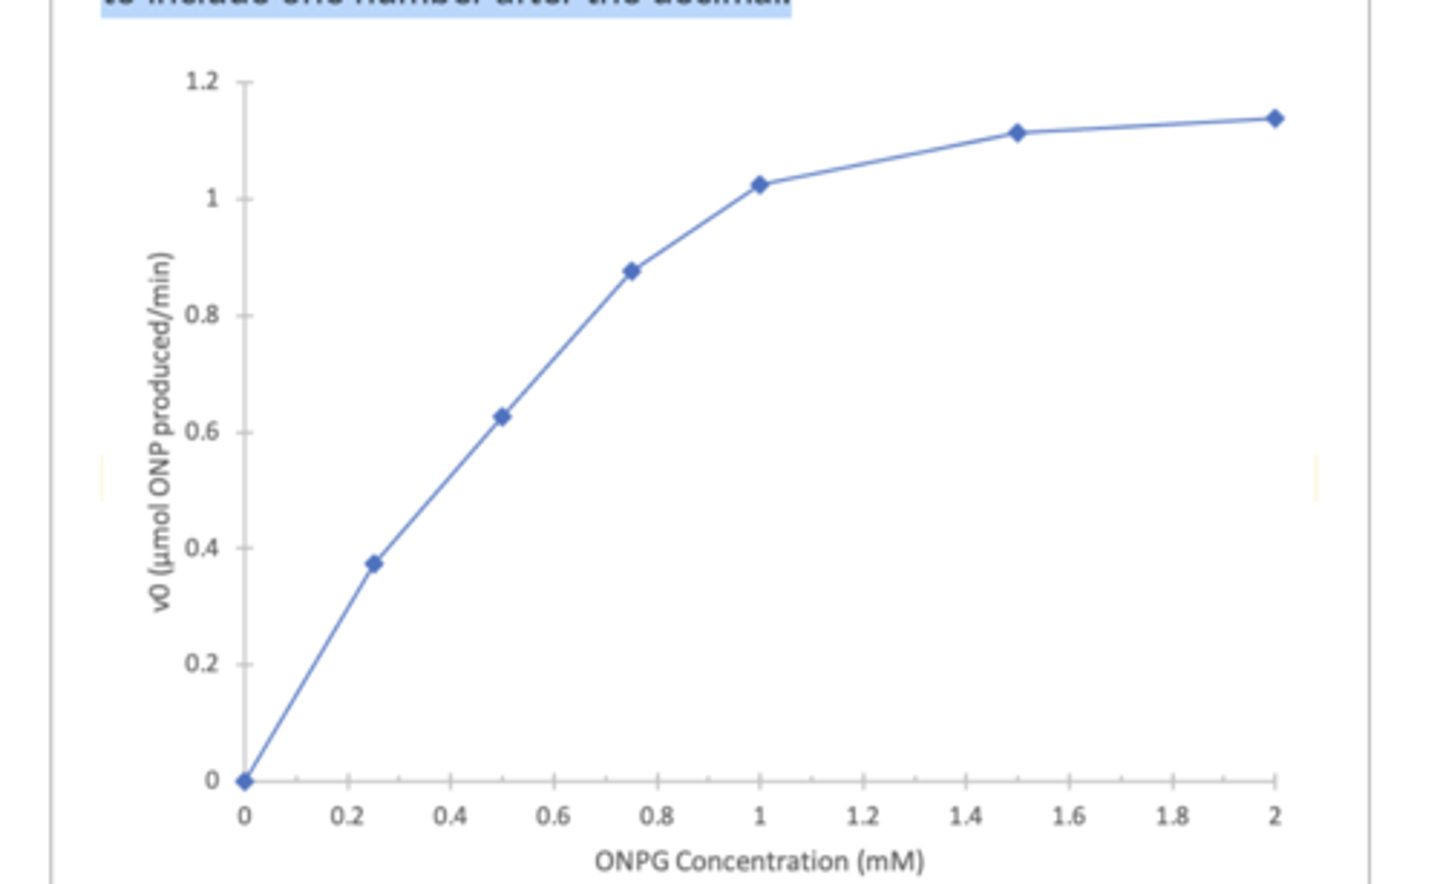
6. You repeat the same experiment as in the last question, but add an inhibitor. The inhibitor causes the Km to increase but the Vmax is unchanged. What type of inhibitor did you add?
competitive inhibitror
1 multiple choice option
What is the purpose of sucrose that is in the buffer that we prepare the chloroplasts in?
It helps maintain the osmotic pressure, so the chlooroplasts do not burst
3 multiple choice options