Mikroøkonomi - Uncertainty
1/28
There's no tags or description
Looks like no tags are added yet.
Name | Mastery | Learn | Test | Matching | Spaced | Call with Kai |
|---|
No analytics yet
Send a link to your students to track their progress
29 Terms
Why does uncertainty matter in economics?
Because outcomes of decisions (like jobs or investments) are often unknown at the time the choice is made.
What is Expected Value (EV)?
The average monetary outcome if a risky situation is repeated many times.
Formula:
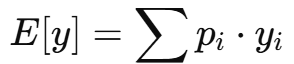
Expected Value – Example: Lottery:
50% chance of 4 million NOK
50% chance of 0 NOK
Calculate expected value
E[y]=0.5⋅4+0.5⋅0=2 million NOK. Meaning: the average outcome over time would be 2 million if you played this lottery many times
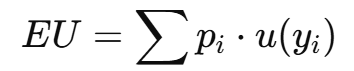
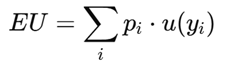
What is Expected Utility (EU)?
The average satisfaction (utility) from risky outcomes.
Formula:
Where u(y) is the utility function.
Difference between EU and EV
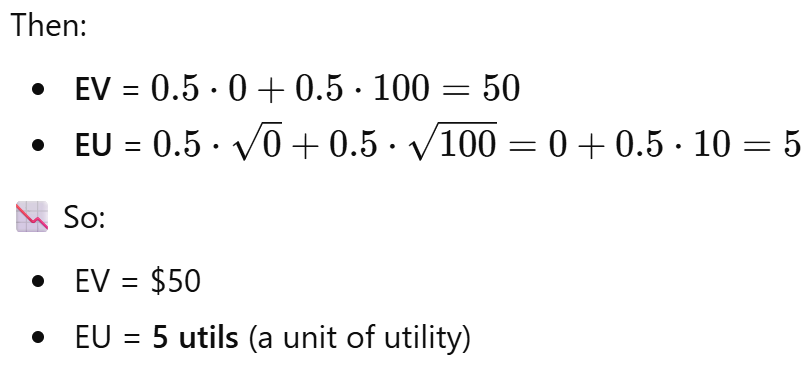
Example:
50% chance of $0, 50% chance of $100
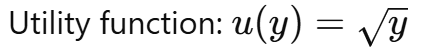
Utility function
EV - you focus on money, you find the average monetary outcome of a riskt choice
EU - focus on utility from outcome y, you find the the average satisfaction (utility) from a risky choice, based on how much you value each outcome.
What does it mean to be risk-averse?
A person is risk-averse if they prefer a guaranteed outcome over a risky one with the same expected value.
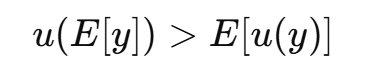
What is the formula that shows risk aversion?
This means the utility of the expected value is greater than the expected utility of the risky outcomes.
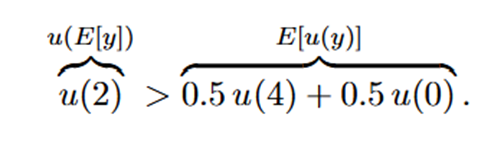
Example of risk aversion:M vs lottery
Option A: Sure 2M
Option B: 50% chance of 4M, 50% chance of 0
EV = 2M in both
What would a risk-averse person prefer
A risk-averse person prefers Option A:
u(2)>0.5u(4)+0.5u(0)
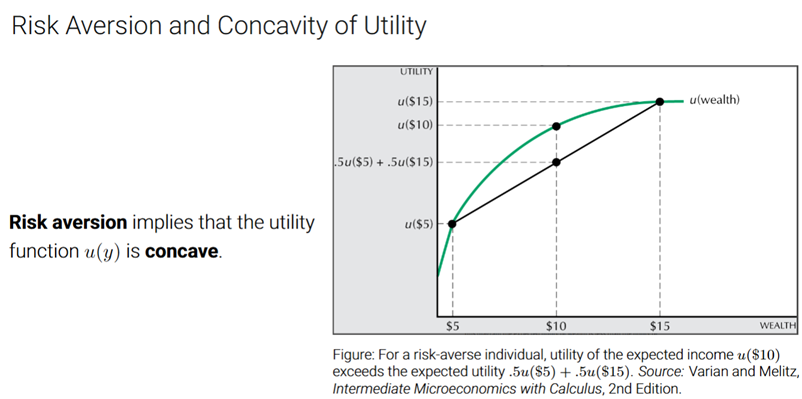
What shape does a risk-averse utility function have?
Concave — it bends downward. It shows diminishing marginal utility
What does a concave utility function mean?
The more money you have, the less extra happiness each additional dollar gives.
How do you show risk aversion visually?
u(E[y]): a point on the curve
E[u(y)]: a point below the curve (on the straight line connecting risky outcomes)
What is the Certainty Equivalent (CE)?
The guaranteed amount of money that gives the same utility as a risky option.
What is the formula for the Certainty Equivalent?
u(CE)=E[u(y)]
It equates the utility of the CE to the expected utility of a risky prospect.
How is Certainty Equivalent different from Risk Aversion condition?
CE defines the amount that matches expected utility.
Risk aversion says:
u(E[y])>E[u(y])
Meaning the person prefers the sure thing over the risky option.
Certainty Equivalent Example. If someone is indifferent between 1.5M NOK for sure and a 50/50 lottery between 4M and 0, then CE?
CE=1.5 → That’s the value of the lottery in certainty terms.
What is the Risk Premium (RP)?
The amount of money someone is willing to give up to avoid risk and receive a guaranteed amount instead.
What is the formula for Risk Premium?
RP=E[y]−CE
What does the Risk Premium measure?
The extra value the risky choice offers, but the person doesn’t want it due to discomfort with risk — so they accept less money for certainty.
Risk Premium Example
Expected value: 2 million NOK
Certainty equivalent: 1.5 million NOK
RP=2M−1.5M=0.5M
The person would give up 0.5M NOK to avoid risk.
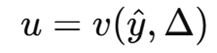
Simplification of EU - short cur
So instead of writing the full expected utility
we can simplify utility and get a shortcut that says:
What are the conditions to use the shortcut simplification?
Two outcomes only
Equal probabilities (50/50)
Outcomes are symmetric around the mean
Known utility function (typically concave)
What happens to utility when expected income increases?
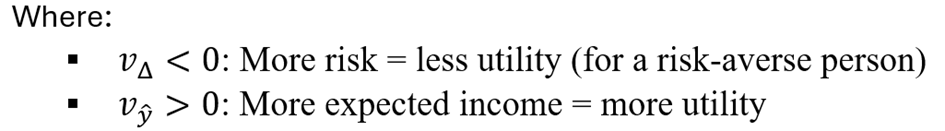
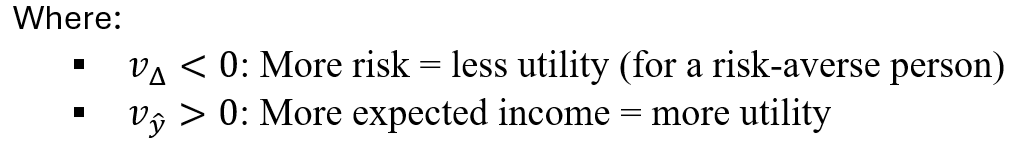
Given this:

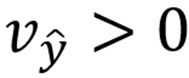
:Higher expected income increases utility (makes people happier).
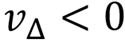
:Higher risk (uncertainty) reduces utility for risk-averse people.
Indifference curve in context of risk and expected income
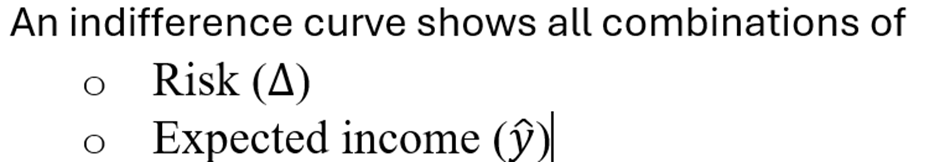
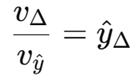
Slope of the indifference curve
The slope tells us: “how much expected income you’re willing to give up reducing risk a little bit
Illustrate the slope
So, the slope is positive – the curve slopes upward. To accept more risk, you need more income to stay equally happy. Graph:
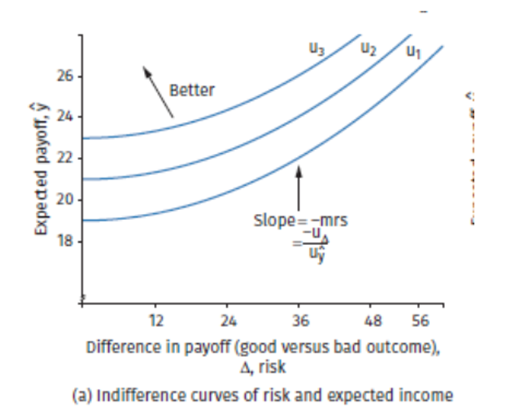
X-axis: risk & Y-axis: expected income/payoff.
Each blue curve is an indifference curve – points along the same curve give the same utility
The curve slope upward because more risk (right on the x-axis) needs to be balanced with more expected income (up on the y-axis. Meaning: you want me to take more risk, you better offer me more money
risk-return schedule
, which tells us what options are available to an individual or firm – based on real-world constraints like markets, technologies, or strategies
Key terms under risk-return

Formula for risk- return:
The slope of risk-return schedule
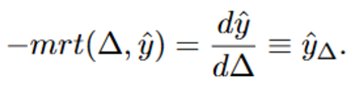
The marginal rate of transformation(mrt) describes how the decision maker can trade ogg expected income for risk. It shows how much expected income must decrease to achieve a marginal reduction in risk
Optimal point
where MRS=MRT or