Micro: Price determination in a competitive market
1/13
There's no tags or description
Looks like no tags are added yet.
Name | Mastery | Learn | Test | Matching | Spaced |
|---|
No study sessions yet.
14 Terms
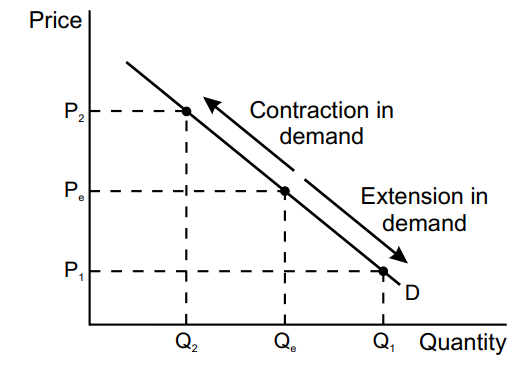
Movements on the demand curve
movements are caused by changes in price.
if the price of a good increases, the quantity demanded will decrease - resulting in a contraction in demand.
if the price of a good decreases, the quantity demanded will increase - resulting in an extension in demand.
all while assuming ceteris paribus
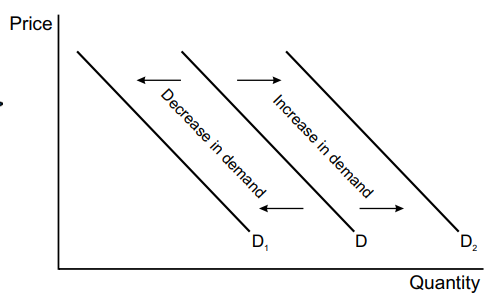
Shifts on the demand curve
The demand curve shifts when price stays the same but other factors change:
Population - as pop. increase = demand shifts right.
Advertising - more advertising = more demanded.
Substitutes - more substitutes = less demand for that good.
Income - higher income = more demanded.
Fashion trend - something in trend = more demanded.
Interest rates - high IR = demand shifts left.
Complementary - complementary good price increases = demand decreases of actual good.
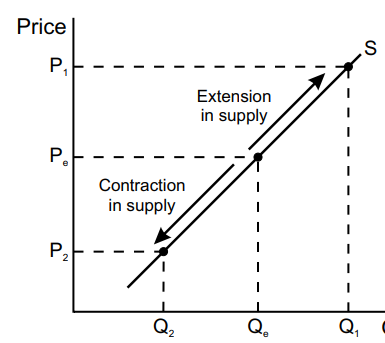
Movements on the supply curve
movements are caused by changes in price.
if the price of a good increases, the quantity supplied will increase - resulting in an extension in supply.
if the price of a good decreases, the quantity supplied will decrease - resulting in a contraction in demand.
all while assuming ceteris paribus
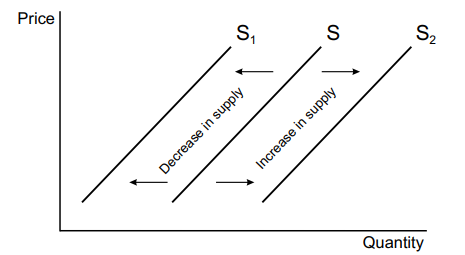
Shifts on the supply curve
The supply curve shifts when price stays the same but other factors change:
Productivity - higher productivity = more supply.
Indirect tax - more tax = supply shifts left.
Number of firms - more firms = more supply.
Technology - more technology to improve efficiency / innovation = supply shifts right.
Subsidies - more subsidies = more supply as costs are lower.
Weather - bad weather = reduce supply.
Cost of production - higher COP = supply shifts inwards.
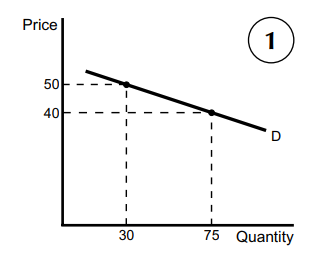
Calculating price elasticity of demand
PED = percentage change in quantity demanded / percentage change in price
PED = the responsiveness of quantity demanded of a good, to a change in its price.
Relatively elastic
when PED is greater than 1 (ignoring negative signs)
percentage change in quantity demanded is higher than percentage change in price.
usually elastic for luxury goods
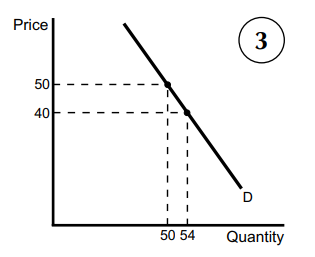
Relatively inelastic
when PED is between 0 and 1 (ignoring minus signs)
percentage change in quantity demanded is less than percentage change in price.
usually inelastic for necessity goods.
Factors that affect PED
Substitutes - more substitutes = more price elastic.
Percentage of income - the higher the percentage of income a good takes = more price elastic.
Luxury / necessity - a luxury good is price elastic, a necessity good is inelastic.
Addictive - the more addictive a good = more price inelastic.
Time period - short-run is inelastic, long-run is elastic (due to more substitutes).
Income elasticity of demand YED
YED = percentage change in quantity demanded / percentage change in income.
if YED > 0 , then it’s price elastic
if YED < 0 , then it’s price inelastic
if YED is positive , then normal/luxury goods are demanded.
if YED is negative , then inferior/giffen goods are demanded.
Cross elasticity of demand
XED = percentage change in quantity demanded of good A / percentage change in price of good B
if XED is positive, then the 2 goods are substitutes.
if XED is negative, then the 2 goods are complementary.
if XED = 0, then the 2 goods are unrelated/independent.
Price elasticity of supply
PES = the responsiveness of quantity supplied of a good, to a change in its price.
if PES > 0, then price elastic.
if PES between 0 & 1, then price inelastic.
Factors that affect PES
Production lag - a longer production lag = more price inelastic supply will be.
Stocks - larger level of stocks = price elastic.
Spare capacity - more spare capacity = price elastic.
Substitutability of factors of production - more substitutable the FOP’s = more price elastic.
Time - short-run is inelastic, long-run is elastic.
Equilibrium & disequilibrium
Equilibrium - when quantity demanded and quantity supplied are equal.
Disequilibrium - when quantity demanded and quantity supplied are unequal.
Excess supply:
if prices are set higher, then demand decreases and supply increases = excess supply.
so, prices need to be forced down to contract supply and extend demand, back to the equilibrium price.
Excess demand:
if prices are set lower, then demand increases and supply decreases = excess demand.
so, prices need to be pushed to contract demand and extend supply, back to the equilibrium price.
Terms to know about demand & supply changes
Substitute goods - goods which are alternatives to each other e.g., beef & chicken.
Complementary goods / joint demand - goods which are often used together e.g., tea and milk. these goods are in joint demand.
Derived demand - when demand for one good comes from the demand of another good e.g., demand for fencing leads to the demand for wood.
Composite demand - the demand for a good with multiple uses e.g., oil for fuel or making plastic.
Joint supply - the production of one good involves the production of another e.g., increased price of petrol = increased demand for oil drilling.