BIOL1611_FinalReview_2024
1/47
There's no tags or description
Looks like no tags are added yet.
Name | Mastery | Learn | Test | Matching | Spaced |
|---|
No study sessions yet.
48 Terms
Abiotic Factors
Biotic Factors
Scales at which they can exist
energy pyramids
food webs
fractional Trophic levels (quantifying)
Trophic Cascade
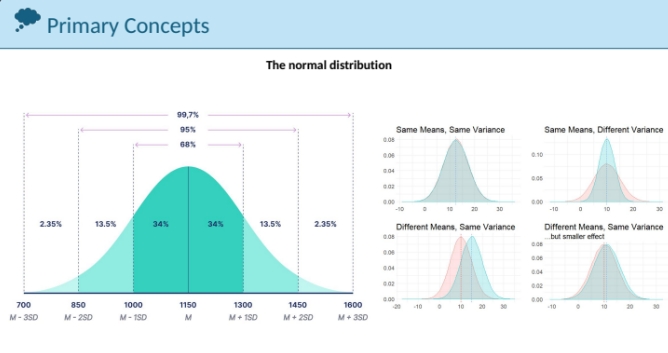
Mean
The average is a central value that represents a group. The sum of a set of values is divided by the number of values in the set.
variance
How much the data differs from the mean. How spread out the data is. The average of the squared differences between each data point and the mean. The higher the variance the higher the spread with respect to the mean.
standard deviation
A measure of the amount of variation in a set of values. How much the data differs from the mean in the original units. It is the square root of the variance. The higher the standard deviation the higher the spread of the values with respect to the mean.
The normal distribution
is a probability distribution that is symmetric about the mean, showing that data near the mean are more frequent in occurrence than data far from the mean. It follows a bell-shaped curve.
Measuring things
Length , mass, volume, and temperature area, heat, pressure, etc.
T-test
A statistical test used to compare the means of two groups to determine if they are significantly different from each other.
P-values
True value under the null hypothesis and most likely observation
Shapiro Wilks
Tests for normality. The null hypothesis assumes the data is normally distributed. Typically reject or accept null based on p-value
Stabilizing selection
Directional selection
diversifying selection
character displacement
relaxed selection
gene
allele
genotype
phenotype
phenotypic plasticity
canalization
box plots
nuisance variables
a variable that can affect the outcome of an experiment but is not the main focus of the study. They can be uncontrolled sources of variation that introduce bias or noise into an experiment.
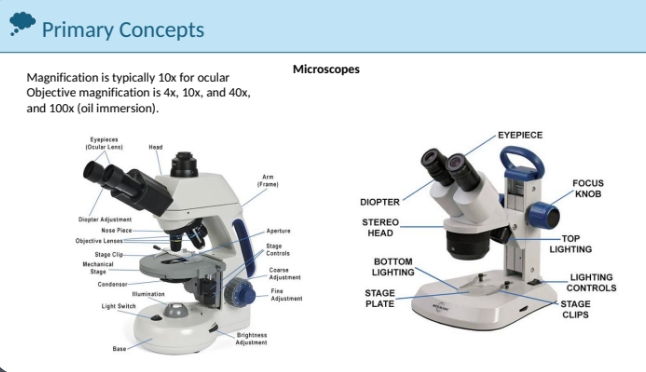
microscope
scale of phenotypes
stomatal density
hypothesis testing
The null hypothesis is the default position which states that there is no effect or relationship between the variables. It is the claim that researchers are trying to disprove. An alternative hypothesis is a hypothesis that researchers are trying to prove. It suggests that there is an effect or relationship between variables.
cellular respiration process and equation
carbonic acid formation
Types of Respiration
biotic and abiotic factors effecting respiration
phenolphthalein as an indicator
this is used as an indicator for pH change and is an indirect measurement
indirect measurements
gathering data about one or more variable to represent a second variable that is difficult to measure directly
F-test
This is used to compare the variance of two groups to see if they have equal or unequal variance.
F-statistic
variance
open vs. closed circulation
choosing the appropriate model
One sample t-test
difference between the means of a sample group and a standard group
Independent samples t-test
Difference between two groups. Between subjects
Paired Samples t-test
Between same individuals before and after.