Lecture 3 - Degree of Freedom and Goodness of Fit
1/18
There's no tags or description
Looks like no tags are added yet.
Name | Mastery | Learn | Test | Matching | Spaced |
|---|
No study sessions yet.
19 Terms
Degrees of Freedom:
number of independent pieces of information that are used to evaluate an estimate of a parameter… number of unconstrained variables
Degree of freedom is equal to:
Number of independent data points used in the estimate minus the number of parameters used in the estimation that have already been determined from the data set
Purpose of the goodness-of-fit
to test how well your data fits a certain model
Method for the goodness-of-fit
You calculate a χ2(chi^2) value from the difference between your observed data and the model
the chi-squared distribution is:
The theoretical framework that tells us how to evaluate the goodness-of-fit based on the calculated χ2 value… well-known and well-behaved distribution
What does chi-squared distribution depend on?
depends on the degrees of freedom (k) which is calculated by N-d (number of parameters, 1)
What is the mean and standard deviation of the chi-squared distribution?
the mean value equal to k and standard deviation equal to sqrt(2k)
What is the probability distribution of chi-squared distribution with k degrees of freedom?
describes the probability distribution of the sum of squares of k independent standard Gaussian random variables
What is the normal distribution mean and standard deviation?
mean of 0 and standard deviation of 1
If the least-squares fit is good then the residuals…
follow a gaussian distribution
least-squares fit:
trying to find the best fit model to your data points minimizing the difference between observed values (data) and predicted values (model)
Minimized χ² value (χ²_min)
refers to the value of χ² function at the point where this sum of squared differences is smallest, indicating the best fit… value of χ² when the residuals are minimized
the lower the value, the closer to your model the data is
P-value:
probability of obtaining a χ² value greater than or equal to calculated χ²… computed using intergral of χ² distribution
P-value indicates:
the probability of getting a χ² value as high or higher than χ²_min purely by chance if the model is correct
For a reasonable fit
χ²_min should be close to the mean of χ² distribution
χ²_min will be approximately equal to k
for larger values of k, χ² distribution becomes more symmetric
P(χ²_min ≈ k; k)
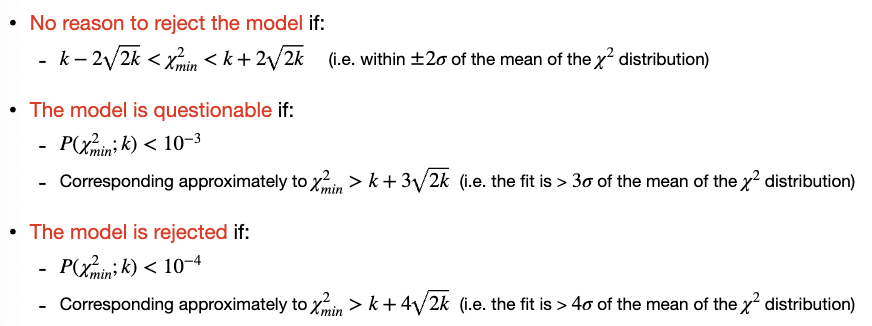
Accept the model
χ²_min is within ±2√(2k) of the mean k, it suggests the model fits well, and there is no reason to reject it
Model is questionable
If P(χ²_min; k) < 10⁻³, meaning the fit is poor, or χ²_min is more than 3 standard deviations (σ) away from the mean
Model is rejected
If P(χ²_min; k) < 10⁻⁴, or χ²_min is more than 4 standard deviations (σ) away from the mean… indicates poor fit which is why we reject the model
Testing goodness of fit summary
if P(χ²_min; k) = 1 check the uncertainty calculations on your measurements and appropriateness of fit function