Geography SL - Population
1/116
Earn XP
Description and Tags
Name | Mastery | Learn | Test | Matching | Spaced |
|---|
No study sessions yet.
117 Terms
2 factors that affects distribution of population
Relief and Climate
Relief
How high/low the land is
Climate
The temperature and weather aspects of the land
Population distribution
The spread and pattern of where people live
Population density
The measurement of the number of people in an area (usually measured in people per square km)
Scales of population
Global
National
Regional
Local
Factors that influence population density
Physical - relief, climate and resources
Human - political, social and economic
Core-periphery theory
a way that the world economic systems are divided into 3 different groups
Core
Countries having high levels of industrialisation and doesn’t need to depend on each other as much.
Semi-periphery
Countries with economic growth and is heading towards becoming a Core. (In-between phase).
Periphery
Countries that tend to be more reliant on the core countries and are less industrialized and economically developed
Friedmann’s Theory
The beneficial affects will spread from core to periphery
Market Economy
An economic system where prices are made with no rules or restricted competition
Myrdal’s Model of Cumulative Causation
used to explain regional differences or polarisation. Only works if peripheral area has resources and is more likely to be applied to a region.
Backwash
Rural populations migrating to core countries. This affects the development of peripheries
Migration
The movement of people, involving a permanent change of residence
Emigration
When someone leaves a country or place
Immigration
When someone enters a country or place
Asylum seeker
Someone forced to migrate and is seeking protection from persecution or human rights violation
Refugee
Someone who is forced to migrate but they have a recognised status and already have asylum
Push factors of political migration
Corruption
Retaliation
Taxes spent poorly
Collapsed government
Strict laws (against human rights)
Dictatorship
Pull factors of political migration
High government satisfaction
Taxes spent well
Gender equality
Stable democracy
Tolerance for LGBTQ+
Crude birth rate
The number of live births occurring during the year, per 1000 population
Crude death rate
The number of deaths occurring during the year, per 1000
Natural increase/decrease
The difference between crude birth rate and crude death rate
Natural increase/decrease formula
crude birth rate - crude death rate
Fertility rate
The average number of children that would be born alive to a woman during her lifetime
Population projection
The prediction of future populations based on present age-gender structure, and with present rates of fertility, mortality and migrations
Replacement level fertility
Fertility rate that replaces population
Population momentum
Tendency for population growth to continue beyond the time that replacement level fertility has achieved because of a relatively high concentration of people in the childbearing years
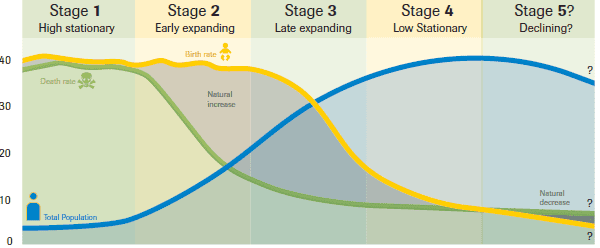
Demographic Transition Model
Shows the change/stage of a country’s population through birth/death rate

Natural change
difference between birth rate and death rate
Natural increase
When the number of births is higher than the number of deaths
Natural decrease
When the number of deaths is more than the number of births
Stage 1 of Demographic Transition Model
Lots of fluctuating
Low population
Population is increasing very slowly
High birth/death rates
Stage 2 of Demographic Transition Model
Population growing faster
Decreasing death rate
Still a high birth rate, but slowly declining
Example: Afghanistan - women very limited in terms of access to education, causing high birth rates and a continuously increasing population. Rise in population also caused by decrease in death rates.
Stage 3 of Demographic Transition Model
Population still increasing, but the rate of increase is slowing down
Decreasing birth rate
Low death rate
Example: India - They have experienced a significant decline in fertility rates which has improved their high population but not stabilised it. India’s crude death rate is 9.45 deaths per 1000 which is low compared to what is considered high (30 per 1000)
Stage 4 of Demographic Transition Model
High population
Growth starting to plateau (= less fast)
Low birth rate
Low death rate
Example: Australia - Have a crude birth rate of 12.1 births per 1000 (considered in low range) and a crude death rate of 6.7 deaths per 1000 (considered in low range)
Stage 5 of Demographic Transition Model
Population growth declining
Birth rate lower than death rate
No population momentum anymore
What could be the main driver behind low birth rates
Example: Japan - Population of Japan is aging with 1 in 3 people being 65 years or older. Japan's population is low birth rate and high life expectancy. Millions had died because of the war and between the years of 1947 and 1949 of post-war life, 8 million babies had been born (baby boomers generation).
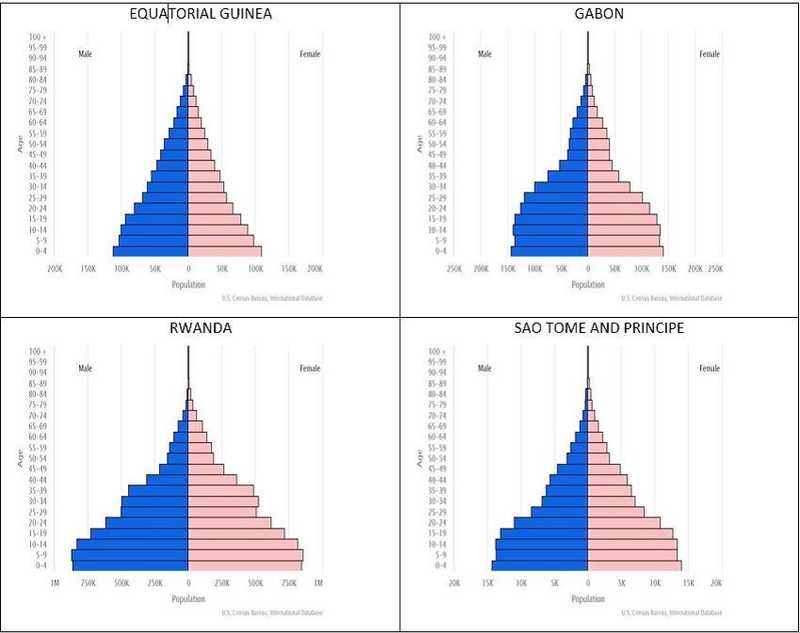
Population pyramid
A graph showing the age-sex distribution of a given population

Information a population pyramid gives you
Age and sex structure of a population
Birth rates
Death rates
Immigration and emigration
Number of dependents (15 > n > 65)
Life expectancy
Population explosion in LEDCs
Less access to contraceptives
Labour opportunities
Growing economy
Religion
Population decline in MEDCs
More access to contraception
Independence/liberal
Better education (awareness of safe sex)
Family planning
Dependency ratio
Age-population ratio of those typically not working. This ratio is used to measure the financial pressure on the actively working population on a community
High ratio = bigger burden on working-age people
Low ratio = more people are working who can support the dependent population
Total (age) Dependency Ratio
population (0-14) + population (64+)
— — — — — — — — — — — — — — x 100
working age population (15-64)
Child Dependency Ratio
population (0-14)
— — — — — — — — — — — — — x 100
working age population (15-64)
Old Age Dependency Ratio
population (64+)
— — — — — — — — — — — — — x 100
working age population (15-64)
Productive population
Working population
Aging population issues
Stress on retirement funds
Stress on healthcare sector (doctors, specialists, etc.)
High demand for adequate housing, care, transportation, services, etc.
demands cause higher taxes in order to be fulfilled
Aging population benefits
Growing market for leisure and health products
High demand for housing in certain retirement locations
A large proportion of aging people can add experience to work force
What can be done when fertility rates are low
Raise retirement age
Increase taxes
Abolish state pensions
support population growth:
subsidies
social help
adjust laws
Advantages of a youthful population
Provides a large and cheap workforce
Big working class could be a large base tax
Big working class could also be a big market
Disadvantages of youthful population
Lack of services and facilities for all young people
Strain on food supplies
Strain on accommodation
Lack of job opportunities in the future
Reproductive age range
The range of age at which a woman is able to reproduce (12-51)
Infant Mortality Rate (IMR)
the number of infant deaths for every 1,000 live births
Child Mortality Rate
the number of infant deaths for every 1,000 live births
Gender- related development index (GDI)
measures gender inequalities in the accessibility of human necessities: a long and healthy life, a good education, and a decent standard of living
Gender Ratio
The ratio between the number of males and females in a society
Gender inequality
discrimination of sex or gender causing one to be routinely privileged or prioritised over another.
Population policy
a set of measures taken by a State to modify the way its population is changing
Pro-natalist policy
Aims to encourage more births through the use of:
campaigns
events
national days
increase taxes if people don't reproduce.
Anti-natalist policy
a government policy to slow down the fertility rate of a country
Gender equality policy
aims to strengthen the economic independence of women and raise the percentage of women in employment.
Census
A method that tells us how developed, grown, far in society (etc.) we are
Doubling time
The number of years required for a specified population to double in size at the current rate of population growth.
Population projection
an estimate of a future population.
Population distribution
how people are spread across the earth/country/land
Population density
a measurement of population per unit land area
Population momentum
when a country's fertility rate declines to or below replacement level (2.1 children per woman), yet the population size continues to grow due to the age structure of the population
Population growth rates
the increase in the number of people in a population or dispersed group
Demographic dividend
An occurrence in a country that enjoys accelerated economic growth that stems from the decline in fertility and mortality rates; receiving an economic dividend or benefit from the increase in productivity of the working population that ensues.
Population structure
The breakdown of different groups and amounts of people in an area.
Internal migration
Migration that occurs within country borders
Forced migration
When someone leaves their country due to an element of coercion, including threats to life and livelihood, whether arising from natural or man-made causes
Internally Displaced Persons (IDP)
Someone who is forced to leave their home but who remains within their country's borders.
International migration
the migration of people across international borders for the intention of settling
Circular migration
the temporary and usually repetitive movement of a migrant worker between home and other countries, typically for employment.
Human trafficking
The trade of people for the purpose of forced labour, sexual slavery, or commercial sexual exploitation. Human trafficking can occur within a country or trans-nationally.
Trafficked people
Common types of people who get trafficked are:
Children
Women
People in poverty
People with unstable housing
Push factors
Factors that make you want to leave your country (war, natural disaster, government corruption, lack of liberty, etc.)
Pull factors
Factors that convince you to move to a country (job opportunities, liberty, LGTBQ acceptance, etc.)
Economic migration
the migration of people from one country to another to benefit from greater economic opportunities in the receiving country.
Development gap
the widening difference in levels of development between the world's richest and poorest countries
MEDC
More Economically Developed Country
LEDC
Less Economically Developed Country
LDC
Least Developed Countries (Bangladesh, Nepal, Afghanistan, Rwanda, Niger, Ethiopia, etc.)
H/M/LICs
High/Medium/Low Income country
NICs
Newly Industrialised Country
BRICs
Brazil, Russia, India, China
MINT
Mexico, Indonesia, Nigeria, Turkey
CIVETS
Colombia, Indonesia, Vietnam, Egypt, Turkey, South Africa
Next 11
Bangladesh, Egypt, Indonesia, Iran, Mexico, Nigeria, Pakistan, Philippines, Turkey, South Korea, Vietnam
CPEs
Centrally Planned Economies
RICs
Recently Industrialised Countries
Emerging economies
A market that has some characteristics of a developed market, but does not fully meet its standards. Some examples are; India, Mexico, Russia, Pakistan, Saudi Arabia, China, and Brazil.
Oil-rich countries
Saudi Arabia, Kuwait, Russia, Iran, UAE, Iraq, Venezuela, Canada, United States, Nigeria, China, Libya, Brazil, Qatar, Angola, Mexico, Algeria, Oman, Egypt, Kazakhstan, Sudan, Brunei, Columbia, Bahrain
GNP per capita
Gross National Product = estimate of the total value of all the products and services turned out in a given period
GNI per capita
Gross National Income = the value of a country's final income in a year divided by its population
OPEC
The Organization of the Petroleum Exporting Countries = an organization enabling the co-operation of leading oil-producing countries in order to collectively influence the global oil market and maximize profit.
The G7
Group of seven = an intergovernmental political & economic forum consisting of Canada, France, Germany, Italy, Japan, the UK and the US