3.1 Measuring Economic Activity
1/19
There's no tags or description
Looks like no tags are added yet.
Name | Mastery | Learn | Test | Matching | Spaced | Call with Kai |
|---|
No analytics yet
Send a link to your students to track their progress
20 Terms
Circular Flow of Income Model

Expenditure Approach
Measures total amount of spending to buy final goods and services in a country (1 year)
C+G+I+(X-M)=GDP
Output Approach
Measures total value of all goods and services produced in the economy over a time period (1 year)
*Final means that it only considers the price at which the good is sold at
GDP
Total value of all final goods and services produced within the country over a time period, regardless of who owns the factors of production.
Indonesian domestic helper in HK. GDP? GNI?
Income goes to Indonesia’s GNI
Output goes to HK’s GDP
GNI
Total income recieved by the residents of the country, regardless where they are located.
GNI Formula
GNI= GDP + Net income from abroad.
E.g Indonesia’s GNI includes it’s domestic output of goods + the income of domestic helpers in HK as well
Nominal GDP
GDP expressed in the price level of that year.
Real GDP
GDP adjusted for the changes in price level from a base year.
If base year, then GDP deflator is 100
Real GDP formula
Nominal GDP/Price Deflator * 100
GDP per capita (formula + use)
Provides indication of how much total output in the economy corresponds to each person in population on average.
Limitations of GDP (5 args.)
Doesn’t include non-market goods/services (e.g volunteer work, trading). Therefore, GDP is under-reported in less developed countries as they make their own goods
Underground OR informal Economy (e.g drugs, HK wet market, taxi services using cash)
Does not reflect improved product quality (better, more efficient machines = goods are higher quality, but also can be sold at lower prices)
Doesn’t account for environmental damage, distribution of income, quality of life
Differing domestic price levels
Alternate Measures of Wellbeing
OECD Better Life Index
Happiness Index
Happy Planet Index
Business Cycle
Fluctuations in growth of real output, consists of periods of expansion and contraction
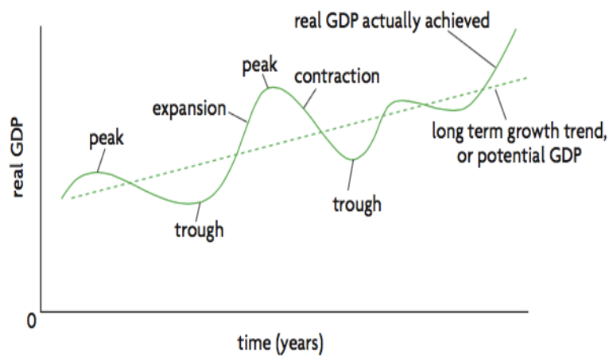
Expansion stage (feature + effects)
Trough —> Peak
Real GDP higher than Potential GDP
Effects:
Unemployment ↓
Price Level ↑
Consumer + Business Confidence ↑
Peak
Highest point inbetween expansion and contraction
Effects:
Saturation point (max)
Resource allocation efficiency ↑↑
Unemployment ↓↓
Recession
Decrease in Real GDP/Negative economic growth for 2 consecutive quarters
Effects:
Resource allocation efficiency ↓
Unemployment ↑
Price Level ↓
Demand for goods/services ↓
Trough
Minimum of business cycle
Effects:
Uncertainty ↑↑
Unemployment ↑↑
Confidence ↓↓
Recessionary Gap (unemployment, gdp)
Potential GDP > Real GDP
UR > NRU
Inflationary Gap (unemployment, gdp)
Real GDP > Potential GDP
NRU > UR