Graphs and Statistics Test Topics for MATH-310-01
1/39
There's no tags or description
Looks like no tags are added yet.
Name | Mastery | Learn | Test | Matching | Spaced |
|---|
No study sessions yet.
40 Terms
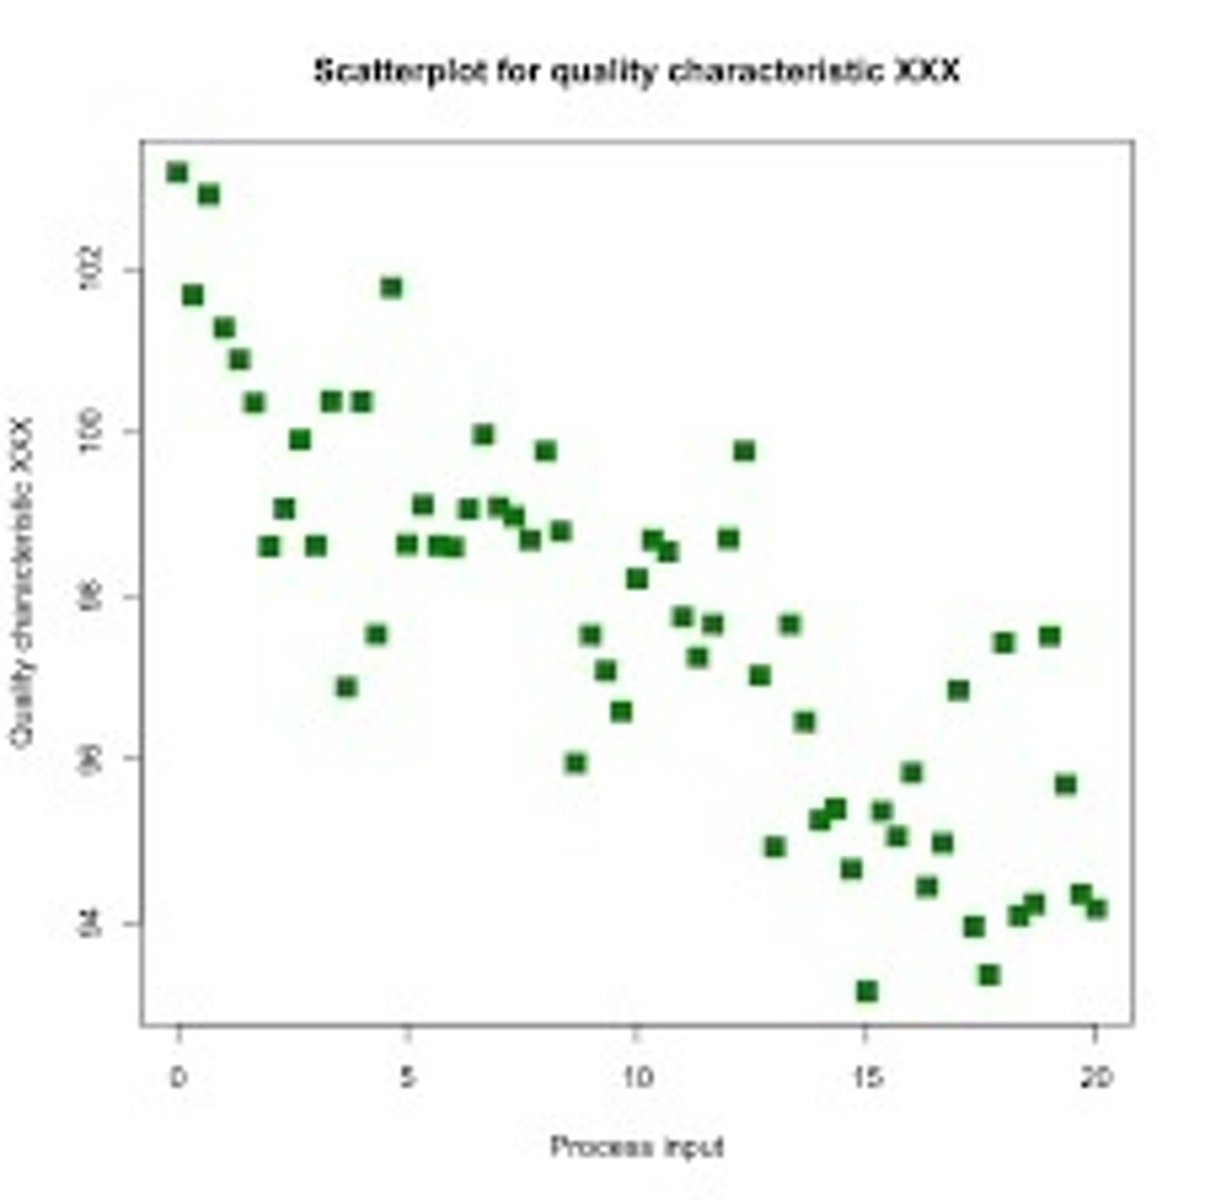
Scatterplot
Graph showing relationship between two variables.

Correlation
Relationship strength between two variables.
Positive Correlation
Both variables increase together.
Negative Correlation
One variable increases while the other decreases.
No Correlation
No discernible relationship between variables.
Bi-variate Data
Data involving two different variables.
Mean
Average value of a data set.
Median
Middle value when data is ordered.
Mode
Most frequently occurring value in data.
Upper Quartile
Value separating the highest 25% of data.
Lower Quartile
Value separating the lowest 25% of data.
Interquartile Range
Difference between upper and lower quartiles.
Range
Difference between maximum and minimum values.
Upper Extreme
Highest value in a data set.
Lower Extreme
Lowest value in a data set.
Outliers
Values significantly different from others.
Boxplot
Graphical representation of data quartiles. (ONE)
Parallel Boxplots
Graph showing relationship between two variables.
Statistical Questions
Questions that can be answered with data.
Non-statistical Questions
Questions not answerable by data analysis.
Categorical Data
Data representing categories or groups.
Numerical Data
Data representing measurable quantities.
Object Graph
the web of communicating classes solving the same problem
picture graph
A graph that uses pictures or symbols to show data.
bar graph
A graph that uses horizontal or vertical bars to display data
line plot
A method of visually displaying a distribution of data values where each data value is shown as a dot or mark above a number line. Also known as a dot plot.
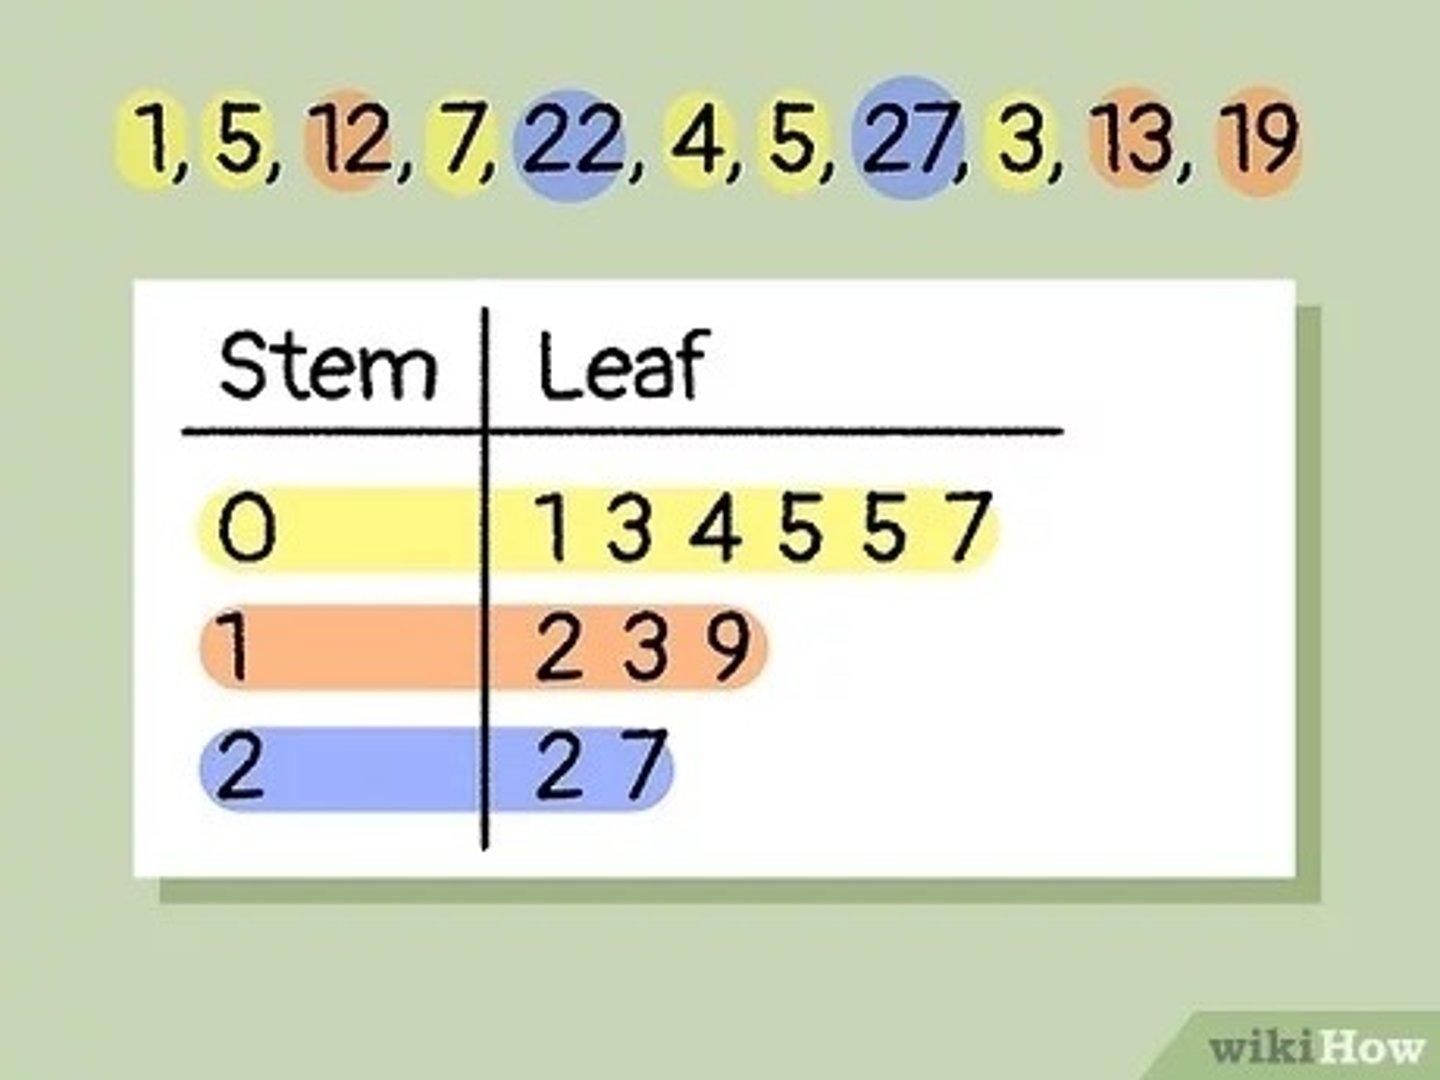
stem and leaf plot
A method of graphing a collection of numbers by placing the "stem" digits (or initial digits) in one column and the "leaf" digits (or remaining digits) out to the right.

circle graph
A graph of data where the entire circle represents the whole or 100%
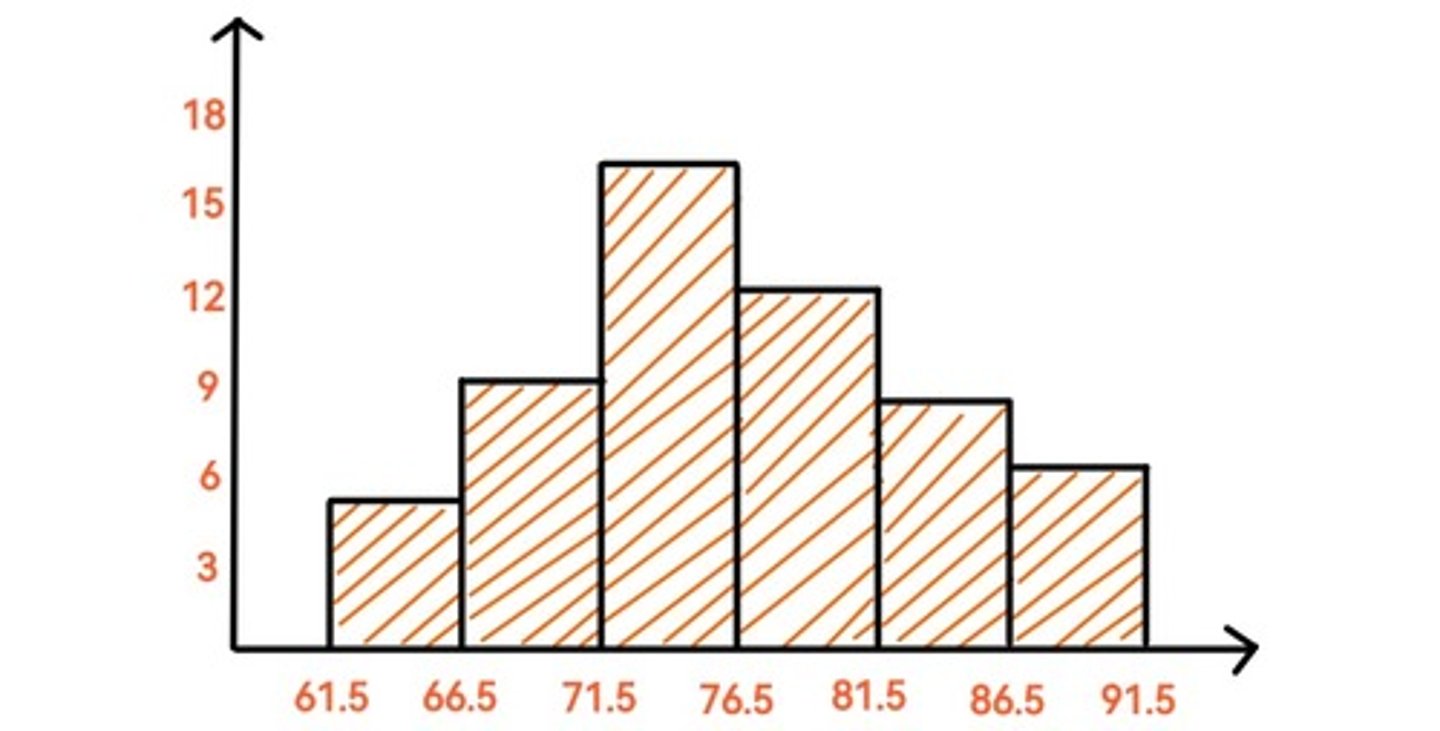
Histogram
a bar graph depicting a frequency distribution

How to find IQR (interquartile range)
UQ-LQ
How to find outliers using IQR
above: UQ+1.5(IQR)
below: LQ-1.5(IQR)
How to find the mean of a set of numbers?
Add all the numbers.,
Divide the total by the number of items in your data set
How to find the mode of a set of numbers?
the number that appears most often in a set of numbers
How to find the median of a set of numbers?
Arrange the numbers in numerical order.
The middle number is the median.
If there are two middle numbers you need to add both numbers and divide by 2.
how to find the range of a set of numbers
the biggest number minus the smallest number
how to find the percentage and the central angle in a circle graph
Percentage: turn the fraction into a percent
ex: 5/21=0.238=23.8%
central angle: multiply the decimal number by 360 degrees
ex: 0.238x360=86 degrees
process of statistical investigation
1. pose question
2. collect data
3. analyze data
4. interpret data
How to find upper quartile
the median of the upper half of the data set
How to find lower quartile
the median of the lower half of the data set
bar graph vs. histogram
bars on a histogram touch to show that they are increasing, related variables whereas in a bar graph, they are not
The bar graph is the graphical representation of categorical data. A histogram is the graphical representation of quantitative data