HUMAN POPULATION APES
1/28
There's no tags or description
Looks like no tags are added yet.
Name | Mastery | Learn | Test | Matching | Spaced | Call with Kai |
|---|
No analytics yet
Send a link to your students to track their progress
29 Terms
Demography
Study of human populations
Population Change formula
🔼N = (Birth rates + Immigrants) - (Death rates + Emigrants)
Calculation of new N formula
\displaylines{Nnew=Nog+\forall N}
Birth Rate / CBR
1000 people in one year
Death Rate / CDR
1000 people in one year
Annual rate of natural pop change formula
(Birth Rates - Death Rates) / 10
Good news about annual population change
% is dropping
Bad news about annual population change
World population is growing too fast
World growth rate
0.9%
Doubling Time
70/Rate
Replacement-level Fertility
Number of children a couple must have to replace themselves
Population Momentum
Even if RLF is achieved, a pop will continue to grow because of people entering reproductive years
Total Fertility Fate (TFR)
An estimate of # of children a woman will have
Fertility Rates in the US
•TFR maxed out in Baby Boomer years (1946-1964)
•TFR = 3.7 in 1957
•Generation X (baby bust) (1965-1980)
•Generation Y/Millenials/Echo baby boomers (1981-1996)
•Generation Z (1997-2012)
•Generation Alpha (2013-2025)
Factors affecting birth rates and fertility rates
•Education
•Affluence/Wealth
•Children needed for work
•Urbanization (Family planning access)
•Females in the workforce
•Females in the workforce
•Cost of raising children
•High IMR
•Age of marriage
•Retirement plan
•Abortion availability
•Religion
•Culture
Life expectancy
How long one can expect to live
Increased life expectancy
•Nutrition
•Better medical care
•Hygiene
•Clean water
Decreased infant mortality rate (IMR)
•Number of infants pero 1000 lke births that die before their first birthday
•One of the single most important way to judge the quality of life in a country
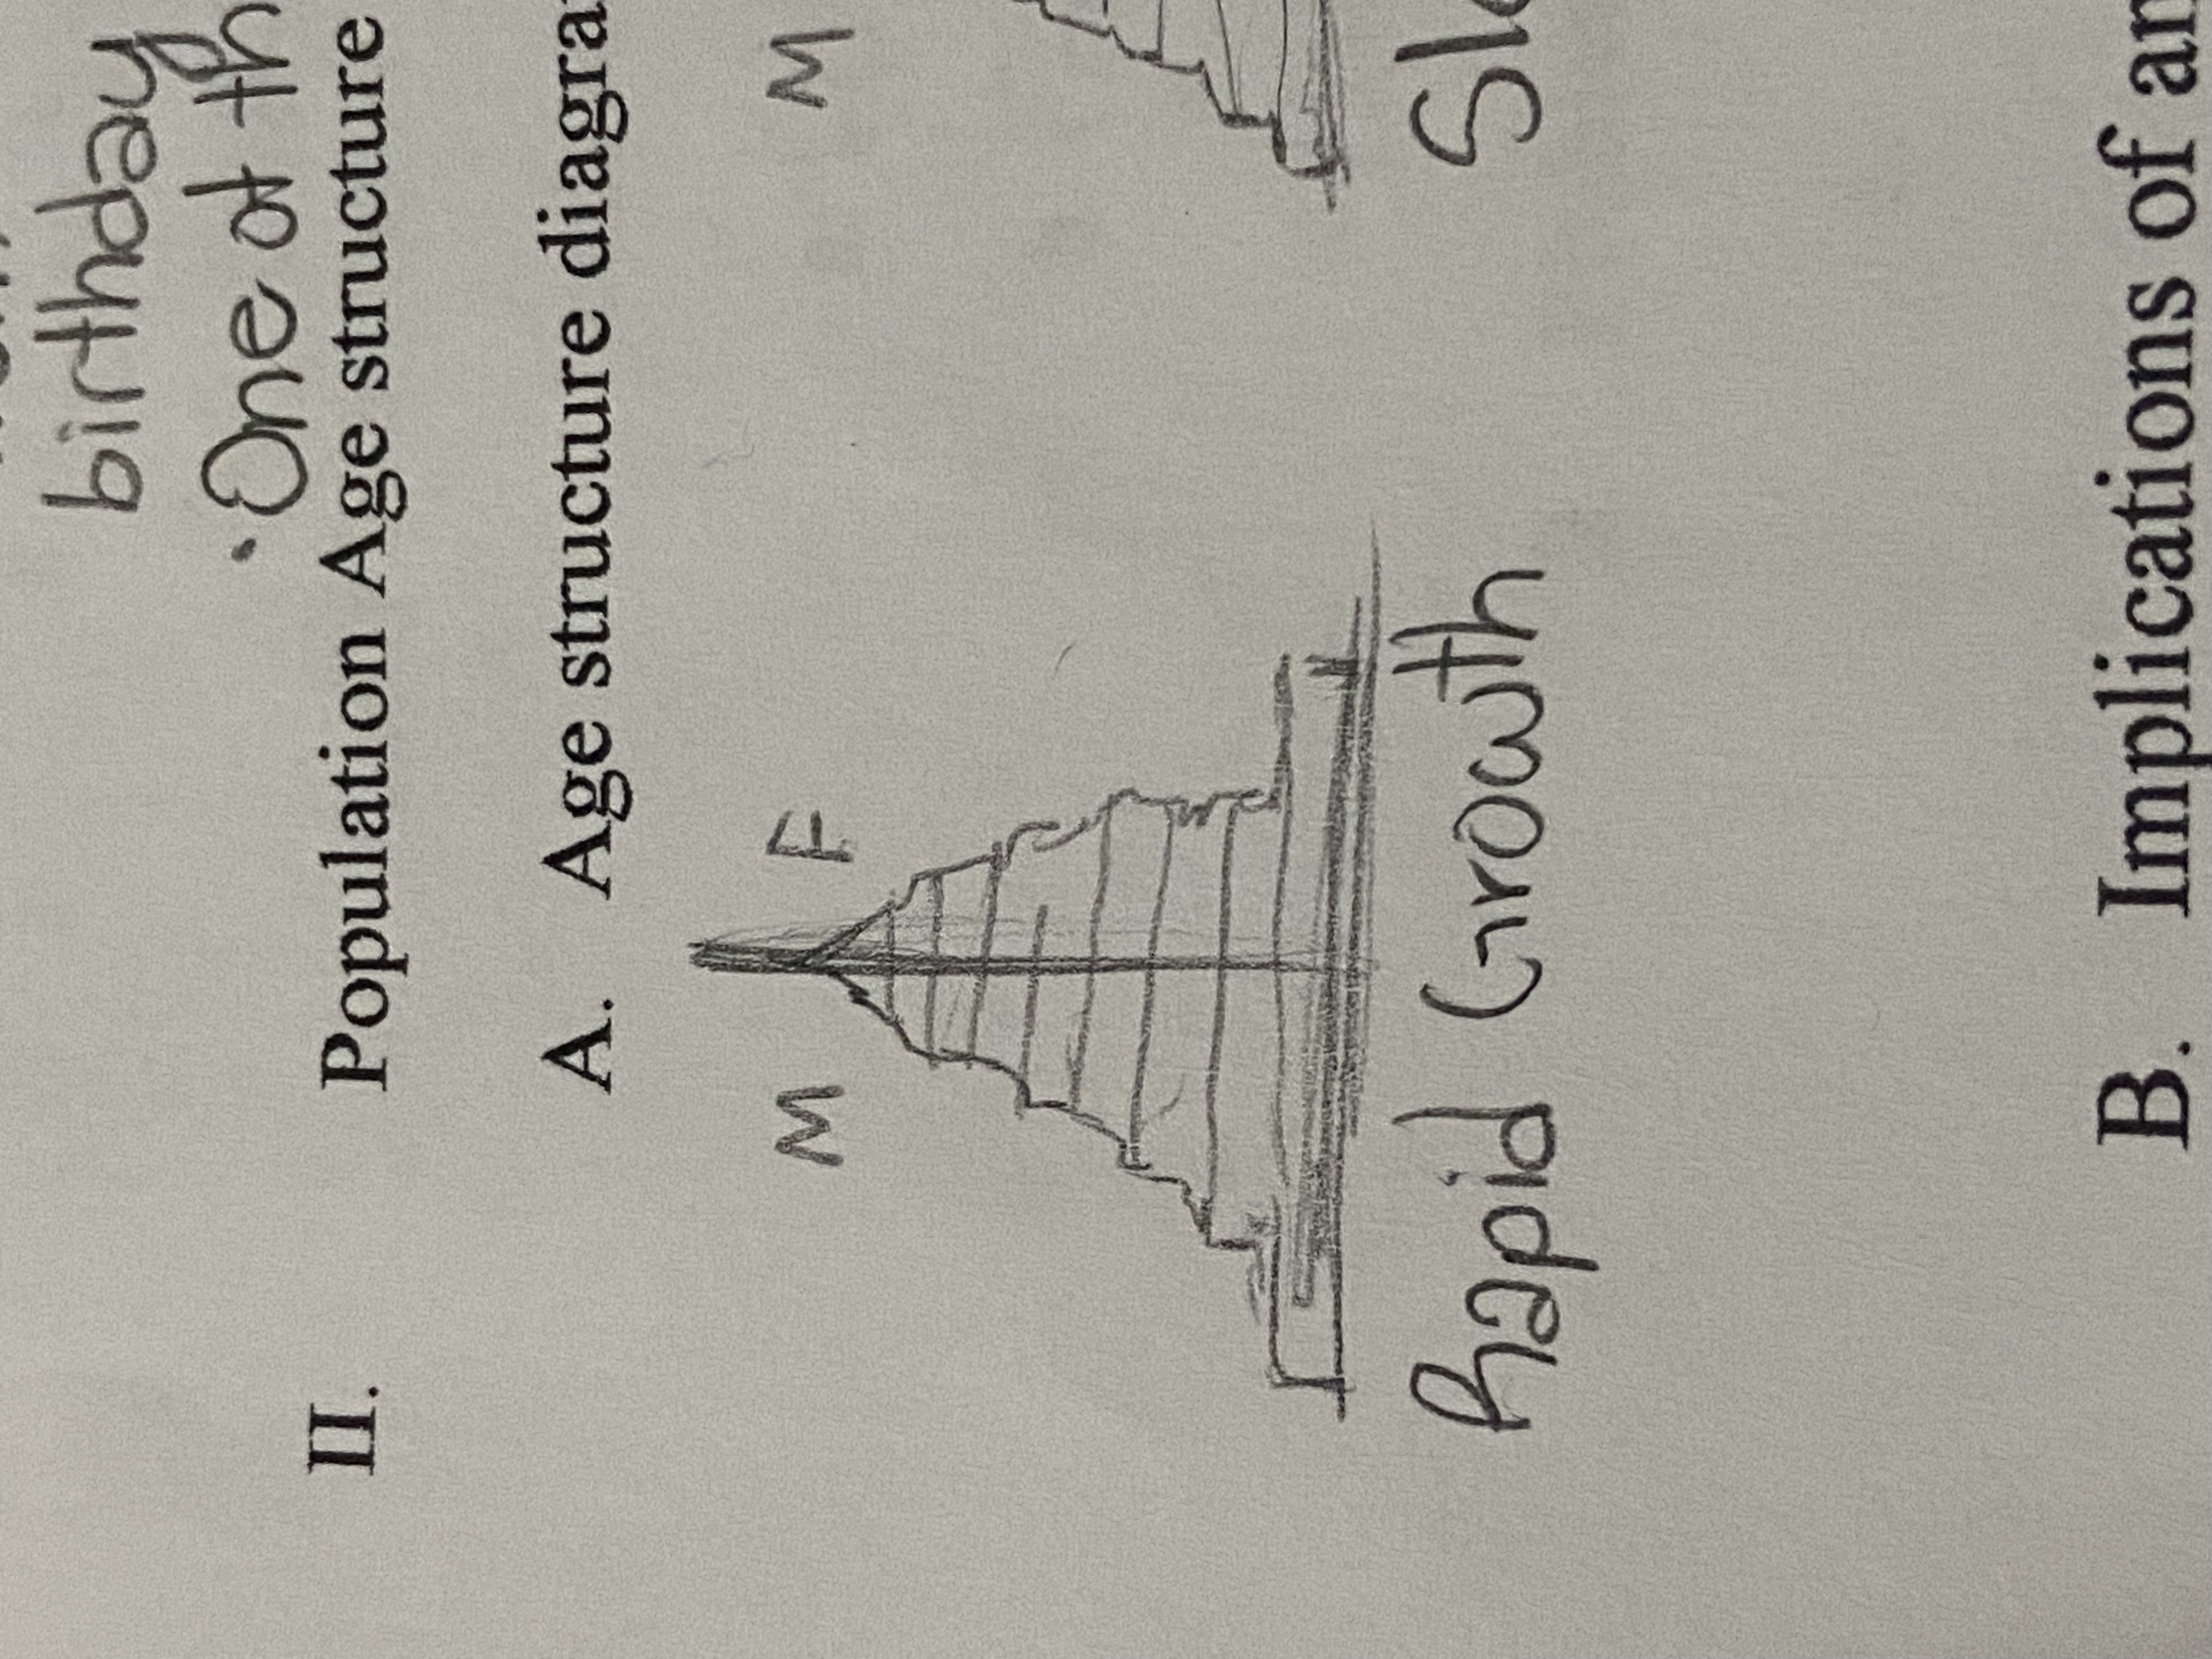
Rapid Growth
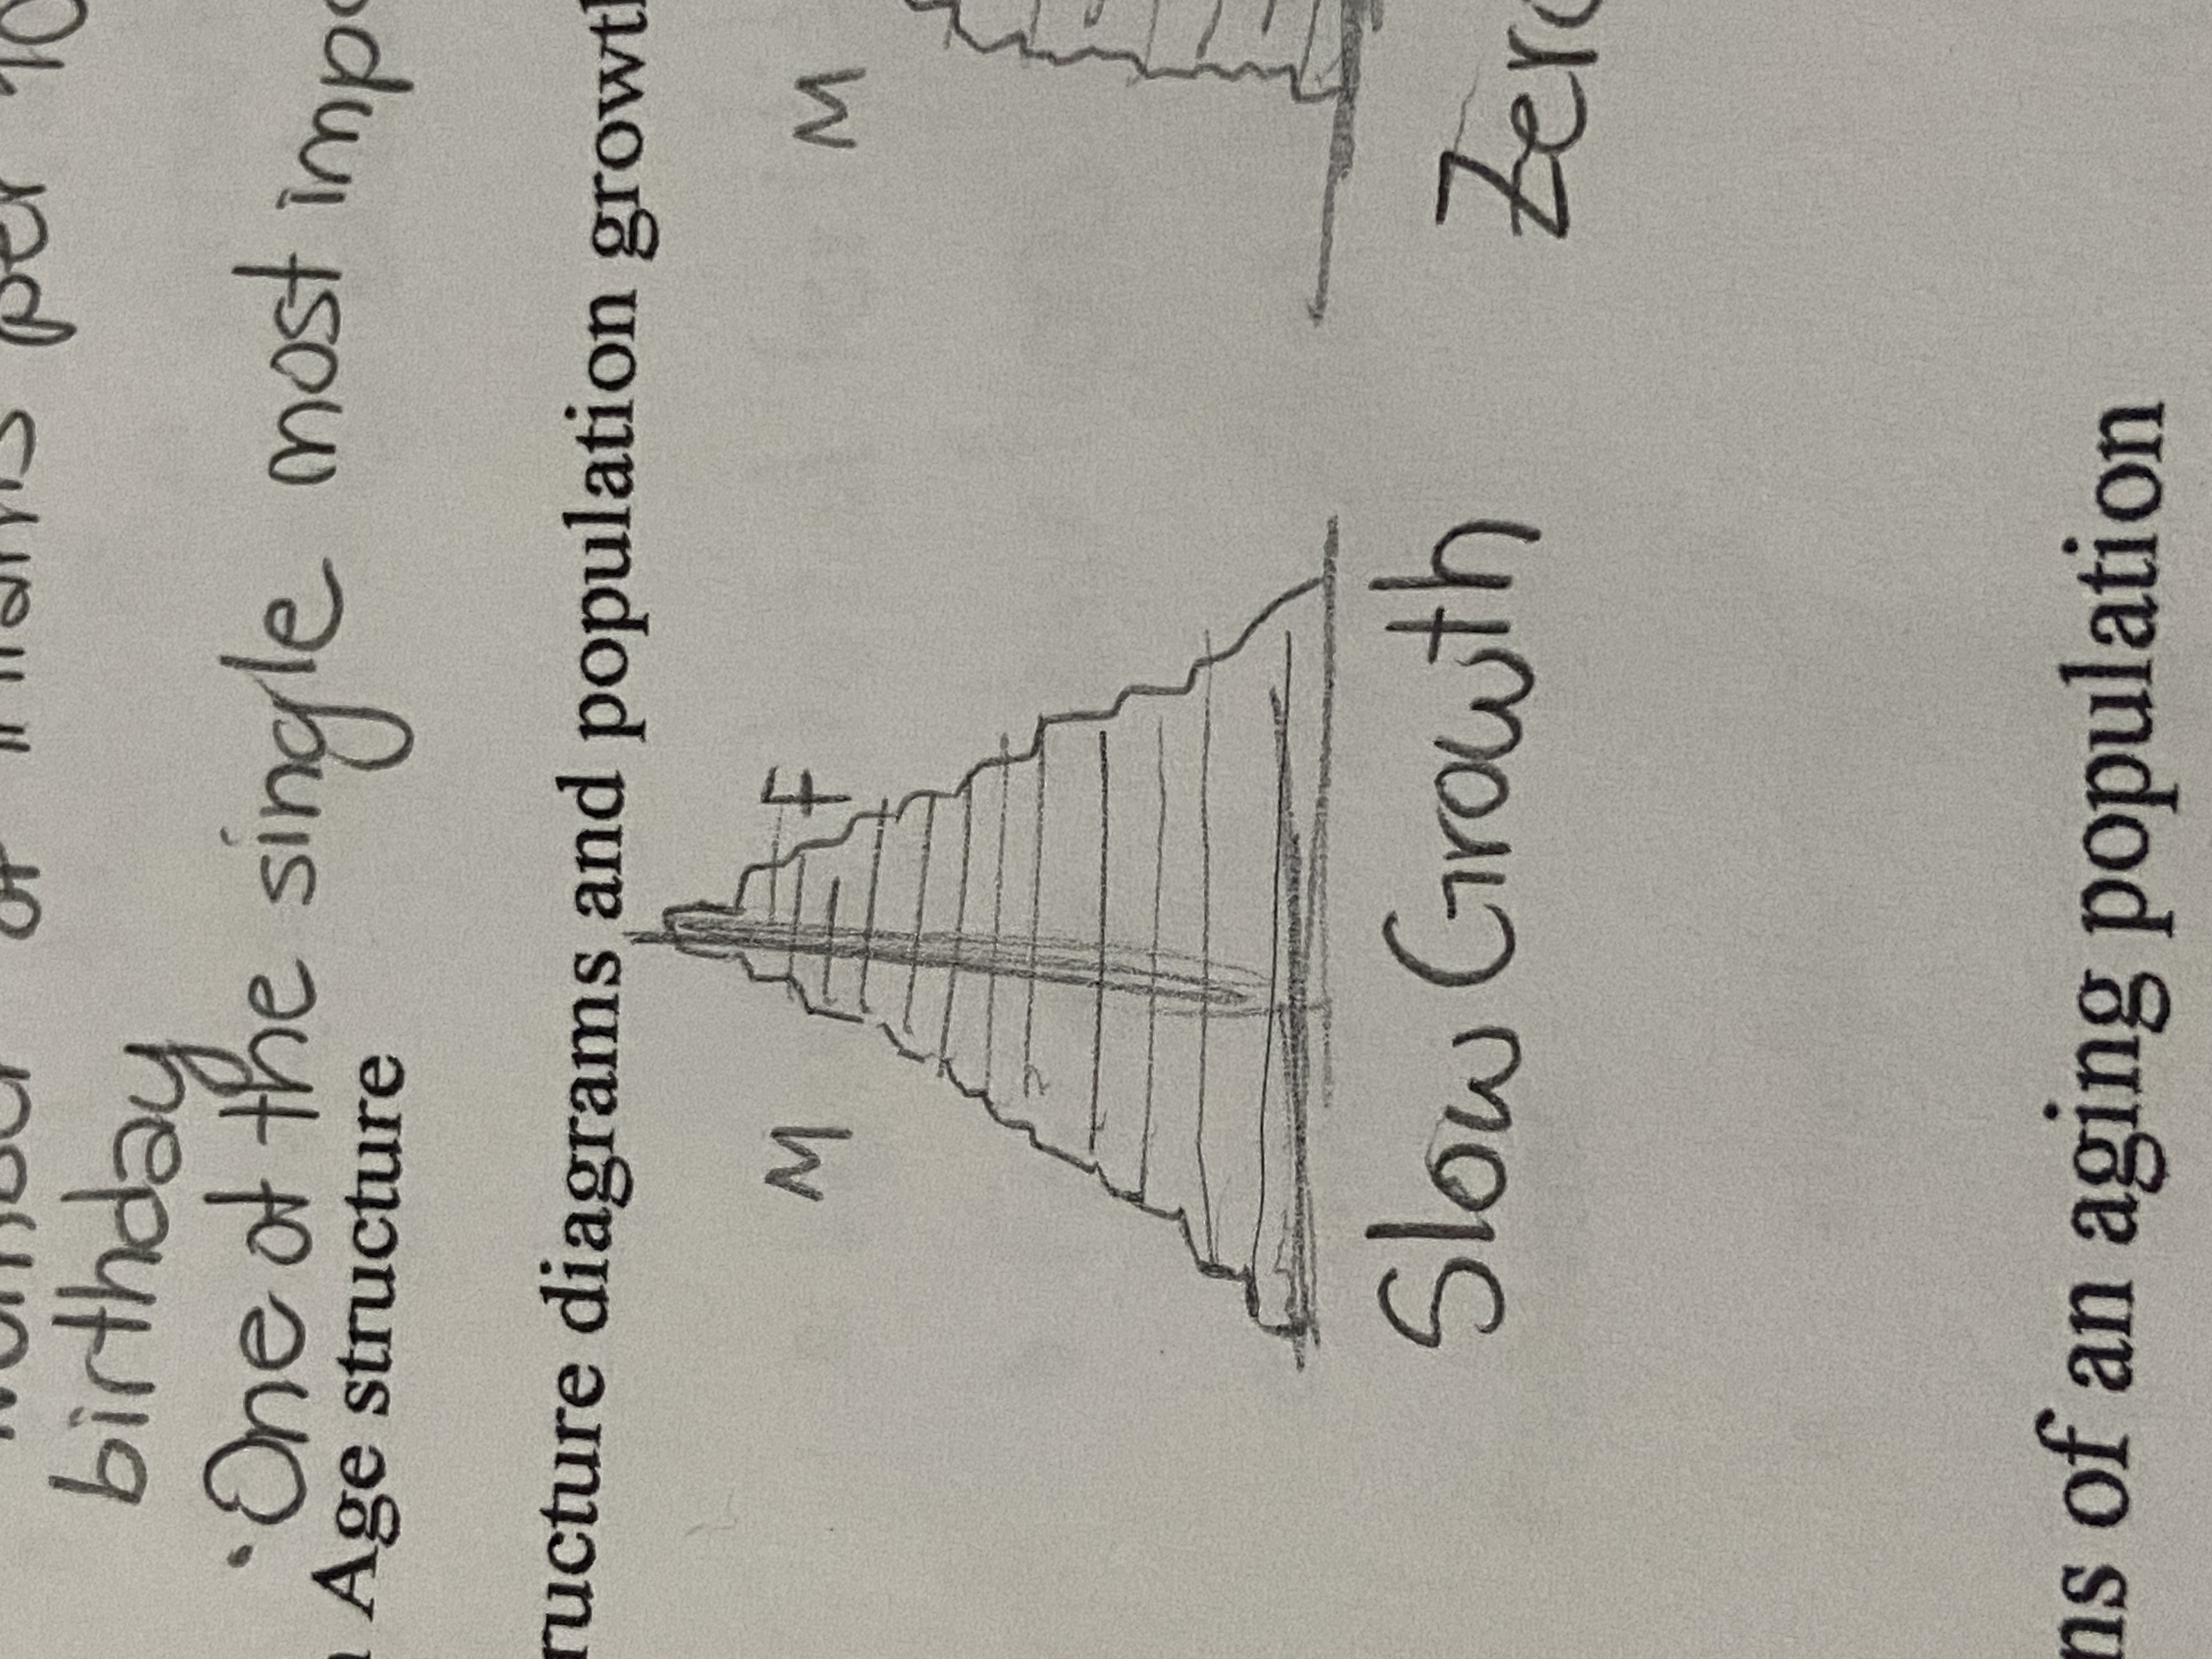
Slow Growth
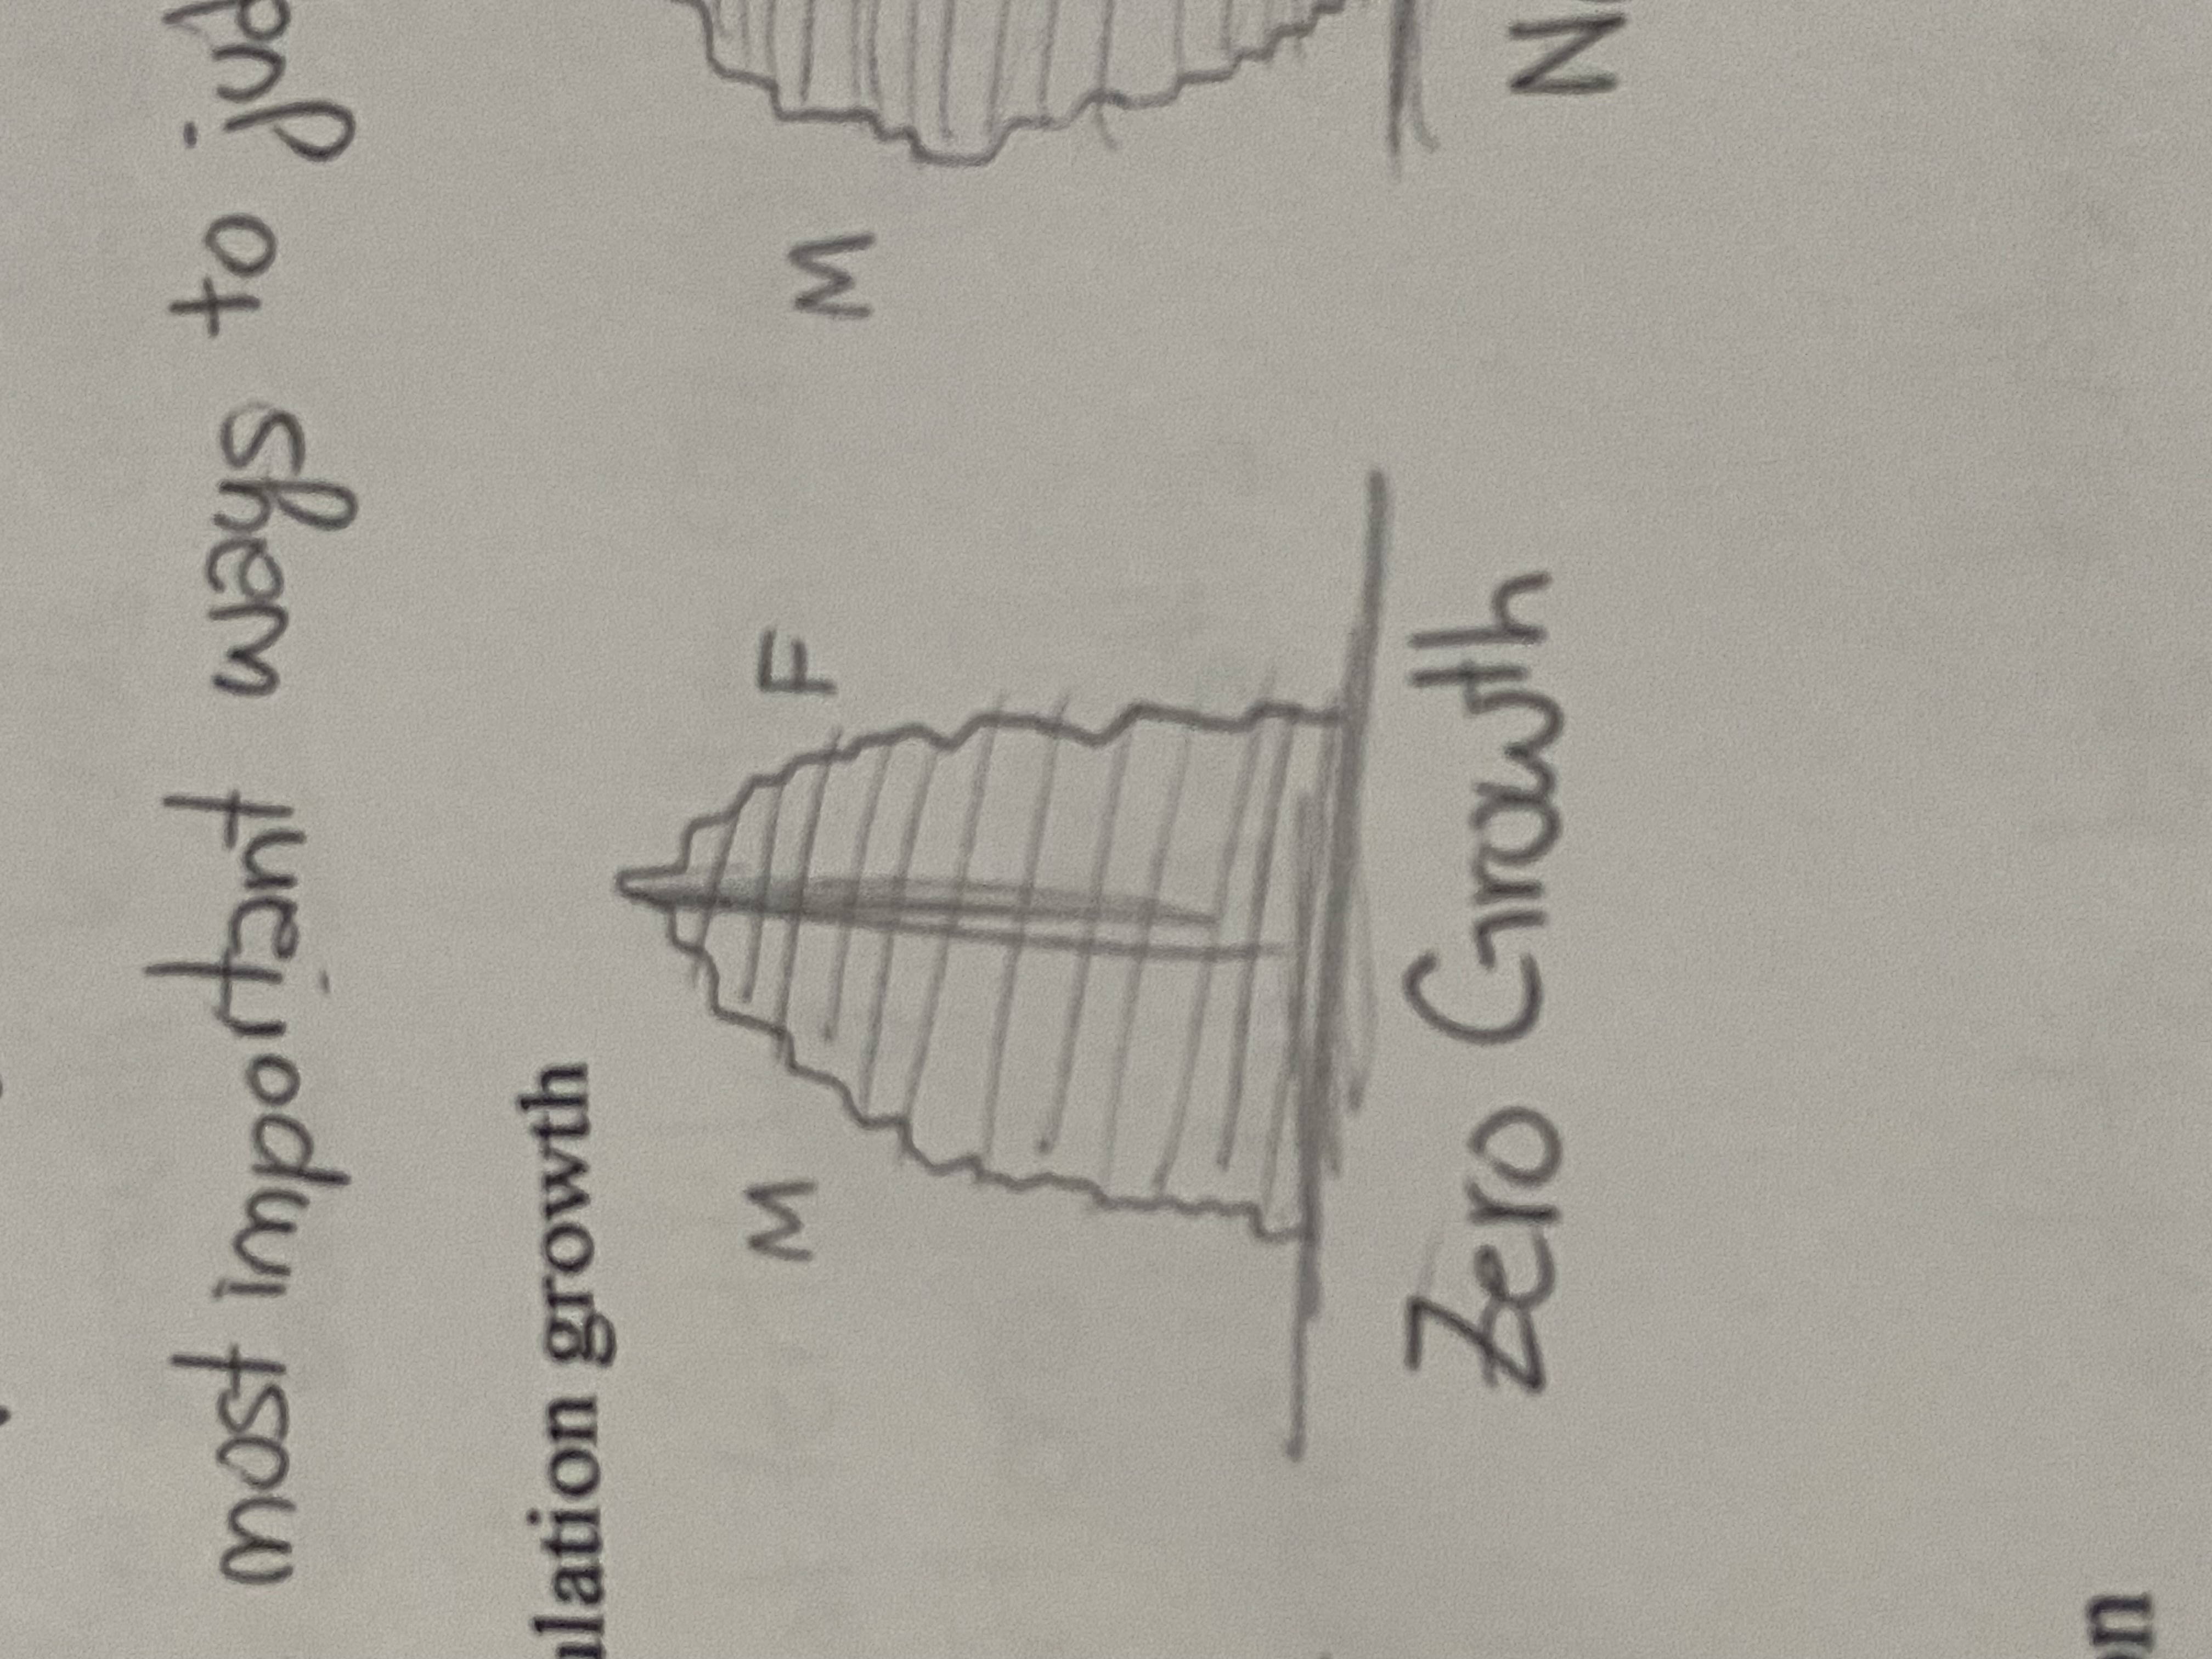
Zero Growth
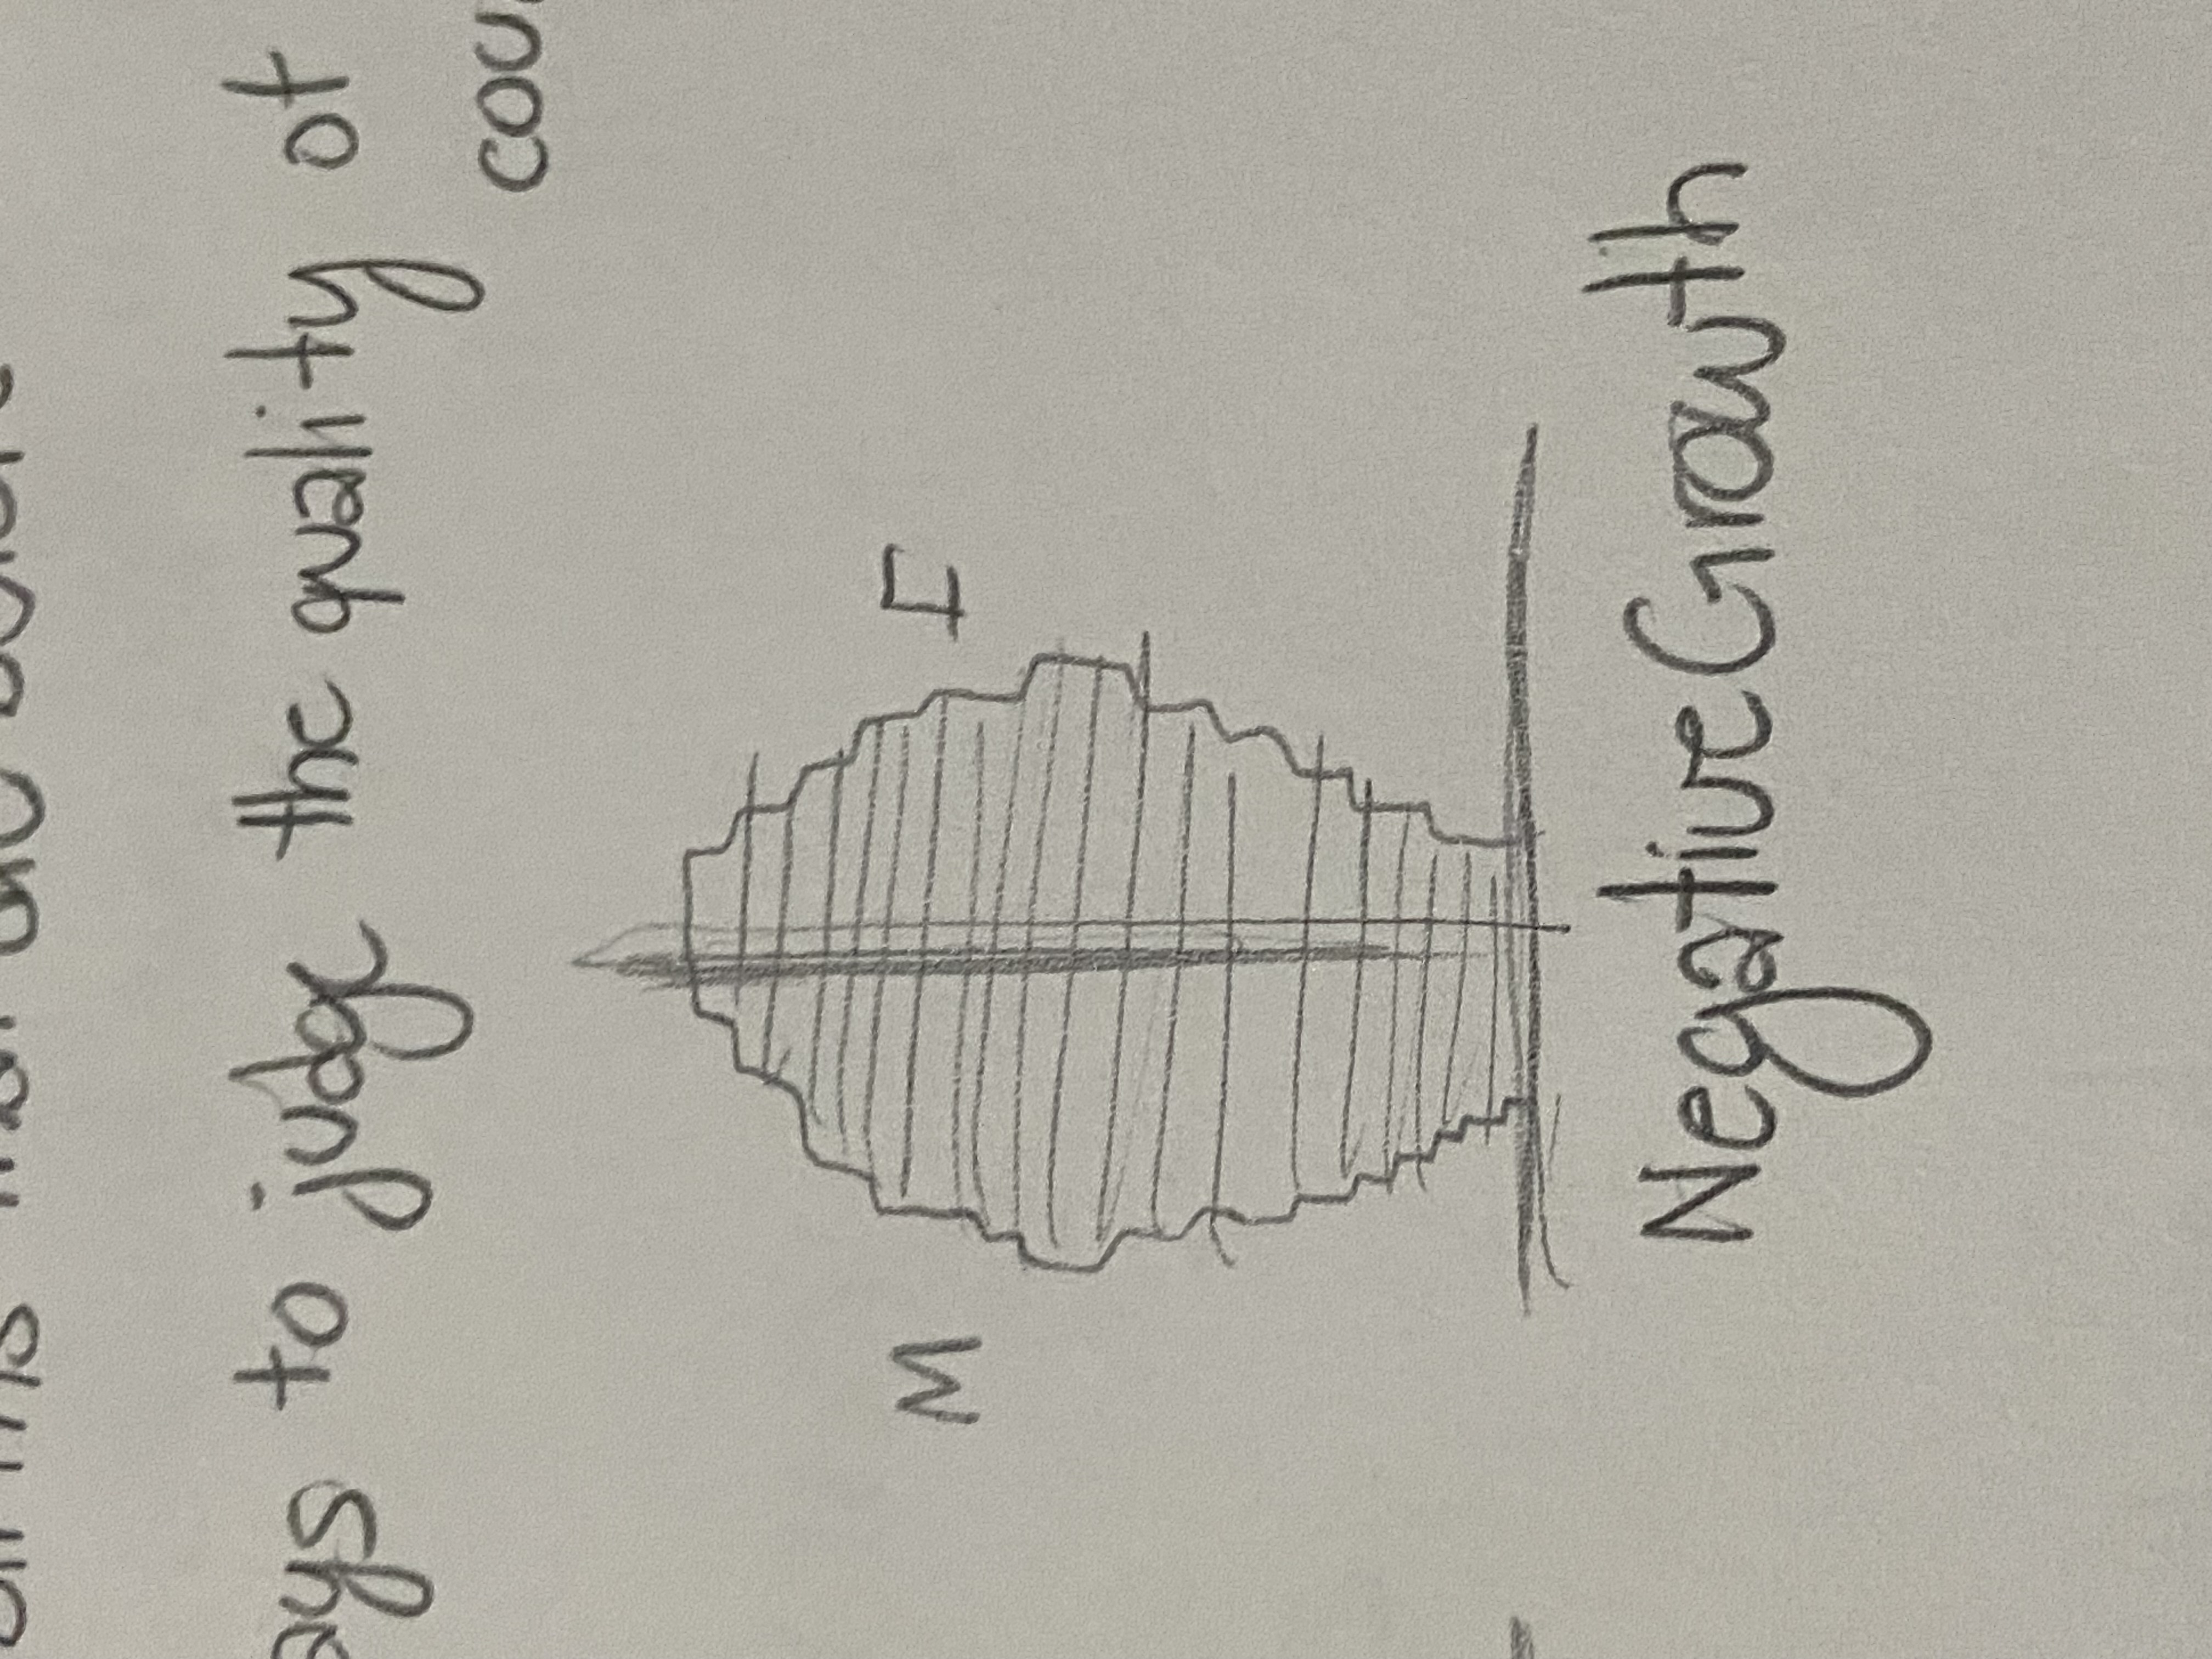
Negative Growth
Implications of an aging population
Fewer young people are burdened with supporting a growing number of older people
Cons of reducing births
•Freedom of choice
•We need MORE people
Pros of reducing births
•World already fails to meet everyone’s basic needs
•Technology cannot keep up
•Climate change
Demographic transition
•Preindustrial — Slow pop growth due to high DR and IMR
•Transitional — Rapid pop growth due to high BR but lower DR due to better health care, food production
•Industrial — Pop growth slows down with increasing quality of food production, health care, and education
Family Planning leads to
•Lower total fertility rates (TFR)
•Fewer abortions
•Lower maternal/fetal deaths
Family Planning problems
•Availability
•Men do not want to be bothered
•Prolifers vs prochoicers
Three things lead women to have fewer children/slow down population growth
•Education
•Employment
•Respect to women’s rights