5.1-5.2 Financial Ratio Analysis
1/39
There's no tags or description
Looks like no tags are added yet.
Name | Mastery | Learn | Test | Matching | Spaced | Call with Kai |
|---|
No analytics yet
Send a link to your students to track their progress
40 Terms
3 Investment Decision Making Factors
Economy-Wide Factors: Often the overall health of the economy has a direct impact on the performance of an individual company. Investors should consider data such as the unemployment rate, general inflation rate, and changes interest rates
Industry Factors: certain events can have a major impact on each company within an industry but only a minor impact on other companies outside the library
Individual Company Factors: to proper analyze a company, good analysts do not rely solely on the information reported in a company’s financial statements and other reports. They visit the company, buy its products, and read about it in the business press
2 Fundamental Business Strategies
Product differentiation: under this strategy, companies offer products with unique benefits, such as high quality or unusual styles or features. These unique benefits allow a company to charge higher prices. In general, a product differentiation strategy results in higher profit margins but lower inventory turnover
Cost differentiation: under this strategy, companies attempt to operate more efficiently than their competitors, which permits them to offer lower prices to attract customers. In general, a cost differentiation strategy results in lower profits margins but higher inventory turnover
2 General Method for Financial Statement Comparison
Time-Series Analysis: information on a single company is compared over time. For example, a key measure of performance for most retail companies is the change in sales at existing stores, which often is referred to as “comparable store sales“
Cross-Sectional Analysis: information for multiple companies is compared at a point in time. By comparing a company with other companies in the same line of business, an analyst can gain better insight into its performance
Component Percentages
express each item on a particular financial statement as a percentage of a single base amount.
Income Statement Base Value: Net Sales
Balance Sheet Base Value: Total Assets
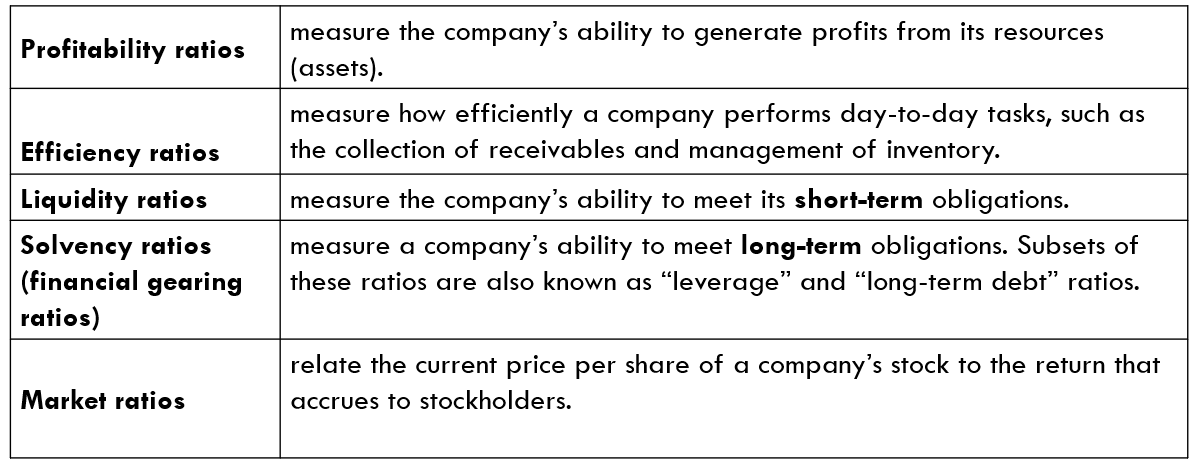
Categories of Financial Ratios
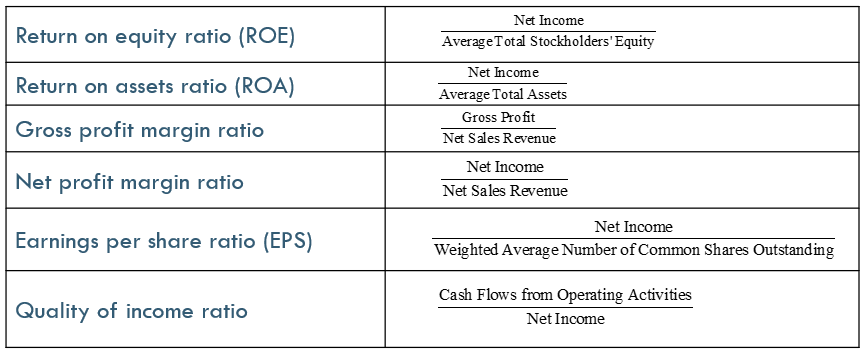
Types of Profitability Ratios
Purpose of Profitability Ratios
Profitability ratios focus on net income and how it compares to other amounts reported on the financial statements. Measures the company’s ability to generate profits from its resources (assets)
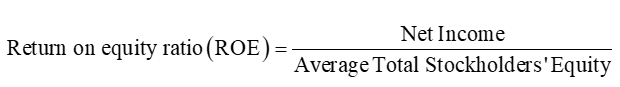
Return on Equity Ratio (ROE)
relates income earned to the investment made by the owners. Investors expect to earn a return on the money they invest
it measures how much profit a company generates using owner’s capital (equity), that is how much profit a firm can make for its shareholders
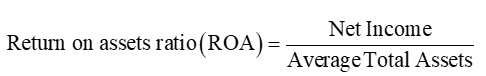
Return on Assets (ROA)
compares income to the total assets used to generate the income
it measures how much profit a company generates using its total assets, essentially measuring allocative efficiency
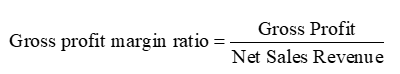
Gross Profit Margin Ratio
this ratio reflects gross profits as a percent of sales
it measures the profitability purely in buying and selling goods before any other expenses are taken into account
Higher gross profit margin indicate either high pricing power or lower product cost
Operating Profit Margin
measures how well the business has converted sales revenue into operating profit
can vary considerably between types of business, but a higher margin shows good ability to control operating costs
when analyzing the margin one should consider different pricing & marketing strategies, whether the the products are premium and what the external environment looks like

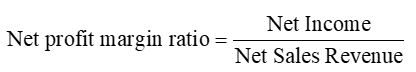
Net Profit Margin Ratio
this ratio reflects net income as a percentage of sales and is used as a measure of operating efficiency
Earnings per Share Ratio (EPS)
a measure of return on investment that is based on the number of common shares understanding

Quality of Income Ratio
compares net income to cash flows from operating activities
a ratio higher than 1 indicates high-quality income because each dollar of income is supported by one or more dollars of cash flows

Types of Efficiency Ratios (Assets Turnover Ratios)
Purpose of Efficiency Ratios (Assets Turnover Ratios)
measures how efficiently a company performs day-to-day tasks, such as the collection of receivables and management of inventory. It focuses on capturing how efficiently a company uses its assets.
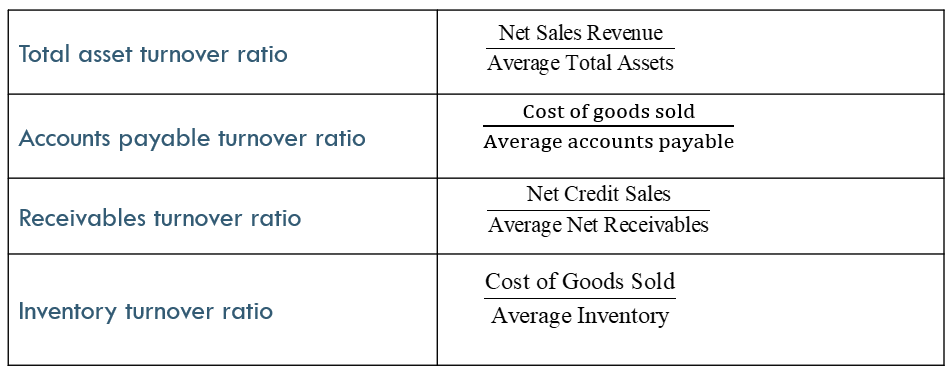
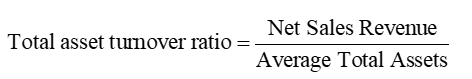
Total Asset Turnover Ratio
captures how well a company uses its assets to generate revenue
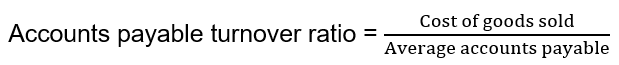
Accounts Payable Turnover Ratio
measures how fast a company needs to make payments to suppliers
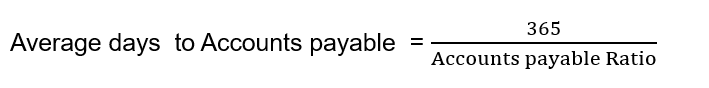
Accounts Payable Turnover Ratio Converted to Days
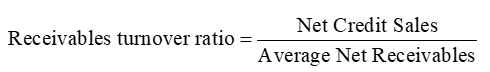
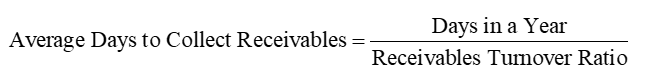
Receivables Turnover Ratio
measures a company’s ability to generate sales given an investment in fixed assets
a high receivable turnover ratio suggest that a company collects its accounts receivable many times during a year
Receivables Turnover Ratio Converted to Days
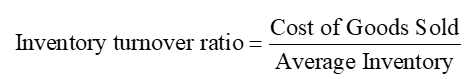
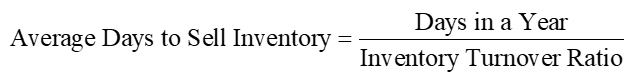
Inventory Turnover Ratio
measures how quickly the company sells its inventory
Inventory Turnover Ratio Converted to Days
Types of Liquidity Ratios
Purpose of Liquidity Ratios
Liquidity Ratios measures a company’s ability to meet its short-term obligations
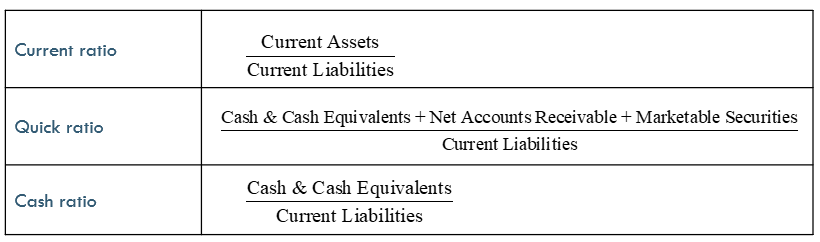
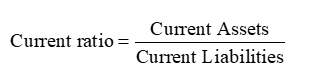
Current Ratio
measures the ability of the company to pay current debts as they become due
a high ratio (close to 2) usually indicates higher liquidity. But too high may signify less efficient use of current assets
Quick Ratio
a more stringent test of short-term liquidity than the current ratio. It measures whether the highly liquid assets of a company, those that can be converted to cash quickly, are sufficient to cover current liabilities

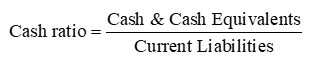
Cash Ratio
measures the adequacy of available cash
however, holding too much cash also means the company is not investing the cash into productive assets that will grow the business
Types of Solvency Ratios (Financial Gearing Ratios)
Purpose of Solvency Ratios (Financial Gearing Ratios)
Solvency ratios measure a company’s ability to meet its long-term obligations
Financial Gearing: the extent to which the firm is funded by lenders’ capital (debt) versus owners’ capital (equity)
A higher level of debt may increase the default risk (financial risk) and results in higher borrowing costs, which is also associated with higher credit risk
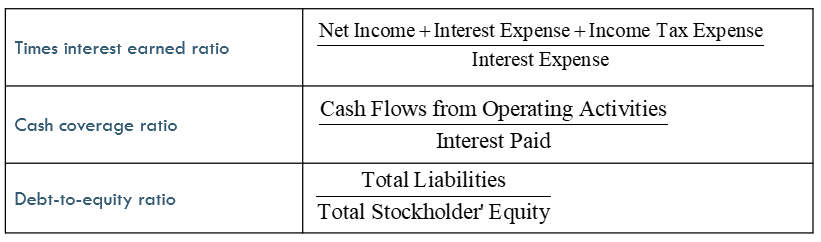
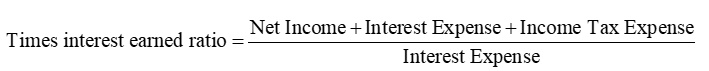
Times Interest Earned Ratio
compares the income available to pay interest in a period to a company’s interest obligations for the same period
indicates a margin of protection for creditors. A high ratio indicates a secure position for creditors
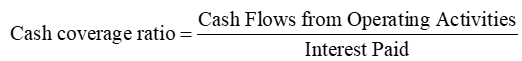
Cash Coverage Ratio
compares the cash from operations to the cash needed to make required interest payments
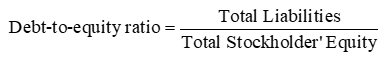
Debt-to-Equity Ratio
expresses a company’s debt as a proportion of its stockholders’ equity
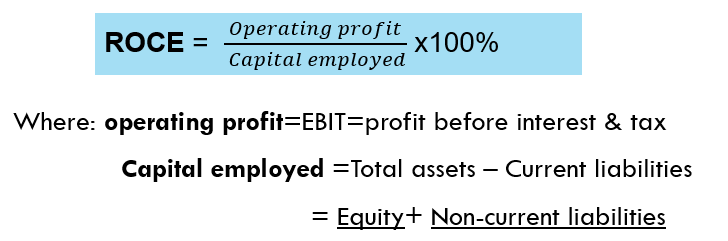
Return on Capital Employed (ROCE)
Capital Employed usually means long-term funds so it includes both equity and non-current liabilities
ROCE measures how efficiently a business uses its long-term capital to generate profits
it measures how much operating profit is earned per £1 invested
Types of Investment (Market) Ratios
Purpose of Investment (Market) Ratios
Market ratios relate the current price per share of a company’s stock to the return that accrues to stockholders. Analysts find these ratios helpful because they are based on the current value of owner’s investment in a company
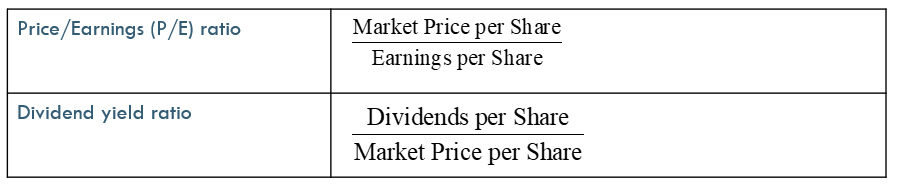
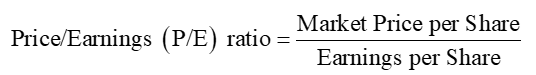
Price/Earnings (P/E) Ratio
measures the relationship between the current market price of a company’s stock and its earnings per share
A high ratio indicates that earnings are expected to grow rapidly
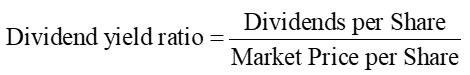
Dividend Yield Ratio
reflects return on investment solely due to the dividends a company pays
investors are willing to accept low dividend yields if they expect that the price of a stock will increase while they own it
stocks with low growth potential tend to offer much higher dividend yields than do stocks with higher growth potential. Mature companies are more likely to pay higher dividend
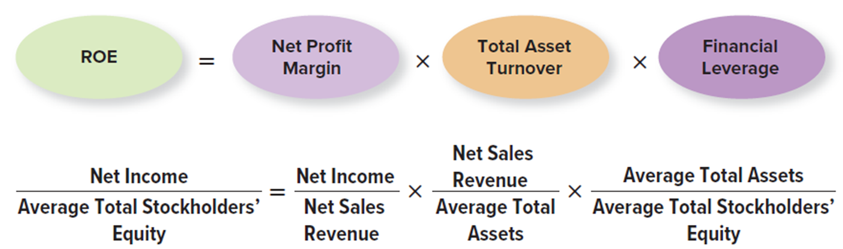
ROA Profit Driver Analysis
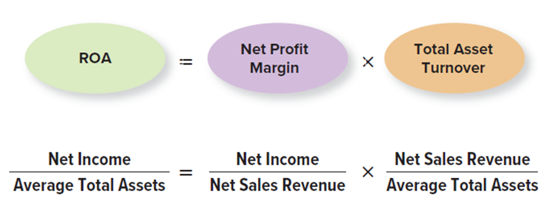
The DuPont Model
used by analysts to better asses how a company is implementing its business strategy. The model is broken down into three components