HASS Semester 2 Exam Y10
1/98
Earn XP
Description and Tags
this is probably best for writing notes with ngl
Name | Mastery | Learn | Test | Matching | Spaced |
|---|
No study sessions yet.
99 Terms
Circular Flow of Income Diagram
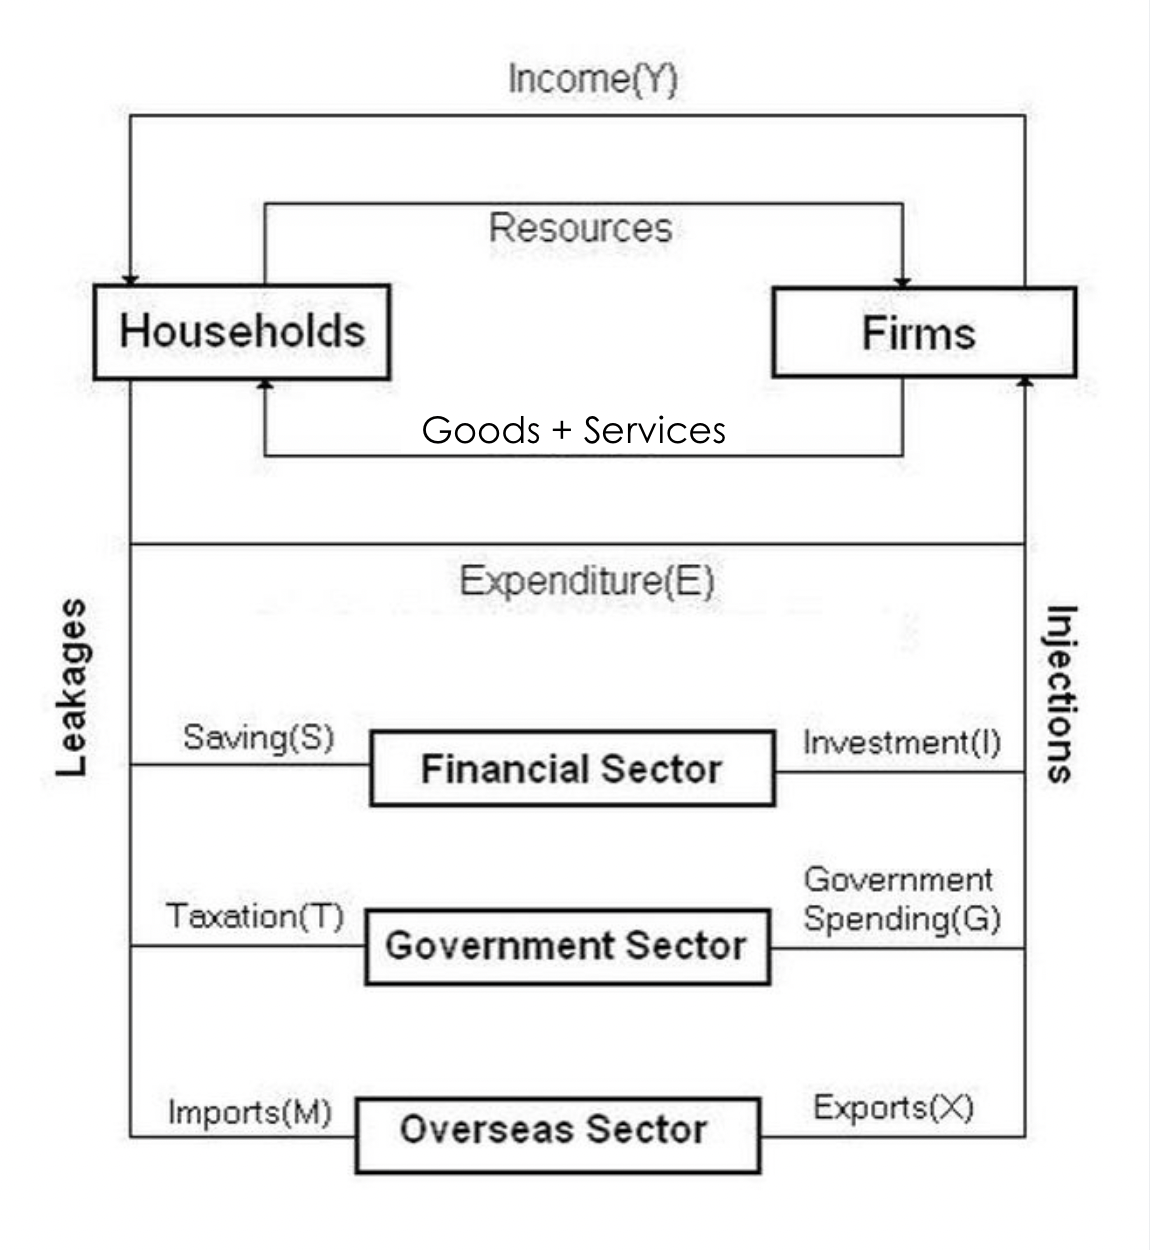
Role and Relationships for Households
They have the role of owning the four factors of production (land, labour, capital, enterprise), and exchanging them for income
Their relationship with the firm sector is that they spend money on goods and services to create demand in the economy
Role and Relationships for Firms
They have the role of using the factors of production (land, labour, capital, enterprise) provided by the household sector to create goods and services.
Their relationship with others is that they pay incomes to households and receive revenue when households (+ other sectors) purchase goods and services
Role and Relationship of the Financial Sector
They have the role of facilitating savings (of the household sector), and making investments (for the firm sector)
Their relationship with others is that they channel funds from savers to borrowers to fund consumption, investment, and production
Role and Relationships of the Government Sector
They have the role of collecting taxes from households and firms, and use this revenue to provide public goods and services (healthcare, education, etc.)
Their relationship with others is that they redistribute income, and influence economic activity through policies (social welfare, public investment)
Role and Relationship of Overseas Sector
They have the role of representing the goods and services being exported to/imported from other countries.
Their relationship with others is that they affect the domestic economy through exports (which inject money into the econ.) and imports (which leak money out of the econ.)
Income
A regular flow of money, which may include wages, salaries, rent, interest, etc.
Wealth
The accumulation of the value of all assets, including property, savings, etc.
Types of Commonwealth Taxes
Income Tax
GST (goods and service tax)
Company tax
Income Tax
The tax placed on the yearly income of a worker, and in Australia is a percentage that increases as a person makes more money
How to Calculate Income Tax
If your income is bigger than the highest number in the bracket:
(highest number in bracket - lower number in bracket) x tax rate, then continue until income is between the smallest and biggest number in the bracket, then:
(income - smallest number in bracket) x tax rate
once this is done, add all together to find final tax
GST
Goods and service tax, the tax of 10% added onto the price of most goods and services.
Can be calculated by dividing the price of a good/service by 11, or can be added onto a base price by multiplying it by 1.1
Company Tax
A tax placed on the profits made by a company
Producer
One who provides goods and/or services to consumers
Consumer
One who consumes goods and services purchased from producers
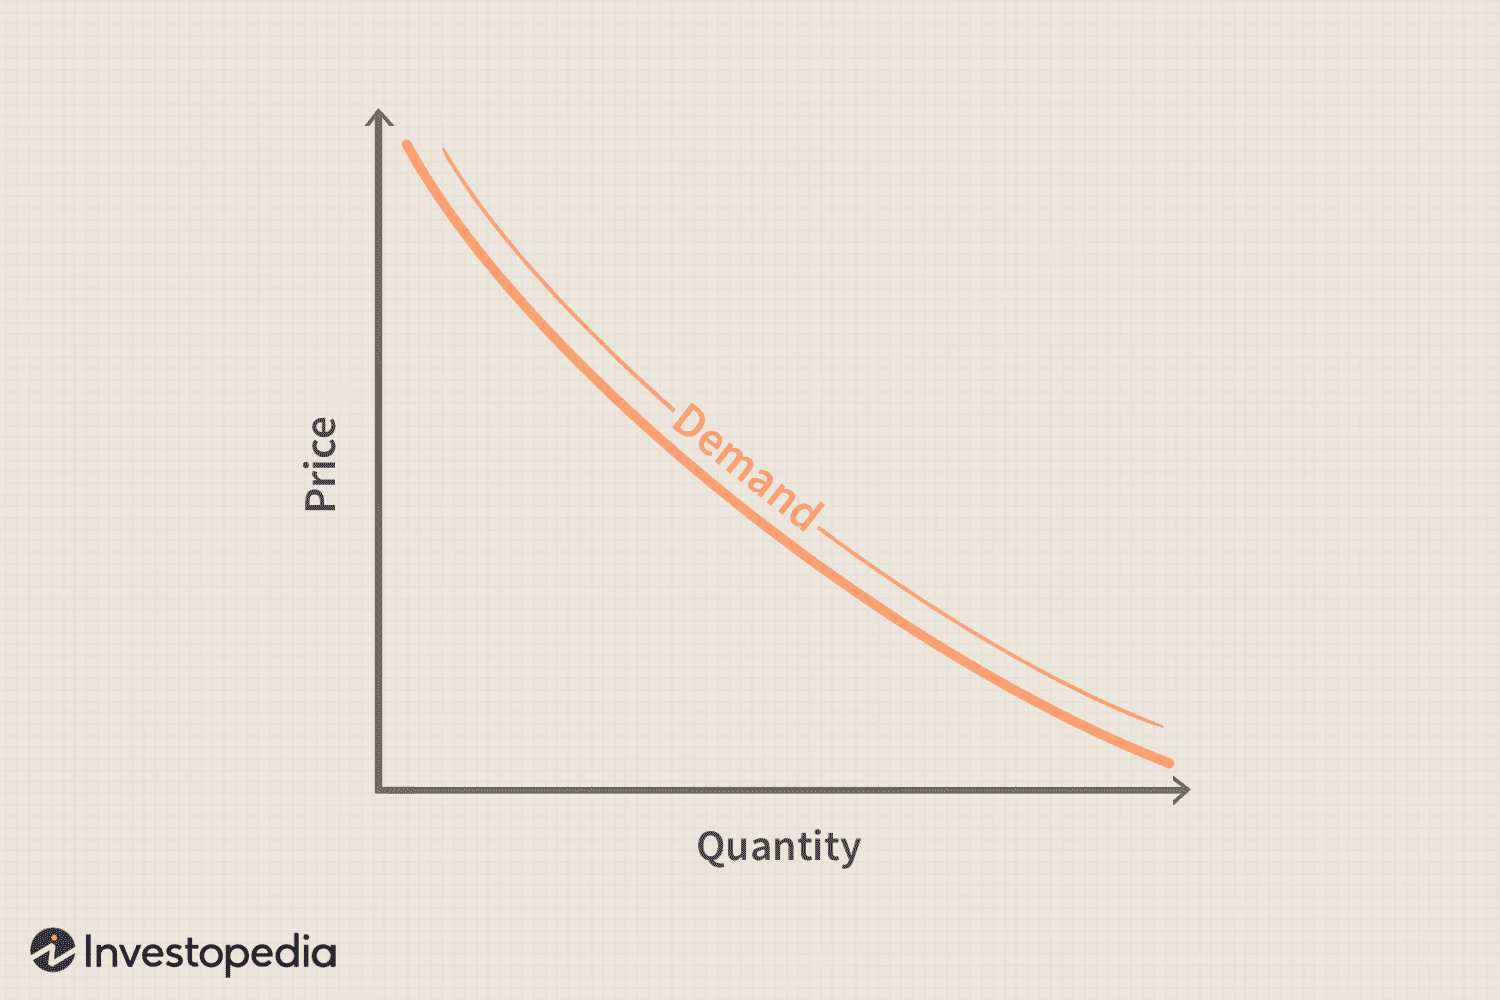
Law of Demand
If everything stays the same, when the price of a product rises, the demand of a product falls. If the price falls, demand rises. Occurs as the lower the price is, consumers believe they are getting more value for a product or can actually afford it
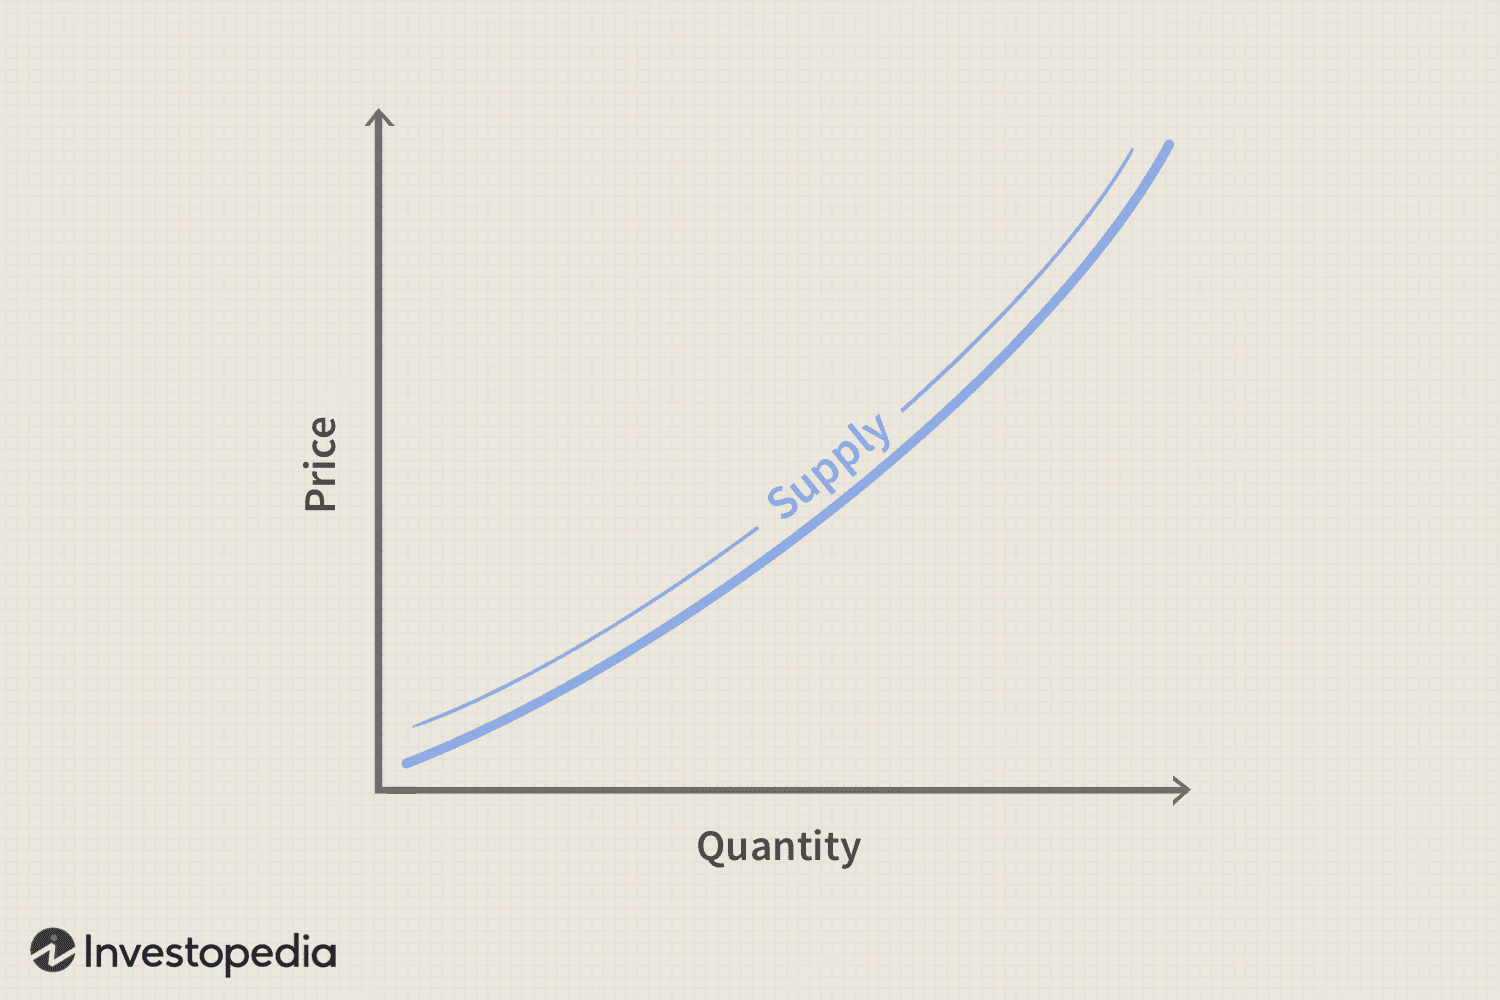
Law of Supply
If everything stays the same, when the price of a product rise, the supply of a product rises. If the price falls, supply falls. Occurs as suppliers become more willing to supply products if they make more money
Equilibrium
The point where supply and demand are equal, where the two graphs intersect
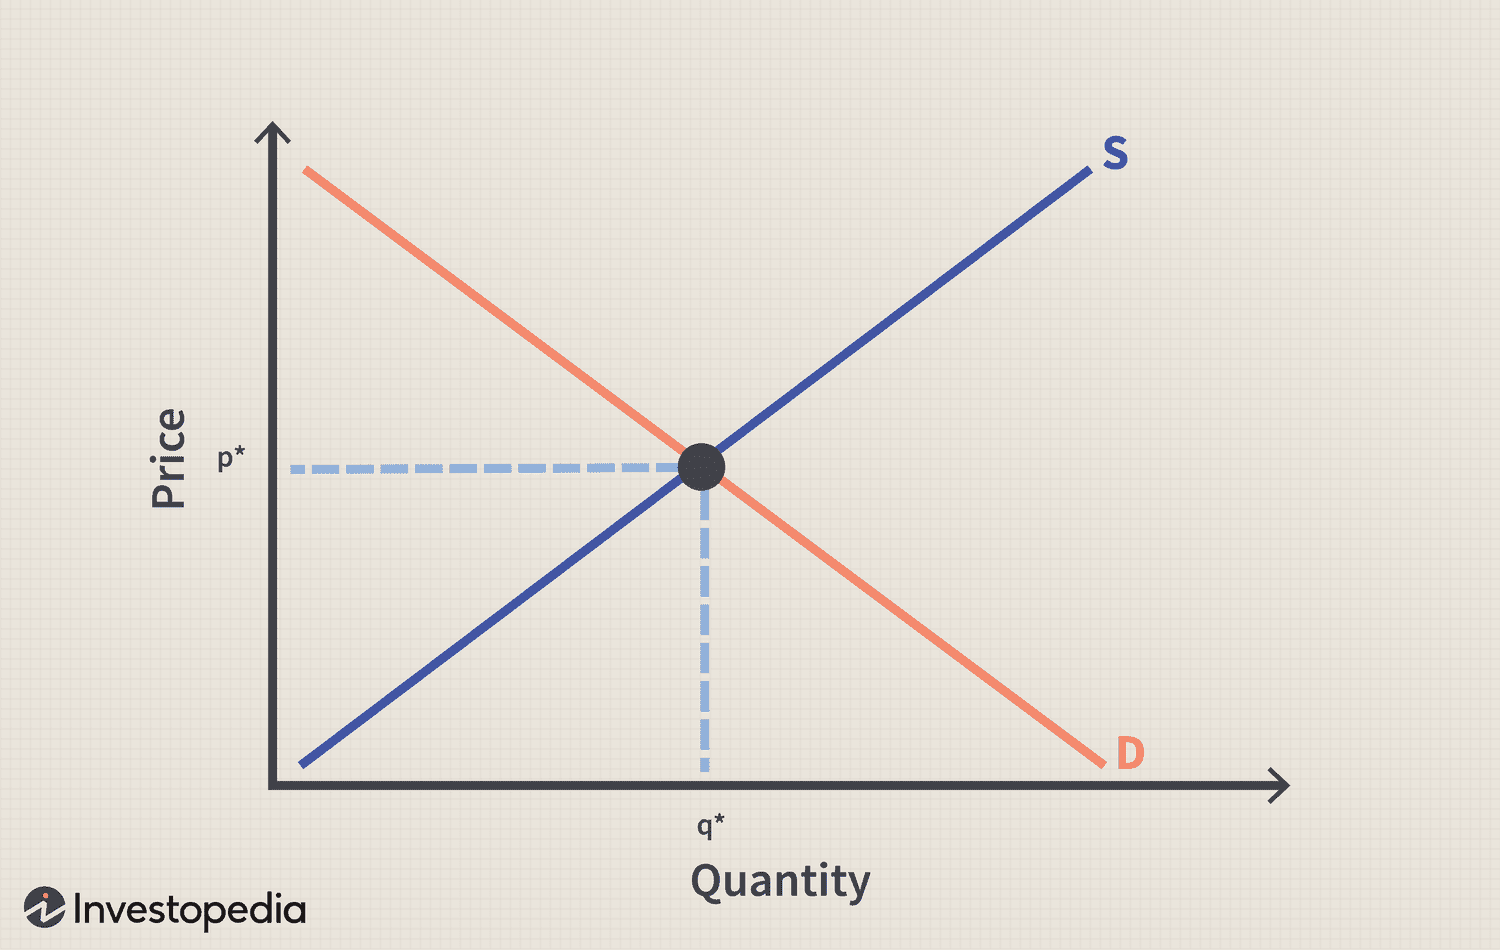
Surplus
The points where the supply of a product surpasses it’s demand, meaning that there is not enough demand for a product to match it’s stock (the space above the equilibrium)
Shortage
The points when the demand of a product exceeds it’s supply, meaning that there is too little stock to match the demand for a product (the space below the equilibrium)
Factors that may influence a consumer’s decision to buy
Price (too low could make consumer suspicious, too high could make someone think it’s premium)
Availability of credit (how easy it is to borrow money)
Marketing (how well a product is marketed to the consumer)
Age + Gender (products may be marketed to specific age groups or genders)
Convenience (items that save time may be liked more)
Ethical and Environmental Considerations (items that are bad for environment or workers may be liked less)
Labour Productivity
The amount of goods and services a worker/workers produce in a given amount of time
Capital Productivity
The amount of goods and services that can be produced using a fixed amount of capital in a given amount of time
Ways Capital Productivity can be Increased
Improving tech (using most advanced equipment to save time and cost)
Improving processes (improving production to be more efficient and taking less time, though still being effective. At best, these should organise time, resources, and storage to lower costs)
Ways Labour Productivity can be Increased
Improved Management Practices
Training
Workplace Culture and Flexibility
Appraisal and Feedback
Incentives
Improved Management Practices
A method of improving labour productivity, by making sure managers have the right attributes to lead. Managers should know much about the business, be able to relate well with their employees, and be positive and effective leaders
Training
A method of improving labour productivity, in which new employees effectively have their skills and knowledge developed. Generally involves educational training in things like schools, and extra training at the workplace
Workplace Culture and Flexibility
A method of improving of labour productivity, where the culture of the workplace should be positive, giving the employees stronger work ethics. Having flexible hours and work locations can improve work ethic as well
Appraisal and Feedback
A method of improving work productivity, in which positive and constructive feedback is given to workers. This results higher productivity in workers. This can be done regularly, or in a more formal way through appraisals
Incentives
A method of increasing labour productivity, where something is used to encourage worker productivity, like extra money, holidays/paid leave, shares, etc.
Productivity
The measure of what can be produced (output) with a given amount of resources (input)
Economic Growth
The increasing ability of a nation to satisfy the needs and wants of its people over time, which reflects the size and health of the economy. Is best when at 3-4% per year
How Economic Growth is Measured
Can be measured through analysing the GDP (and it’s changes over time) in a country
GDP
Stands for Gross Domestic Product, and is the value of all of the goods and services produced in a country in a given period of time
Benefits of Economic Growth
Level of Income: Higher growth usually means higher income
Consumption: Increased growth usually means more spending/buying
Ability to Satisfy Needs and Wants: Increased growth usually means better living standards and overall well being, plus having more money to spend on products
Quality of Life: income levels increase the quality of day-to-day products
Living Standards: By being able to satisfy needs and wants, quality of life is enhanced
Costs of Economic Growth
If too high, can have:
Inflationary pressures: high inflation can occur, due to higher demand than supply, lowering value of money
Resource Depletion and Environmental Damage: natural resources can be overused with rapid growth, causing damage to biodiversity and the environment, + pollution
Increased Inequality: economic growth may be focused on one group, not on all of society, increasing inequality between the two groups
Strain on Infrastructure and Institutions: the capacity of infrastructure (houses, roads, etc.), and institutions (legal and regulatory frameworks, etc.) can struggle, causing inefficiencies, shortages, and systemic breakdowns
Inflation
The general increase of the prices of goods and services over a certain period of time
How Inflation is Measured
By calculating the Consumer Price Index (CPI), created by surveying the price of many goods/services across Australia and weighting the goods/services based on how often they are bought (e.g., milk vs buses). Then, this formula is used:
CPI (year 2) - CPI (year 1), which is then divided by CPI (year 1)
Effects of Inflation
Output Effects (Effects on the output of products)
Redistribution Effects (Effects on different groups of society)
Output Effects
Inflation diminishes potential output, where uncertainty over price can cause businesses to focus resources more on speculative activities than productive ones
Prices rises reduce purchasing power, where the rise of income may not keep up with inflation
Uncertainty, where investments become riskier as costs are unpredictable, meaning profits are unpredictable
Capital for Labour Substitution, where workers may be replaced by machinery as wages increase
International Competitiveness, where inflation results in competition between exporters as different countries face different levels of inflation
Redistribution Effects
Where inflation effects different groups differently, including:
Workers, and Welfare Recipients, who may lose as the increases to money they make may not match inflation, meaning they have decreased purchasing power
Savers, who would lose as the value of the money they are saving is decreasing
Borrowers, who would win as the value of the money they owe is decreasing
Lenders, who may lose as they receive the owed money back at a decreased value, unless the interest is equal to/over the rate of inflation
Unemployment
The issue where people able to and willing to have an occupation, lose their job and/or are unable to find one
How Unemployment Rate is Measured
Number of Unemployed People / Labour Force
Labour Force
The total number of all people who are able to and are willing to have a job. Is calculated by adding the number of unemployed people and the number of employed people
Who Counts as Unemployed
People 15 or above without a job, though are able and willing to work
Participation Rate
The proportion of the population in the labour force. Is calculated by: (Labour force) / (Population 15 or over)
Types of Unemployment
Structural Unemployment, where there are less jobs available than there are people with the skills to do the job (can be caused by advances in technology)
Seasonal Unemployment, where certain jobs are only in demand during certain times of year
Cyclical Unemployment, where unemployment rises and falls with changes in economic activity
Hardcore Unemployment, where a person is unemployed long term due to lack of skills, age, or personal problems
Frictional Unemployment, where a person is unemployed short term and voluntarily as they change jobs
Economic Effects of Unemployment
Deteriorating Living Standards, where unemployment may cause consumers to spend less money, families to face more stress, feelings of personal failure and a loss of skills
Decreased National Production, where resources (including labour) are underused, meaning the GDP will fall lower than it’s potential as there is less production
Changed Government Budget Position, where tax revenue decreases, while welfare spending increases, lowering available money for other sectors
GDP per Capita
The GDP divided by the population, which represents the average standard of living and wealth each person should have. The higher this is, typically the higher standard of living
Business Cycle
The cycle that depicts the rise and fall in the output of goods and services over time
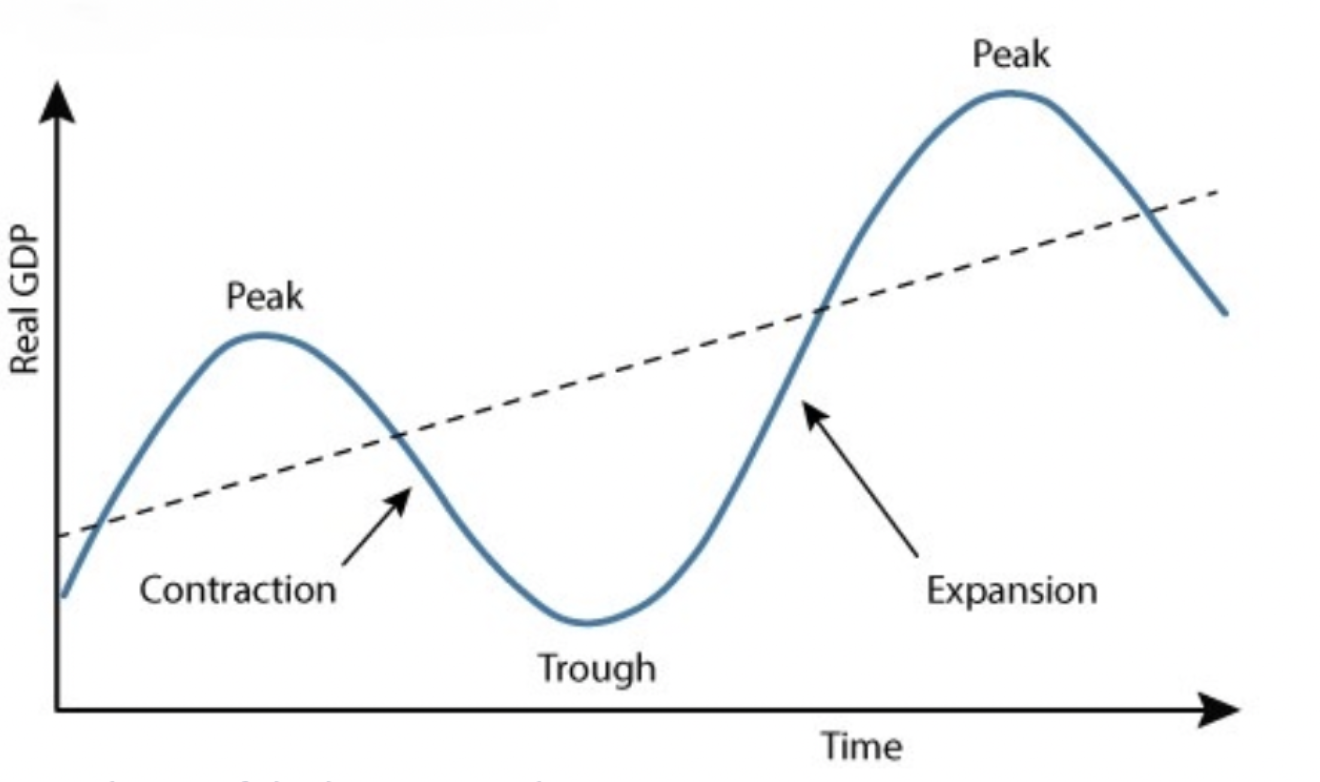
Features of the Business Cycle
Expansion: the phase where GDP is growing, moving toward a peak. This means businesses are expanding, producing more goods, hiring more, and morale is generally higher
Peak: the highest point that comes from expansion
Contraction: the phase where GDP falls and moves toward a trough. This means production goes down, hiring goes down, and morale is generally lower
Trough: the lowest point that comes from a contraction, and is the transition from declining economic activity to expansion
Shifts in Demand
Occur when non-price factors affect the demand of the product, causing the demand graph to shift to the left when it decreases demand, or shift to the right when it increases demand. Occurs as non-price factors change how willing consumers are to buy products at a certain price
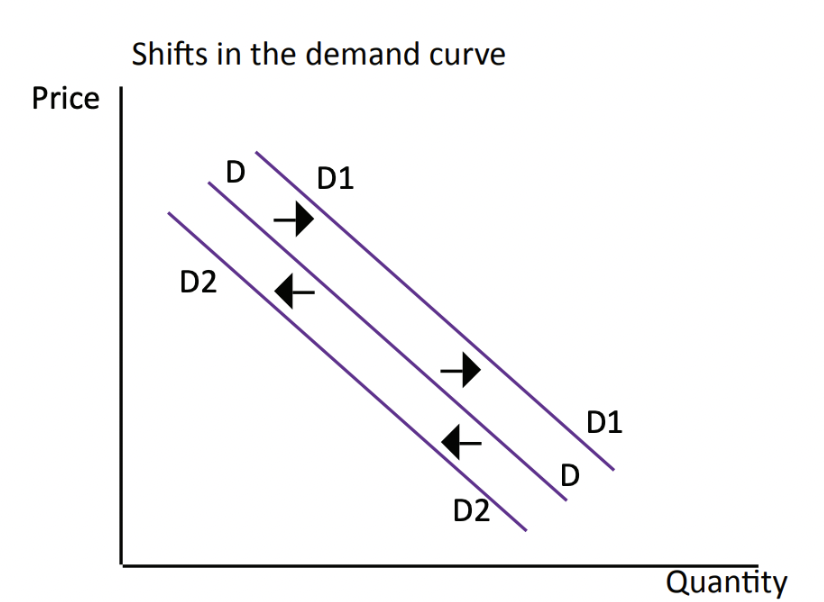
Non-Price Factors for Demand
Changes to disposable income (if people have more money to spend, they become more willing to buy and vise versa)
Changes to peoples tastes and interests (products or hobbies may go in or out of fashion)
Changes to interest rates (the more interest people are charged on credit, the less willing they may be to buy and vise versa)
Advertising/marketing campaigns (good advertisements/positive media increase demand, and vise versa)
Changes to the makeup of the population (e.g., if more of the population are elderly, things like walkers may increase in demand, while nappies may decrease)
Price of related goods (e.g., if light bulbs become more expensive, demand for lamps may decrease. e.g., 2, if price of coffee increases, demand for tea may increase)
Shifts in Supply
Occur when non-price factors affect the supply of the product, causing the supply graph to shift to the left when it decreases the supply of a product, or shift to the right when it increases the supply of a product. Occurs as non-price factors change how willing producers are to stock products at a certain price
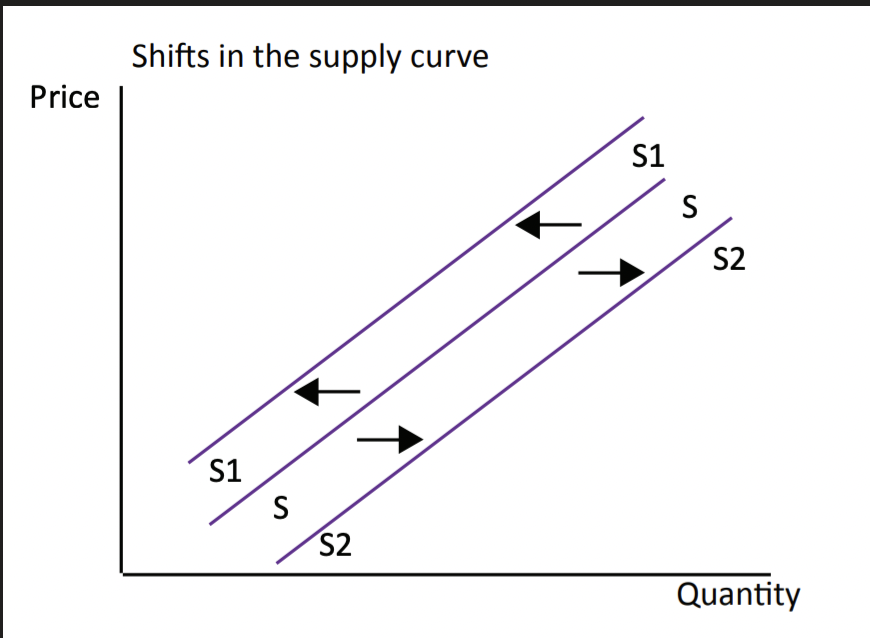
Non-Price Factors for Supply
The price of resources (if the price of resources increase, the price of products may increase, meaning less are produced [and vise versa])
Technology (new/imported technology may make production more efficient, lowering production costs, meaning more are made)
Reduced Legislation (laws and regulations may affect how products are produced, possibly introducing new restrictions that make the process have higher costs)
Weather/Seasonal (the time of year or weather may affect production processes, such as droughts, or good growing seasons for farming, or fishing in winter)
Cost of Production (if the costs involved in making a product increase, less will sold at the same price, and vise versa)
Price of other goods (more profitable goods may have more resources diverted to producing them, increasing their supply, while less profitable ones may be given less resources, meaning less supply)
Expectations of Producers (if producers expect prices to rise, they may hold stock back until it can be sold for more and vise versa)
Areas where the Government spends Taxation Revenue
Health
Social Security/Welfare
School
Aged Care
Environmental Protection
Defense
Macroeconomic Policies that can Impact on Living Standards
Budgetary/Fiscal Policy - the policies placed on the federal budget, increasing or decreasing tax rates and expenditure
Monetary Policy - the policies placed by the RBA that affect money supply and interest rates
Why Income Earners are paid at Different Rates
Education and Skills, where more education and skills often lead to higher paying jobs
Experience, where doing a job for longer may allow you to be paid better
Occupation, where some jobs pay better than others
Industry, where some industries pay better than others
Location, where your geographical location affects your income
Democracy
A system of government where people have the power to determine how they will be governed or managed
Justice
A broad term, that in Australia, refers to how all people should be treated by everyone equally and in a fair + balanced matter
Westminster System
A form of parliamentary government based of the UK’s system, in which parliament has a bicameral system and a sovereign who signs off on laws
Participation
An important concept in democracy, in which everyone should participate in democracy, through voting in elections + referendums, serving on a jury, or paying taxes
Rights and Responsibilities
The entitlements and duties people are granted as citizens of a country
Roles of the Australian Government
ensuring our society is united, safe, and peaceful, done through courts
making laws that reflect the prevailing values and moral standards of the people
ensuring all people have access to basic services and utilities (food, healthcare, internet, etc.)
supporting everyone to have a reasonable standard of living (including unemployed people, or people unable to work)
Key Features of the Australian Government
The Government has various roles to perform in service to citizens
Laws being made through parliaments that perform a variety of tasks (making/changing laws, having discussions, examining issues, reviewing injustices in law)
The Government is based on the federal system
Federal System
The system in which Australia is divided into six states and three territories (ACT, NT, Norfolk Island), which each have their own parliament to make laws, while the nation has it’s own federal parliament
The 1st Principle the Government is Based On
Our government should protect the rights and freedoms of the individuals, while minimising government control and interference. There are also lawmakers that should support us, though should not limit on our basic human rights and freedoms. These laws should be fair, not discriminatory.
The 2nd Principle the Government is Based On
The parliament should make laws that reflect the values, beliefs, and moral standards of the population. The representative democracy has free and fair elections, meaning that if laws are made that goes against our values, beliefs, and moral standards, the candidate risks not being elected again. These laws should reflect those of everyone, not just the voters
The 3rd Principle the Government is Based On
Governments should be able to justify their actions and decisions to voted (AKA being accountable/answerable/a responsible government). One way this is enforced is in parliamentary question time, where the opposition are given the opportunity to debate and question the decisions made by the government. This can also be kept by contacting local MPs to question decisions. If a politician is discovered dishonest or acting irresponsibly, they have the duty to resign
The 4th Principle the Government is Based On
The government should not make laws that are beyond their powers, which is enforced through the separation of powers. This means no one has the power over all three branches, which are the:
executive branch, which has the power to administer laws, headed by the Gov. General and Prime Minister, and includes the government departments.
Legislative Branch, which has the power to make laws, and includes the House of Reps and the Senate.
the Judiciary, which has the power to apply and interpret the law, includes all courts, and determines guiltiness and punishments of suspects
Three Levels of Government
Federal
State
Local
Responsibilities of the Federal Government
Medicare
Defense
Immigration
Foreign Policy
Currency
Responsibilities of the State Government
Public Transport
Primary + Secondary Education
Electricity
Water
Health Services
Responsibilities of the Local Government
Local infrastructure (roads, drainage, waste)
Recreational facilities (libraries, pools, parks)
Aged-care facilities
Childcare facilities
Roles in the House of Reps [don’t know if we need to know]
PM - the leader of the party with majority, sits nexts to speaker
Speaker - An experienced politician responsible for maintaining order in the hearing
Ministers - Politicians allocated to portfolios (specific areas)
Shadow Ministers - Politicians that monitor the ministers
Leader of the Opposition - Leader of the party with the 2nd largest amount of seats
Deputy PM - either the deputy leader of the Labor Party when Labor leads, or the leader of the National Party when Liberal leads
Hansard - Government workers that record the proceedings
Independents - politicians that do to belong to a specific party
Function of the House of Reps
The lower house, which has the role of introducing and discussing on bills, then voting on if they should be passed to Senate. Is meant to represent the needs of the People, and has 151 members for each electorate
Function of the Senate
The upper house, which has the role of reviewing and discussing bills voted on by the House of Reps, and either sending them to the Governor General to be passed, or sending them back to the House of Reps to make changes. Is meant to represent the needs of the States, and has 76 members (12 for each state, 2 for each territory)
Function of the Governor General
Is meant to represent the British Monarch to Australia, and has the power to oversee Prime Ministers, having the ability to dismiss them, and signs off bills in Royal Assent to turn them into laws
Compare and Contrast Australia and Indonesia’s Structure and Levels of Government
Both Australia and Indonesia are representative democracies that have three different levels, led by one figure.
They differ in that Australia is a Constitutional Monarchy which has a PM and headed by a Gov. General, while Indonesia is a Republic, having a president. Australia is also split into federal, state, and local, while Indonesia has national, provincial, and district.
Compare and Contrast Australia and Indonesia’s Separation of Powers
Australia and Indonesia both have a system of separation of powers, in which the power to make, administer, and interpret the law. The power to make is given to parliaments, the power to administer is given to the head of state, and the power to interpret is given to the courts and judges.
They differ though, in that Australia and Indonesia have different levels of parliaments (federal, state, local vs. national, provincial, district), and the president in Indonesia is the executive branch instead of the PM.
Compare and Contrast Indonesia and Australia’s Parliaments
Australian and Indonesian parliaments both are made up of two houses, in which one house creates the laws.
They differ in that Australia’s parliament is bicameral as it has a lower and upper house, a House of Reps and the Senate. Laws must be drafted in the House of Reps, and then must be passed through both houses. Indonesia’s parliament is split between the People’s Representative Council (560 seats) and the Regional Representatives Council (132 seats), and is not bicameral as there is no lower or upper house. The PRC has full power to draft and create laws, and the RRC can only give advice.
Compare and Contrast Australia and Indonesia’s Elections and Voting
Australian and Indonesian elections are similar as they have different elections for candidates trying for different levels of government. They also have different parties trying to fill the houses of parliament.
Australia has state and federal elections on different days once every roughly 3 years, while Indonesia has state and federal elections on the same day every 5 years. As well as this, Australia has two main political parties, while Indonesia has a large mix of big and small political parties, with the PRC changing with each election
Coastal Management
The measures and strategies used by professionals in order to try and control the impact of natural processes and human activities. Is greatly important as it helps mitigate the consequences of human activity, like global warming and erosion
Climate Change Impacts on Coastal Regions
Temperatures Increase
Higher levels of Carbon Dioxide
Changing rainfall patterns
Impact of Temperature Increases on Coastal Regions
Rising of Sea Levels
Saltwater invades into freshwater ecosystems
Increased erosion
Increase of sea surface temperature
More algal blooms
Coral reef bleaching
Marine life dying
Natural Disasters more intense
Melting of Ice caps and Permafrost, exposing coastlines in polar region
Impact of Increasing Levels of CO2
Oceans become more acidic
More marine life dies
Coral bleaching
Impact of Changing Rainfall Patterns
Sediment supply for different ecosystems change
Increased erosion
Changing of environments
Population Growth Impacts on Australian Coasts
Marine Engineering structures harden the coast and change natural processes (erosion, etc.)
Changing the natural flow of water through dams, dredging, etc. alters freshwater levels and sediment, and affects ecosystems and landforms
Sewage and run off of pollutants causes pollution in the ocean
Overfishing in areas with rapid growth
Ports become entry points of invasive species
People can destroy natural environments, through litter, trampling, animal abuse, etc.
Hard Engineering
A form of engineering in coastal management that involves building structures in order to protect coastlines from erosion or waves, making it a more obvious form of management. These are also quite expensive, and often have detrimental impacts on the environment.
Have many examples, such as groynes, gabions, rock armour, offshore breakwater, etc.
Soft Engineering
A form of engineering in coastal management that involves utilising the natural processes of the coast to protect it. It also tends to be more sustainable to the environment and cheaper, though takes longer to get results.
The two main types are sand nourishment and managed retreat
Other Issues that Impact Coasts
Loss of coastal biodiversity - where human activities have starting driving mass extinction, causing key damage on mangroves, seagrass beds, salt marshes, and coral reefs
Marine pollution - where pollutants, including fertilisers, plastic, sewage, etc., and can cause dead zones (areas in the ocean of too little oxygen to support life)
Examples of Coastal Management Engineering
Rock armour
Sea walls
Gabions
Offshore breakwater
Groyne
Beach Nourishment
Managed Retreat
Rock armour
Boulders placed on a beach that absorb the energy of waves.
Good as they’re long lasting and prevent erosion, bad as they can trap litter and limit beaches
Sea Walls
Walls built parallel to shore to absorb wave energy.
Good as they prevent erosion effectively and can double as other infrastructure (walkways, etc.), bad as they can be hazardous for floods and damage ecosystems
Gabions
Cheaper sea walls made from rocks placed in a metal frame.
Good as they’re very cheap and easy to construct, though bad as they can only go on sandy coasts, high maintenance, and dangerous if broken
Offshore Breakwater
Structure built offshore parallel to coast designed to break waves early, before they hit land.
Good as they can make safer waters for boats and prevent erosion, bad as they can be high maintenance, don’t work well with tall waves, and can have impacts on environment
Groyne
Structure built perpendicular to shore that traps sediment.
Good as they expand beaches and are effective at minimising erosion, though bad as they can be very expensive to build and maintain
Beach Nourishment
A process of soft engineering in which sand is placed onto or near a beach, allowing the beach to replenish it’s sand.
Good as it is cost-effective and lowers risks of floods, though bad as they can be costly overtime, disturb the ecosystem, and be harmful if sand is extracted from bad places
Managed Retreat
A process of soft engineering in which human settlements and hard engineering structures are moved further inland, allowing natural coastal activities to occur without interference.
Good as they can lead to the creation of waterbodies that create a natural defense against erosion, though bad as they require the consent of people who have to move, possibly driving up costs in negotiation