chapter 3.1 review questions
1/8
There's no tags or description
Looks like no tags are added yet.
Name | Mastery | Learn | Test | Matching | Spaced | Call with Kai | Chat |
|---|
No analytics yet
Send a link to your students to track their progress
9 Terms
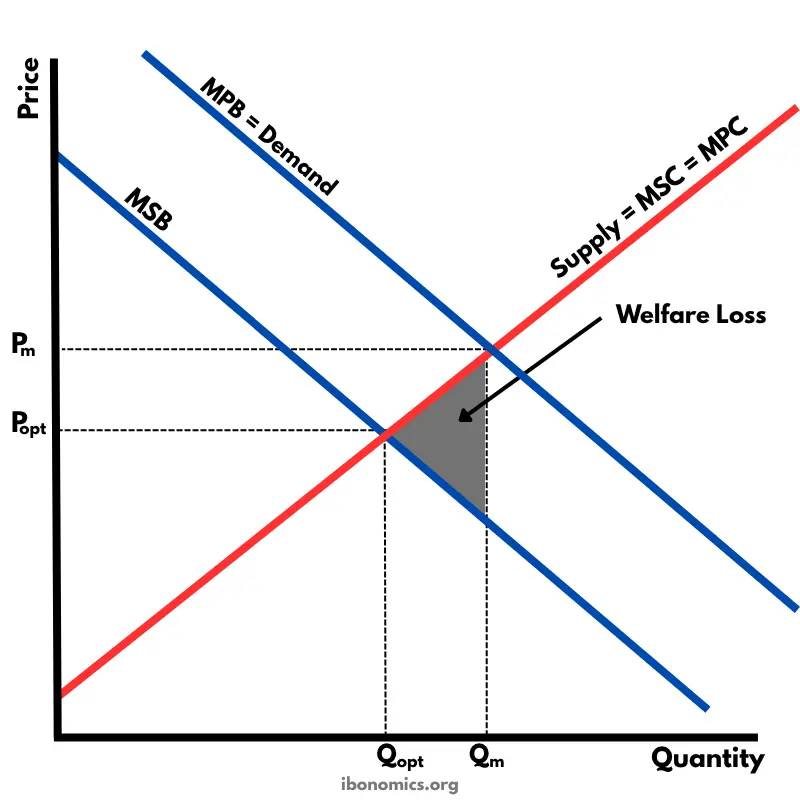
Private cars and carbon emissions: Type of externality, diagram description, optimality, and fuel tax effect.
negative consumption externality → act of consuming good (driving) creates uncompensated damage to society
MSB curve below MPB curve
market output level too high to be optimal → society experiences deadweight loss
implementing green tax on fuel: shifts MPC upward, raising consumer price & reducing output to socially optimal level
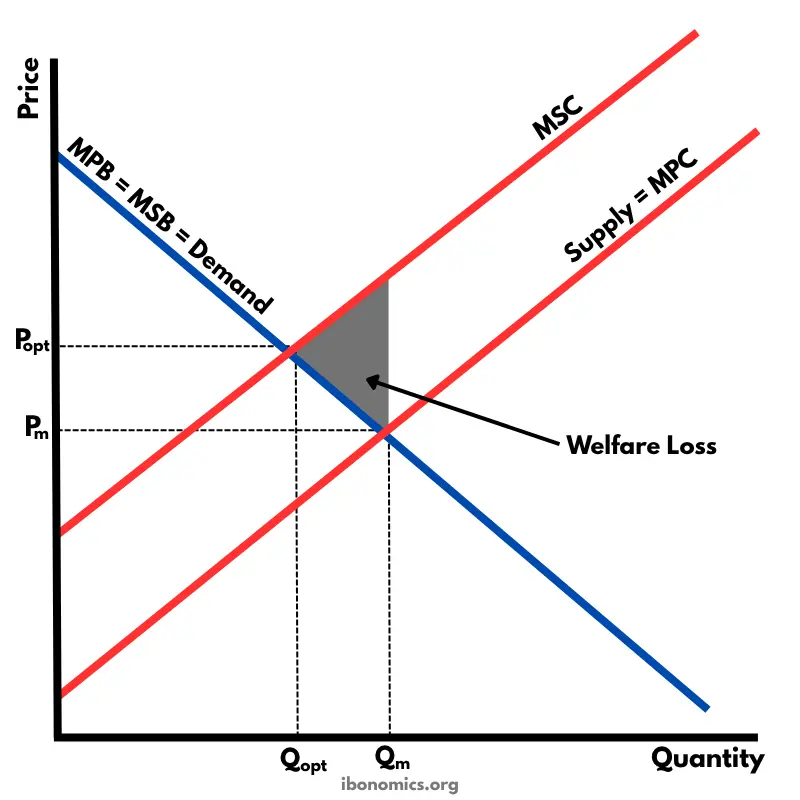
Trucks for transport services and carbon emissions: Type of externality, diagram description, optimality, and fuel tax effect.
negative production externality → providing transport services generates uncompensated external environmental damage
MSC curve above MPC curve
market output level too high compared to social optimum
green tax on fuel: increases firm MC, shifting supply curve up to internalise the externality & reduce output to optimal level
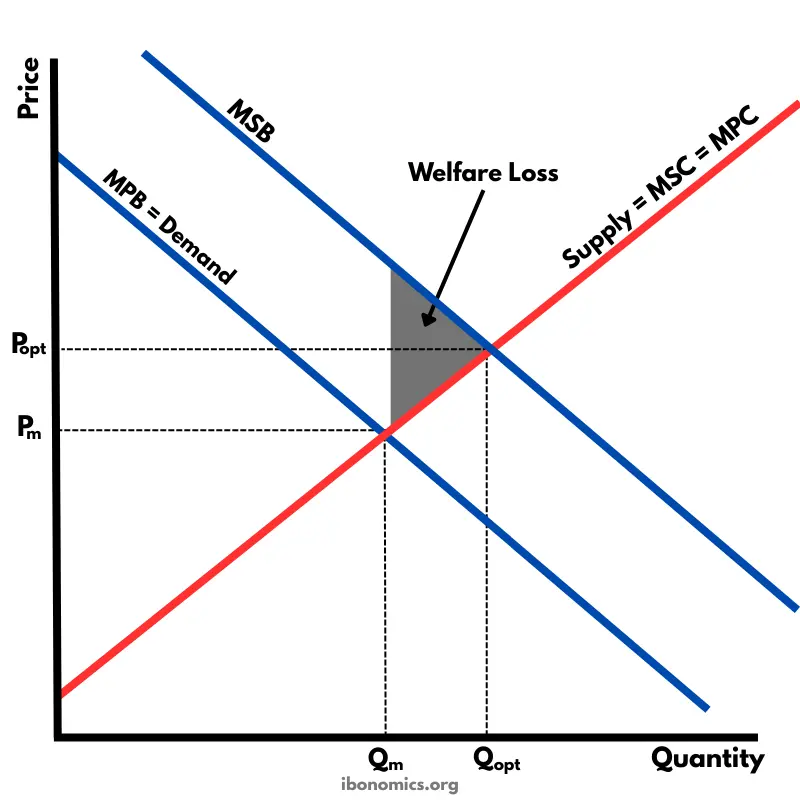
Public transport and carbon emissions: Type of externality, diagram description, optimality, and social view.
positive consumption externality → reduces overall carbon emissions & benefits society
MSB curve above MPB curve
market consumption is too low to be optimal
from social view: government intervention is needed, to shift private demand outward to achieve socially optimal level of output
Is the statement "The optimum level of polluting emissions is zero" correct?
economic standpoint: no
socially optimal level of pollution: when MC of reducing pollution = MB of economic activity creating it
to eliminate all pollution, we have to stop almost all industrial, transport, & agricultural production → catastrophic social welfare losses that outweigh environmental benefits
How do the damage cost approach and abatement cost approach differ?
damage cost approach: monetary value of actual harm inflicted on human health, infrastructure, & ecosystems by environmental degradation
abatement cost approach: proactive → financial cost required to prevent, avoid, or safely clean up emissions before they cause harm
What is the largest negative externality of car traffic?
climate change → largest long-term
traffic/accidents/noise → largest immediate / daily
carbon-driven climate change → largest macro-economic costs
Which 2 types of traffic contribute most to climate change?
road transport: highest transport-related GHG emissions
aviation: highest high-altitude radiative forcing
Which sector is contributing most to GHG emissions?
energy: heat & electricity production
industrial manufacturing & agricultural / land use
Why may the Coase theorem work for local externalities but fail for global externalities?
relies on low transaction costs & clearly defined property rights to allow parties to bargain efficiently
global externalities: involve billions of people, undefined international property rights over the atmosphere, & free-rider incentives
makes transaction costs prohibitively high for private bargaining to work