HPI DSML
 Call Kai
 Learn
Learn Practice Test
 Spaced Repetition
 Match
Match Flashcards
 Knowt Play
1/138

There's no tags or description
Looks like no tags are added yet.
Name | Mastery | Learn | Test | Matching | Spaced | Call with Kai | Chat |
|---|
No analytics yet
Send a link to your students to track their progress
139 Terms
Support for Item set I
Number of baskets that contain all items in I (often as a fraction of all baskets)
Frequent item set definition
Given a minimal support threshold s, an item-set I is a frequent item-set if and only if support(I) ≥ s
Downward Closure Property
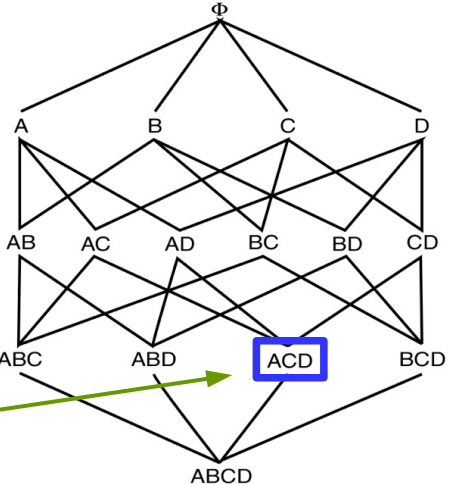
All subsets of a frequent item-set must also be frequent.
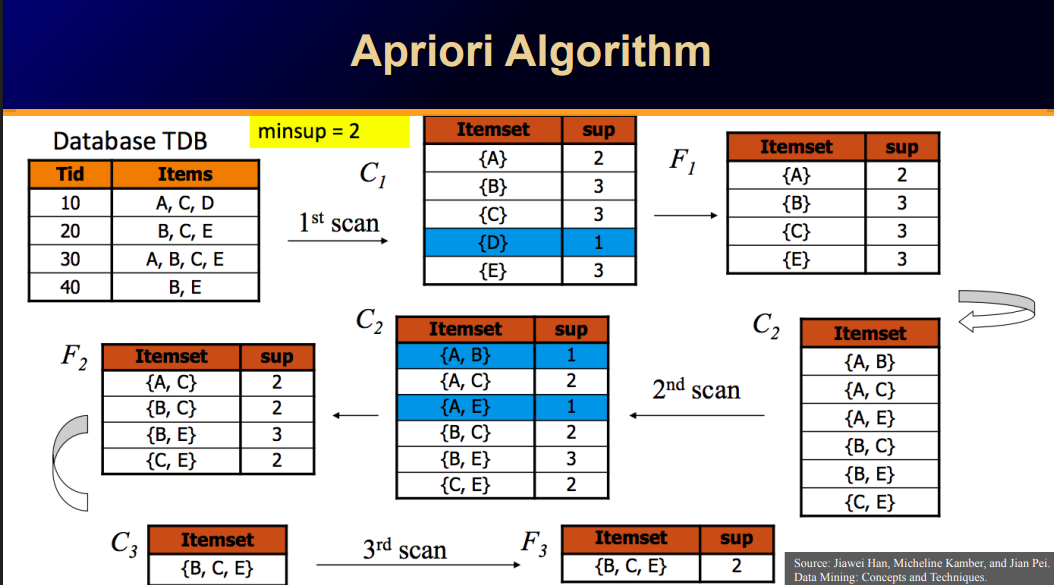
Apriori Algorithm
Given frequent itemset I and a non-empty subset A ⊆ I, we can create potential association rules of the form
A → I \ A
Association rule support
How often do the left and right side together show up in a basket
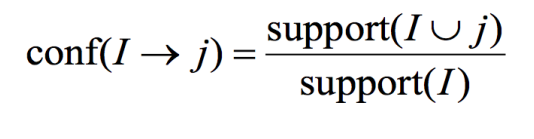
Association rule confidence
support of all items / support of left side
(support of only left side is always greater, so 0 <= conf <= 1)
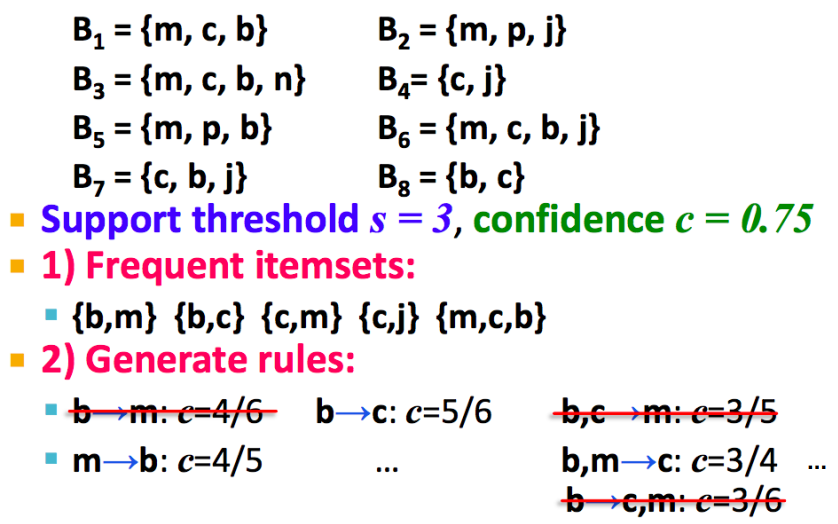
Find all association rules with support ≥ s and confidence ≥ c
Step 1: find all frequent item sets I
Step 2: for every subset A of I, generate a rule A → I \ A
Step 3: Output the rules above the confidence threshold
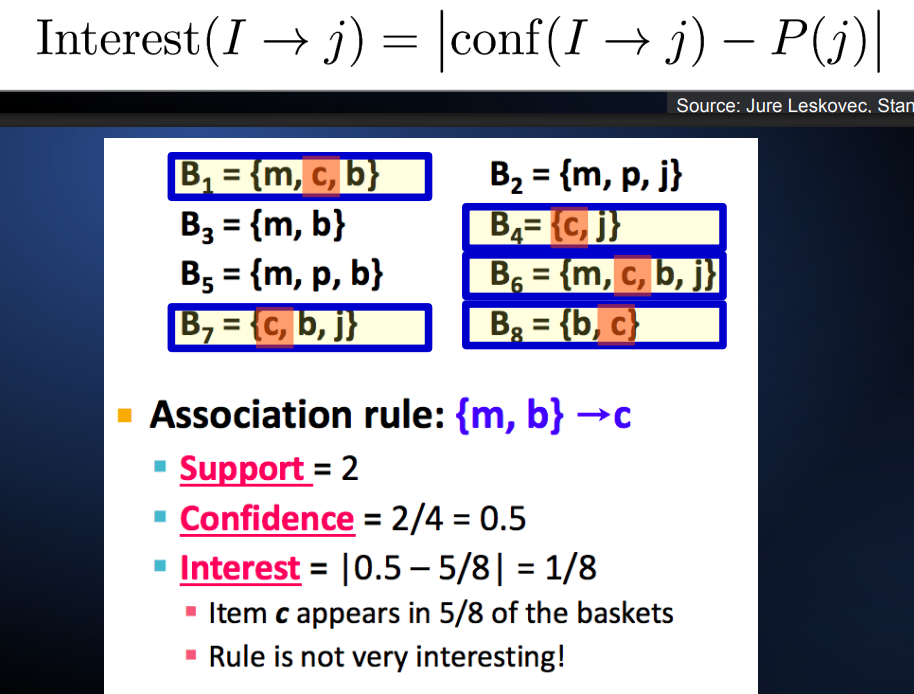
Association rule interestingness
falls die interestingness vor dem betrag -1 war, so ist I eines der wenigen sets, welches j ausschließt → auch interessant. falls sie 1 war, so ist j selten und wir haben eine gute assoziation gefunden.
Other Kinds of Frequent Patterns
Sequential pattern mining: subsequences (with or without gaps), Graph Pattern Mining (count how often a little graph is contained as a subgraph for big G)
Euklidische Distanz für n Dimensionen
Assumption: Can use distances between vectors

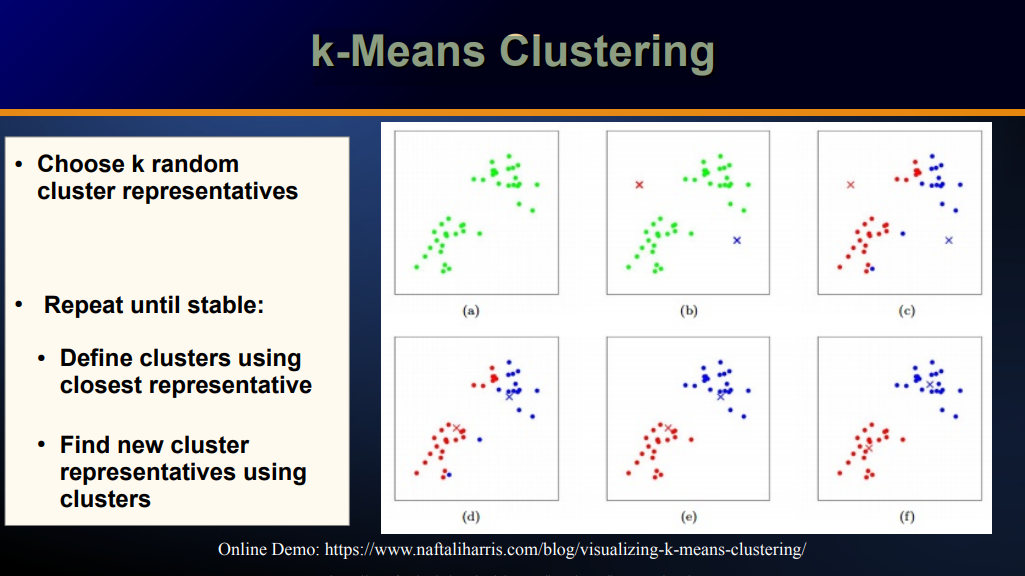
k-Means Clustering
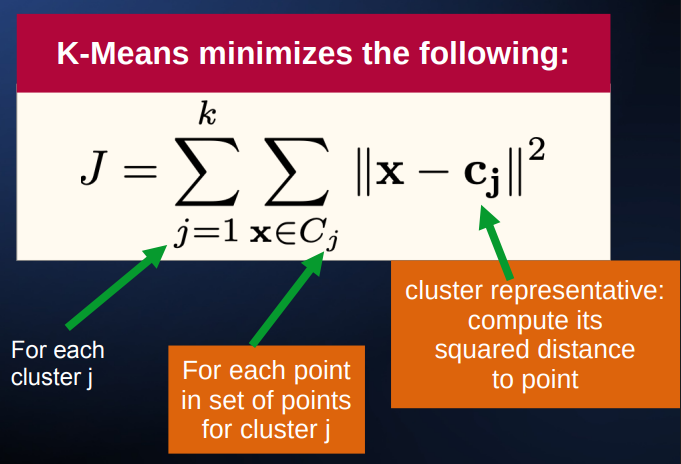
k-Means Clustering: Objective Function
what if k means k too small
not all boundaries are recognized, different groups are thrown together
what if k means k is too big
groups get divided
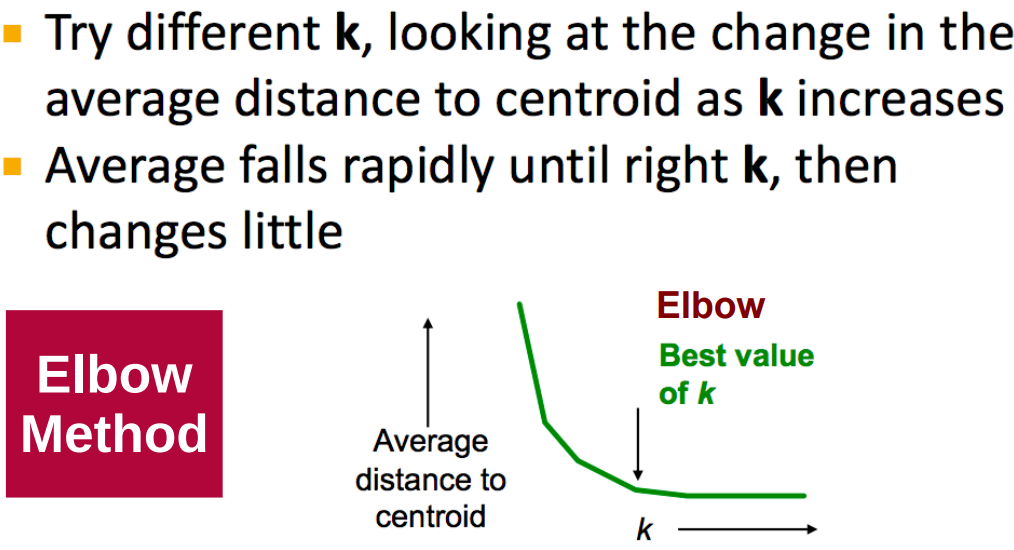
Elbow Method
k-means++
Randomly pick representatives preferring ones far away from already chosen representatives
k-means issues
different densities, overlapping clusters, non-globular shapes, differently sized clusters
Top-Down Clustering
start with one big cluster and partition it
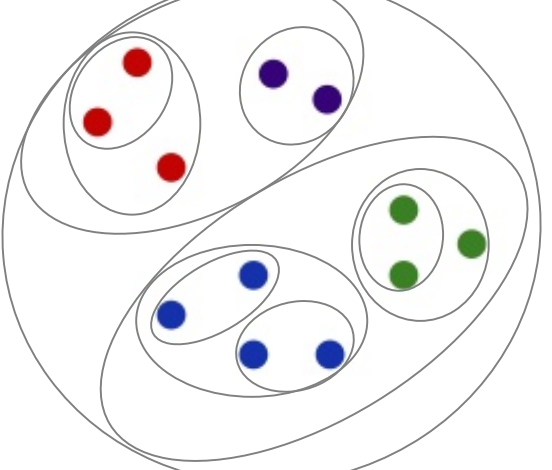
Hierarchical Agglomerative Clustering
start with each point in its own cluster, then keep merging the two most similar clusters
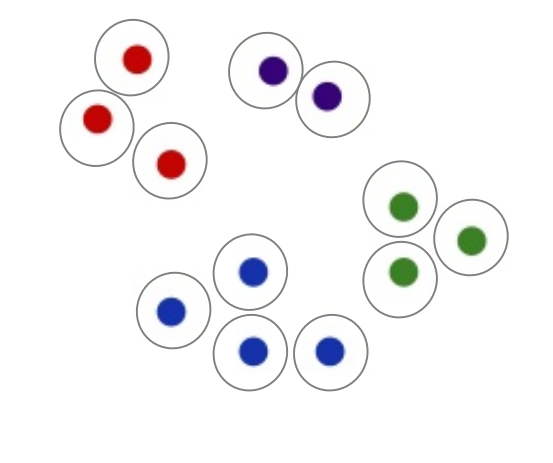
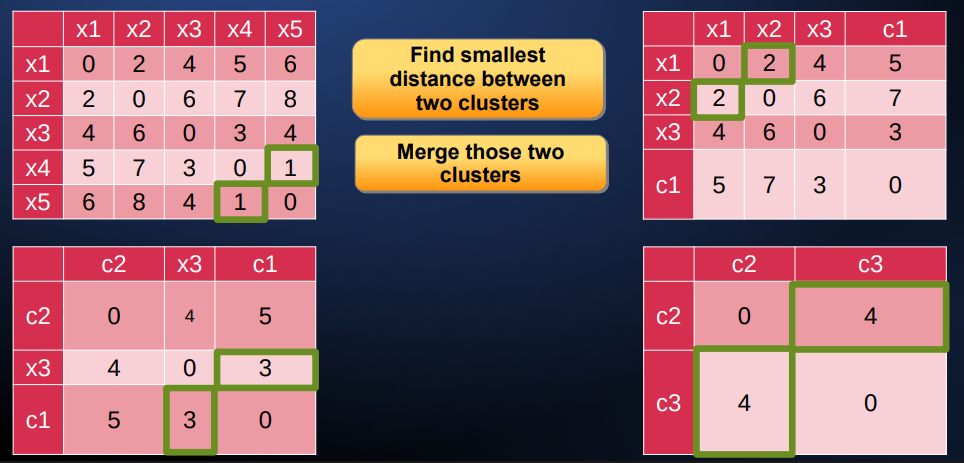
Hierarchical Agglomorative Clustering example → Single Link Clustering
uses the minimum distance between two clusters, fills in with min()
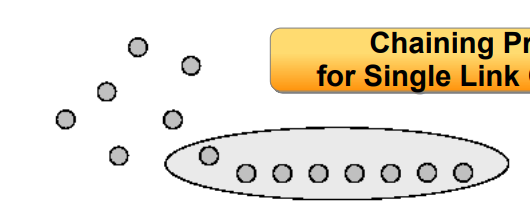
Chaining Problem for Single Link Clustering
Complete Link Clustering
Max Distance
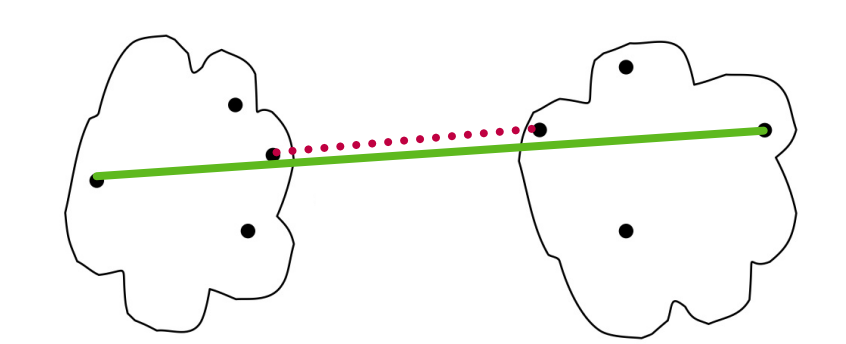
Complete Link Clustering difference to Single link
fills in with max() except that point on which the clusters merged
Complete Link pros and cons
pro: less sensitive to noise than single link
con: may break up big clusters
other clustering distance measurements except single- and complete link
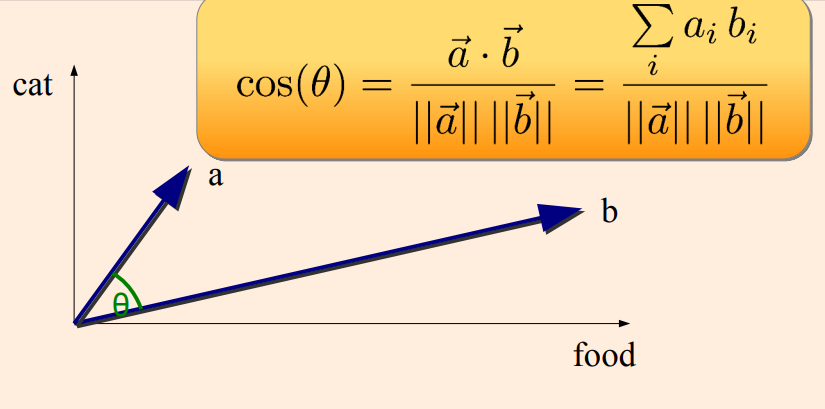
average distance, centroid distance, Similarity
Point similarity
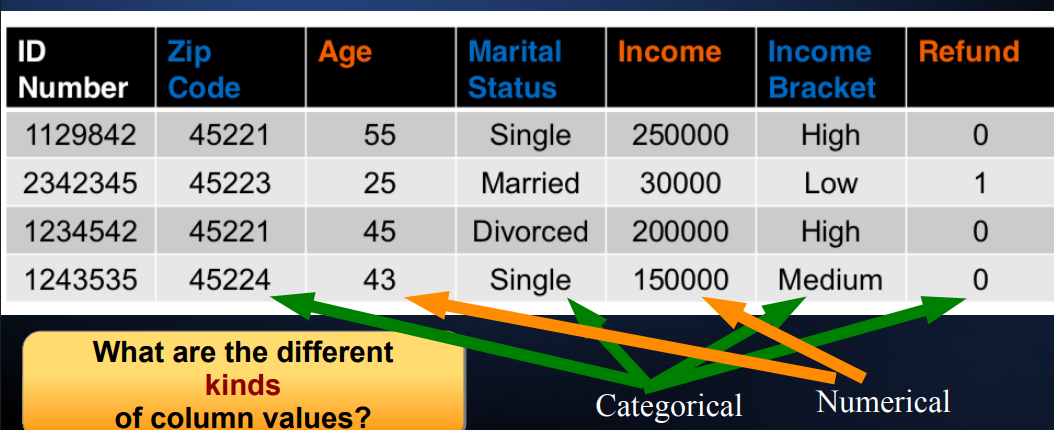
Different kinds of columns in tables
categorical columns (also zip code)
numerical columns
Data Wrangling
Making the raw data ready to use
Range
Max. and min values (and their difference)
Mean, Median, Mode
Mittelwert, Median, der häufigste
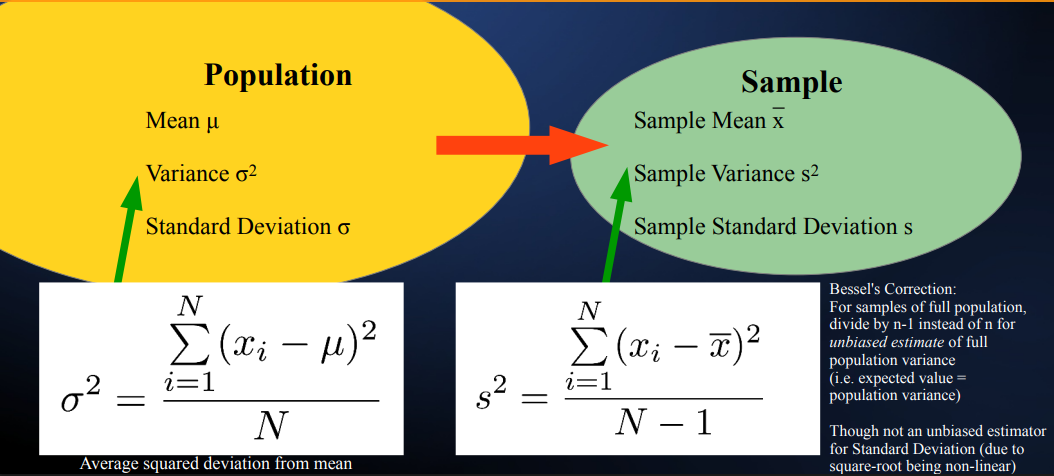
variance
der empirische durchschnittliche quadratische abstand
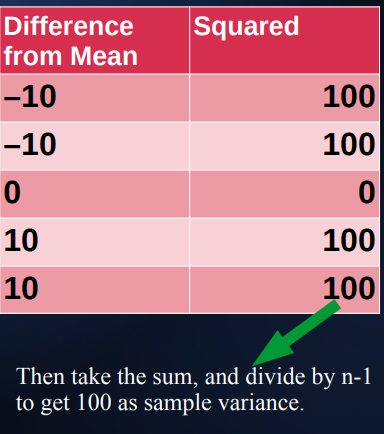
population vs sample variance
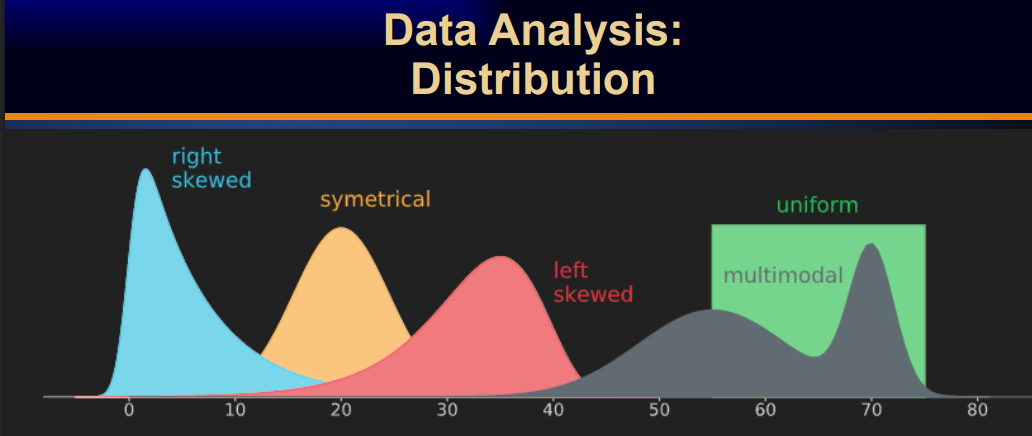
different shapes of distributions
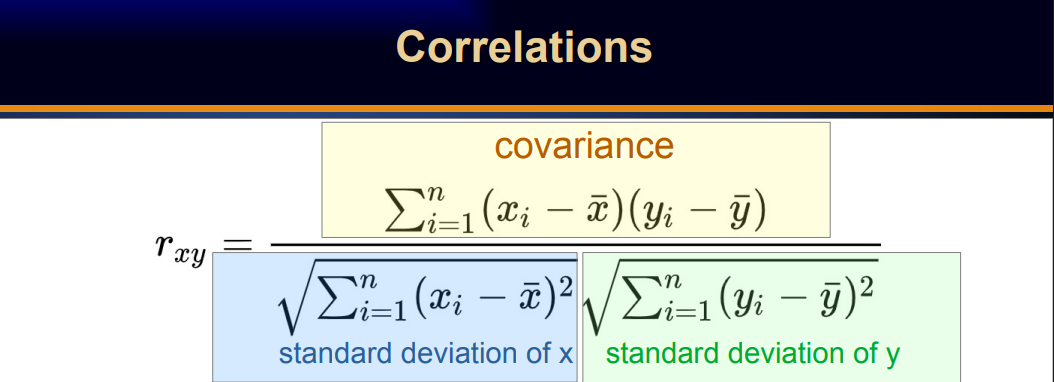
correllation (pearson)
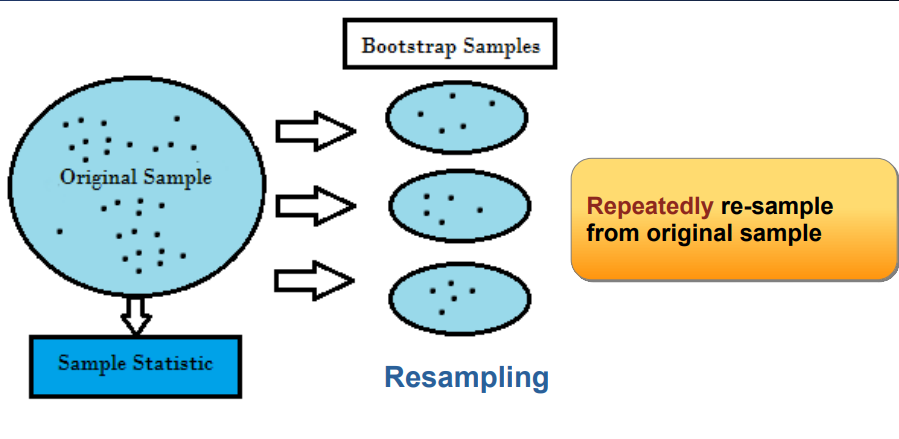
how can We Estimate Population-Level Statistics?
with sampling (bootstrap method)
bootstrap method
Look at distribution over 1000 mean values for resampled subpopulations. We allow duplicates in sampling (ohne zurücklegen). We sample a sample basically. The Bootstrap method allows us to simulate having many random samples instead of just one in a statistically valid way
Feature Engineering
the step of going from an object to a feature vector
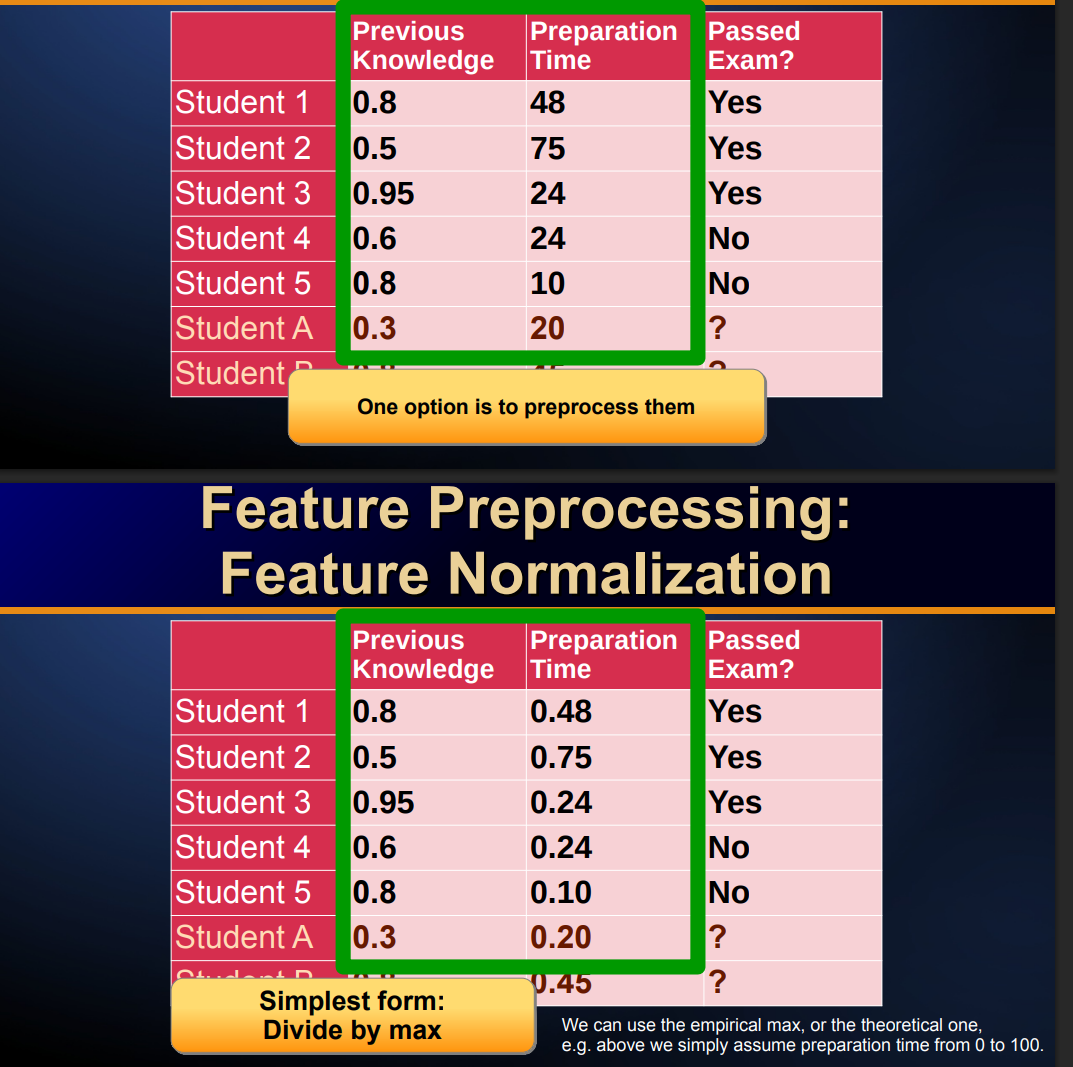
Feature Normalization
divide by max for example
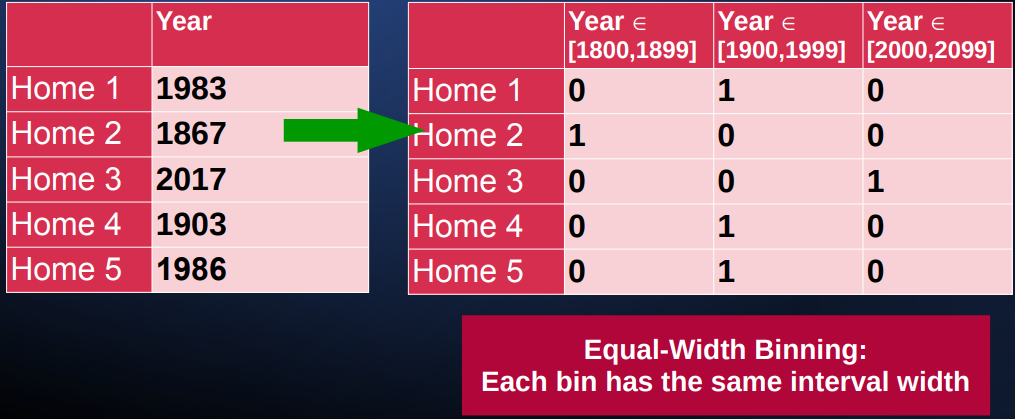
Feature Binning
L1 normalization
scale a vector to be length 1 by dividing by its length
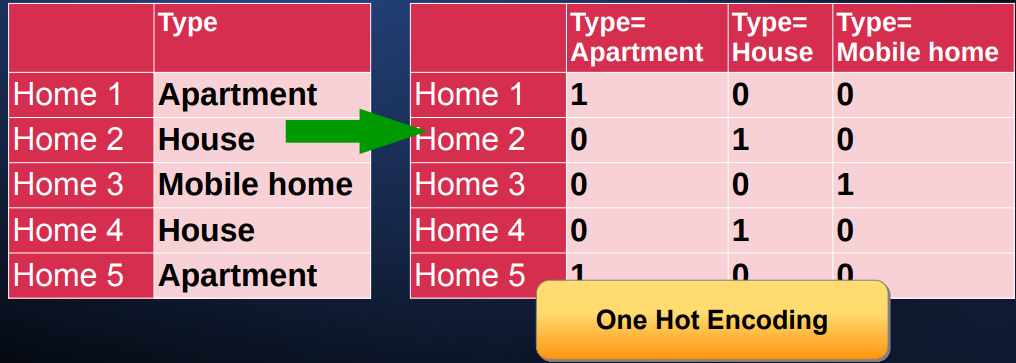
Categorical Variables
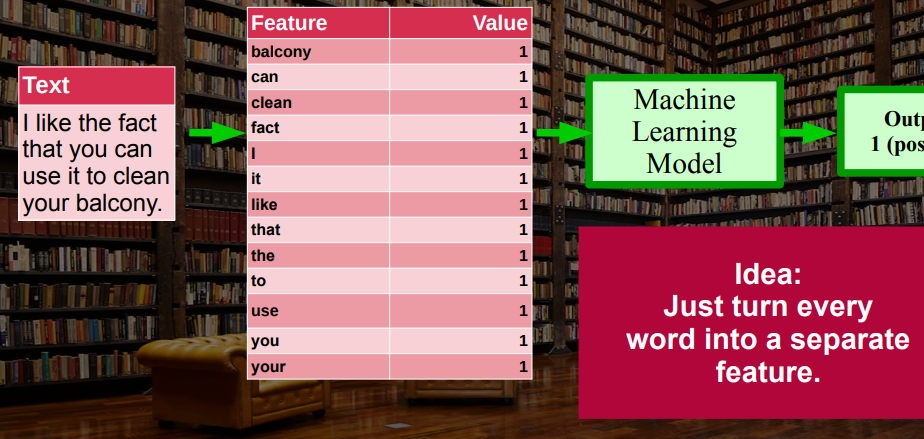
Bag-of-Words Vectors
Can use 0 or 1 as booleans, or frequencies of words.
Bag of words application
find similarities between documents
A deep learning model is trained on huge amounts of data. As part of its training,
it automatically learns to create high-quality vector representations (embeddings)
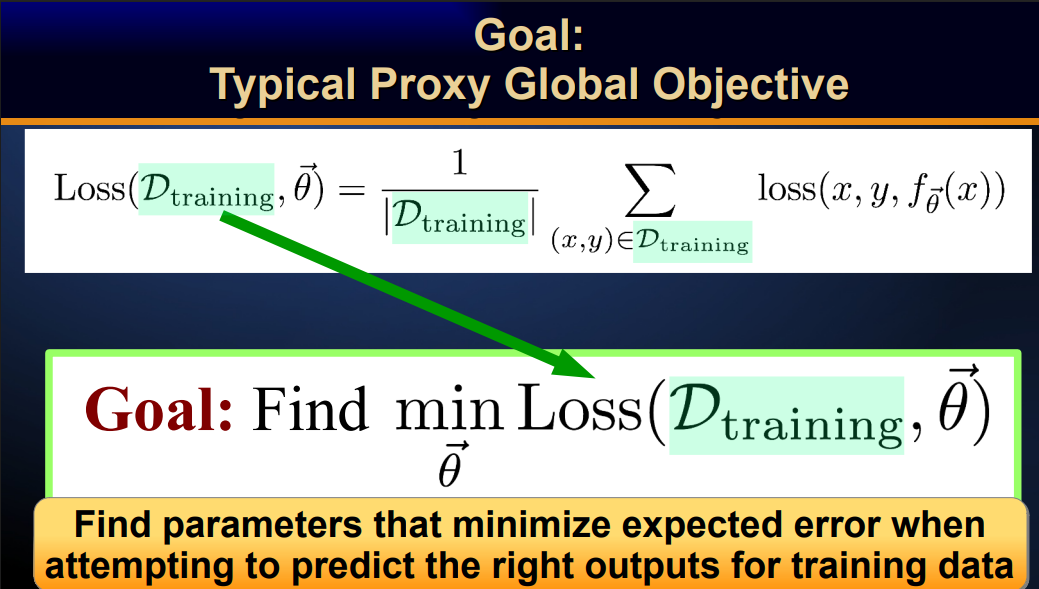
Loss function: Global objective
What is the best vector of parameters θ to minimize the training loss
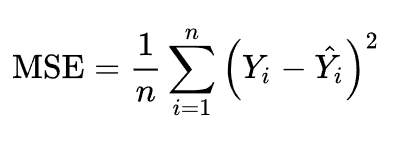
Mean Squared Error (MSE)
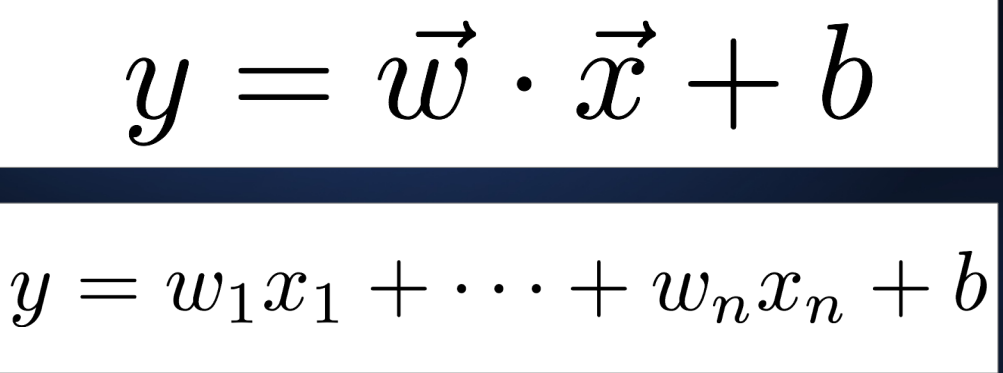
Multivariate Linear Regression
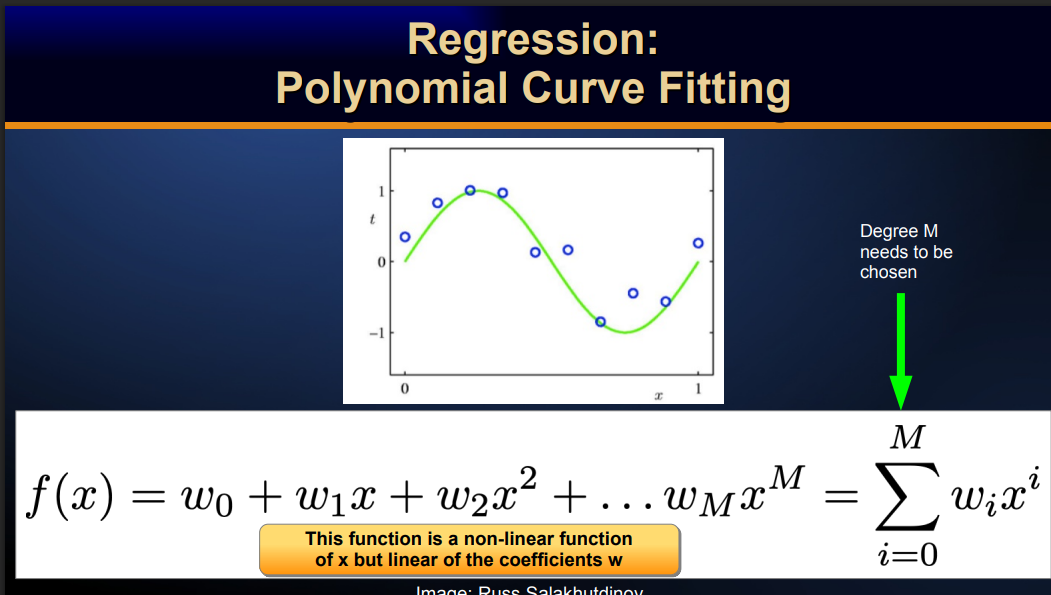
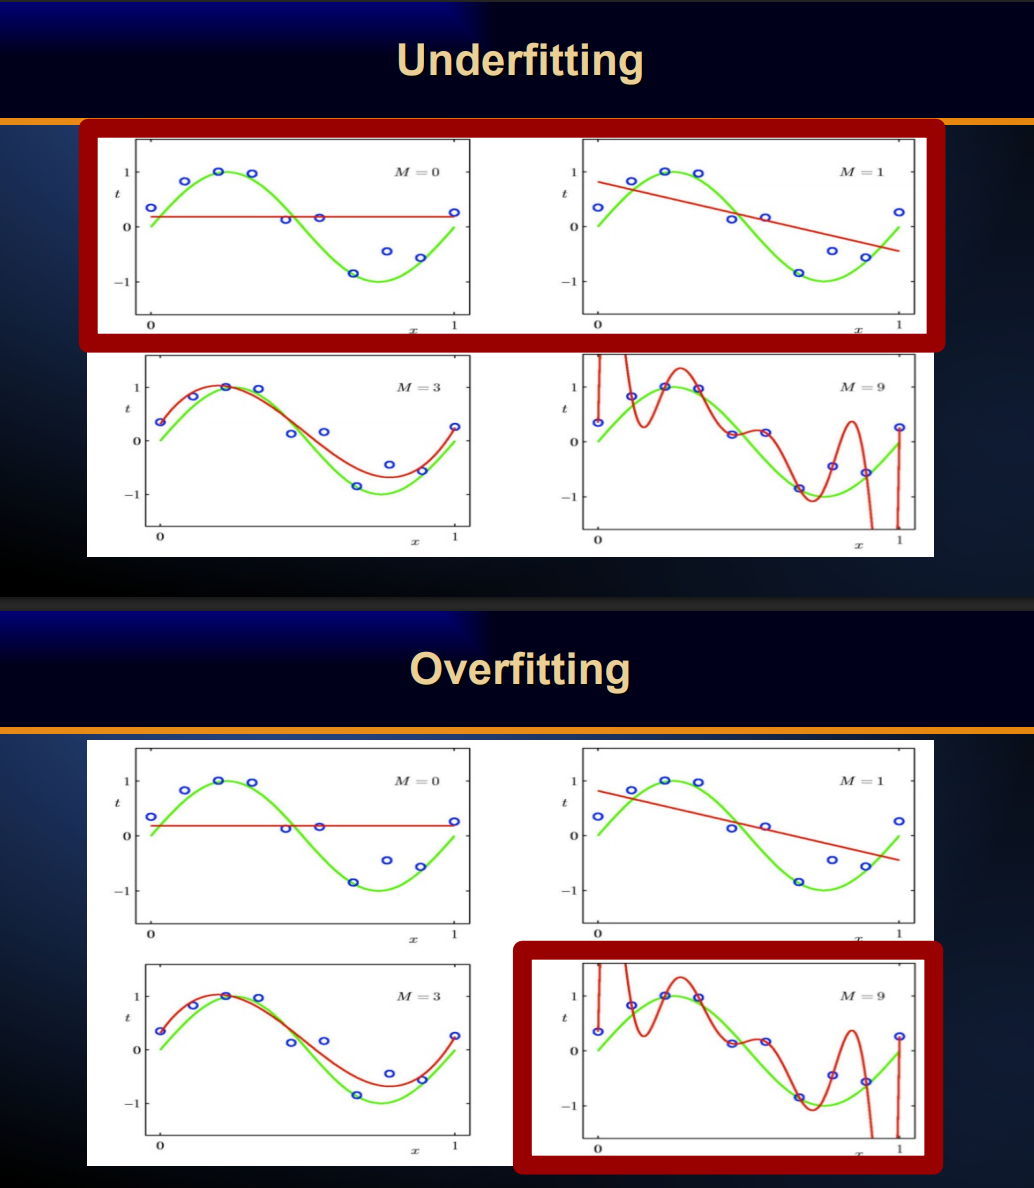
polynomial curve fitting
regression aber die parameter sind nicht mehr nur m und n sondern mehr für higher degree polynomials davor
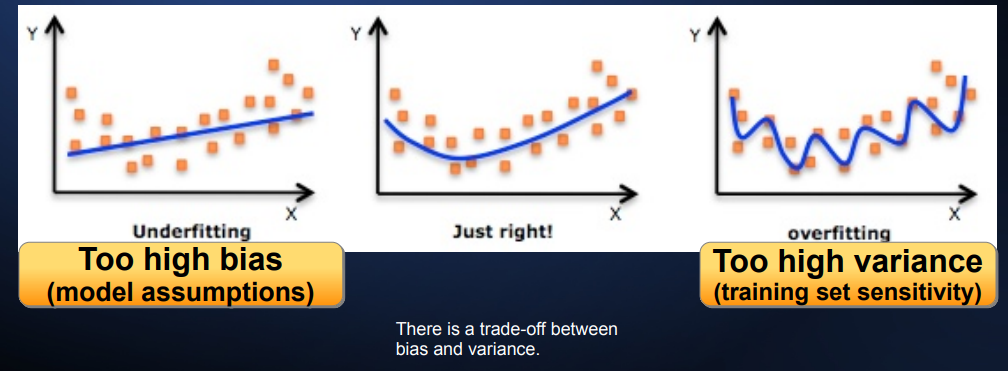
underfitting and overfitting
against overfitting: test against a validation dataset
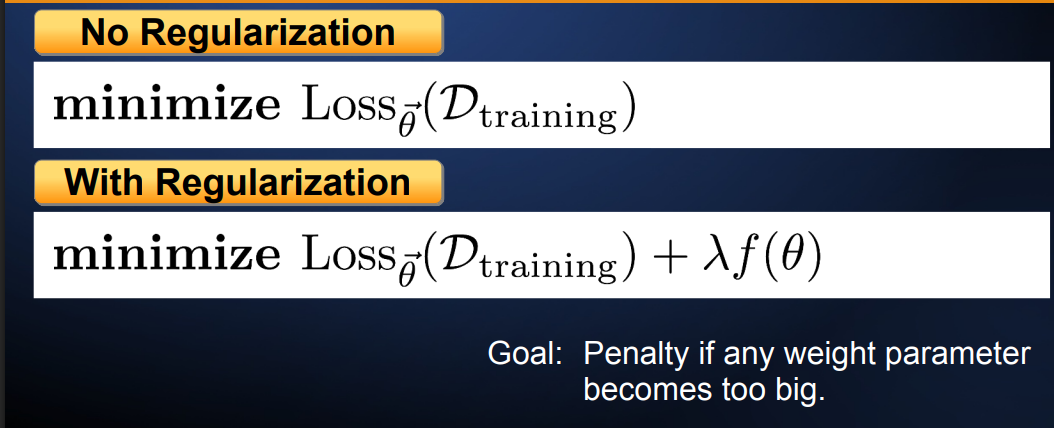
Overfitting: Improving Generalization via Regularization
Effect of Regularization: Decrease weights so the model does not pay too much attention to any particular feature.
Note: Bias terms such as are normally excluded, as they are not multiplicative weights
Overfitting: Big Data Solution
The overfitting automatically reduces if the size of the dataset increases (so the variance increases)
Bias vs variance
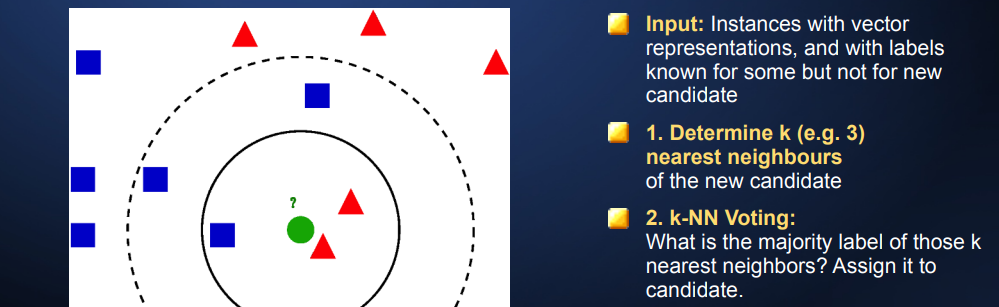
K Nearest Neighbours Question
you have n labeled points, now you get one unlabeled point. decide on which class to include the point
KNN Simple Method: 1-Nearest Neighbour Classification
just give it the same class of the nearest neighbor. Problem: sometimes a bad estimate
Simple Supervised Algorithm: kNN (k Nearest Neighbours) Classification + problems
downsides: computing k neighbors can be slow if the training set is large
Distance may not correspond to sameness of class (some features may carry greater importance)
Decision Tree Learning Algorithm
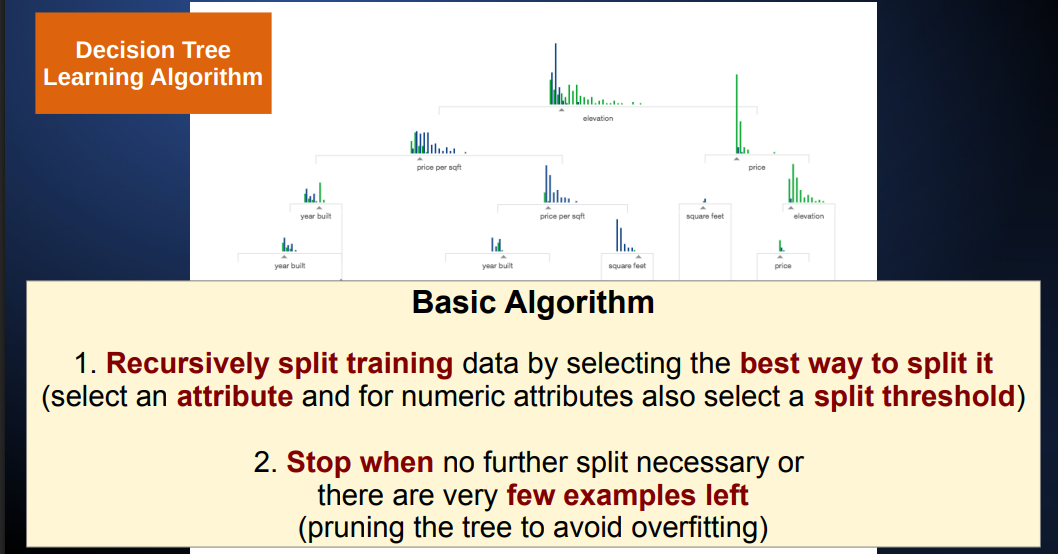
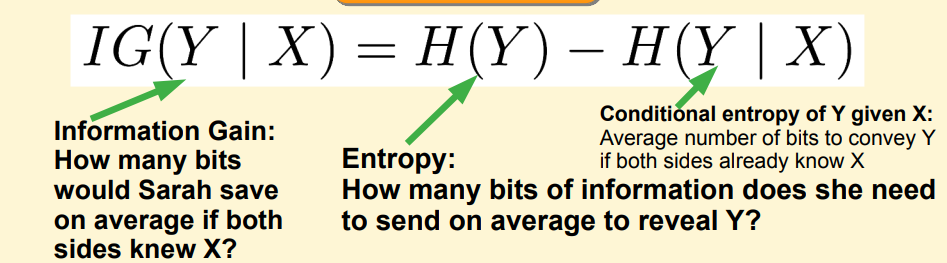
Decision Trees: Information Gain Criterium
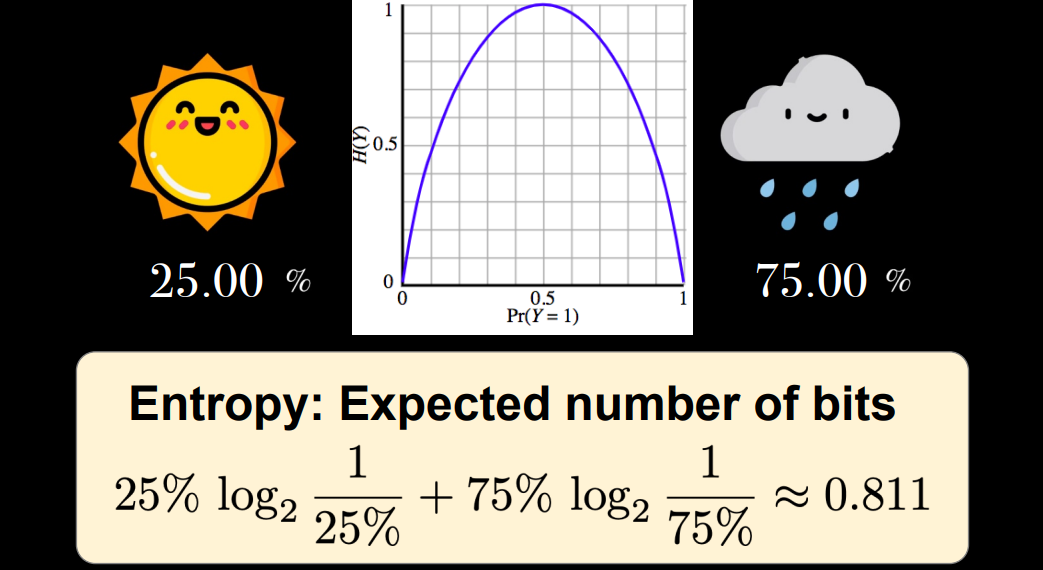
Decision Trees - Entropy Formula
summe über alle cases von p*log2(1/p)
Decision Trees: Gini Impurity Criterion
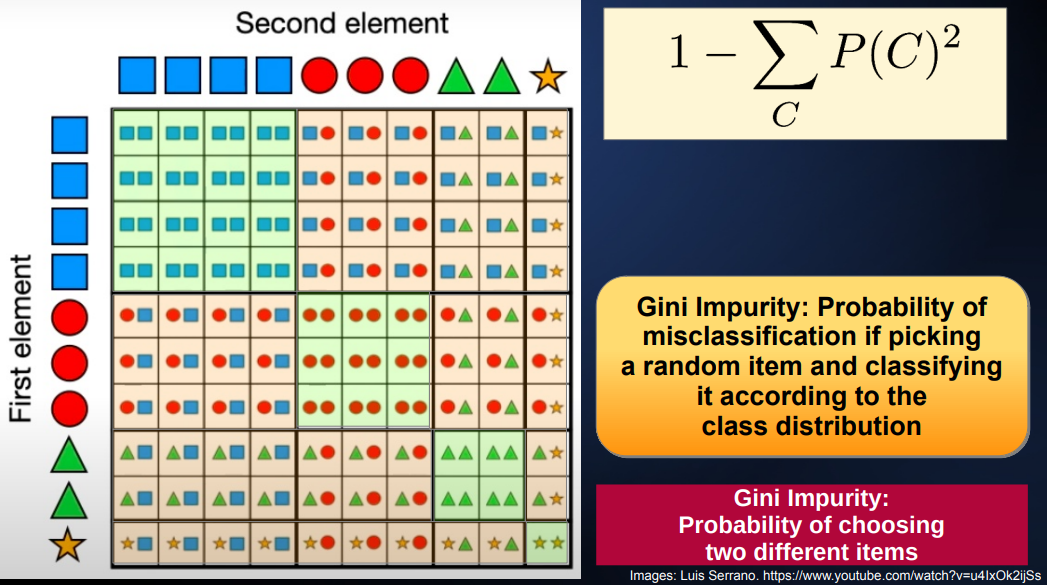
Gini Impurity applied on decision trees, weighted average Gini
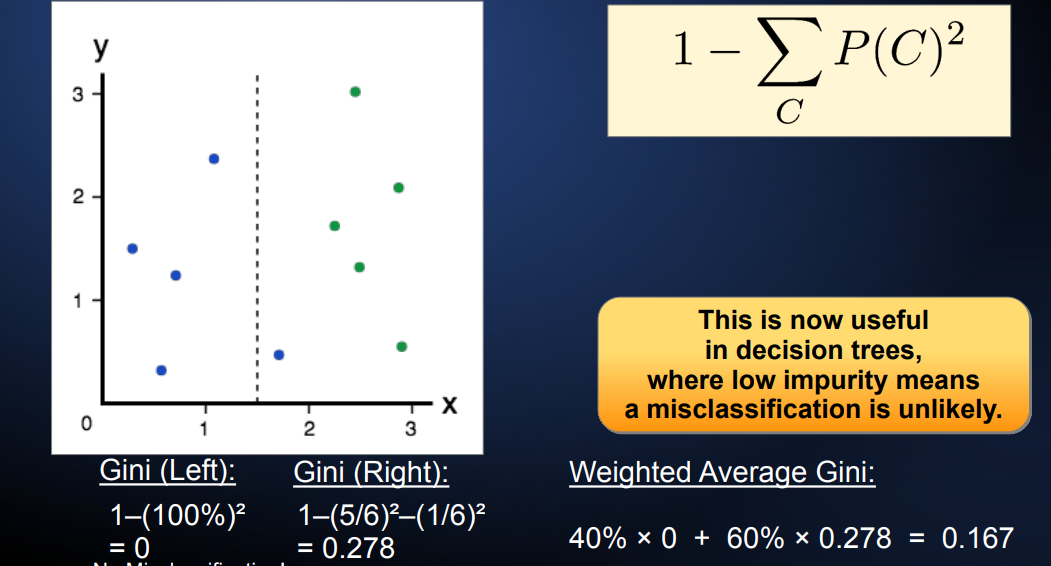
how to create a decision tree using gini impurity
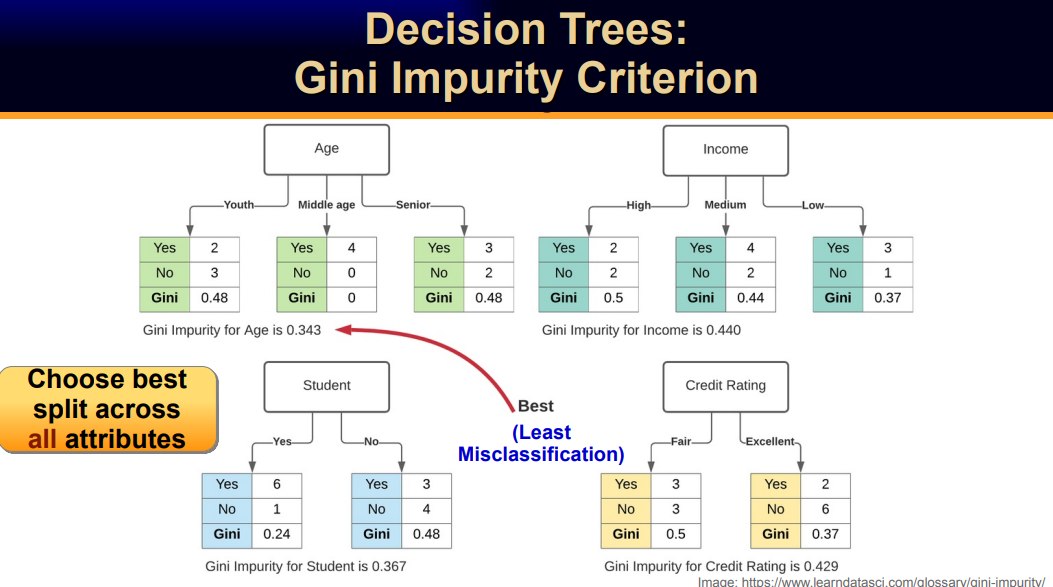
Technique to prevent overfitting on decision tree
Tree pruning
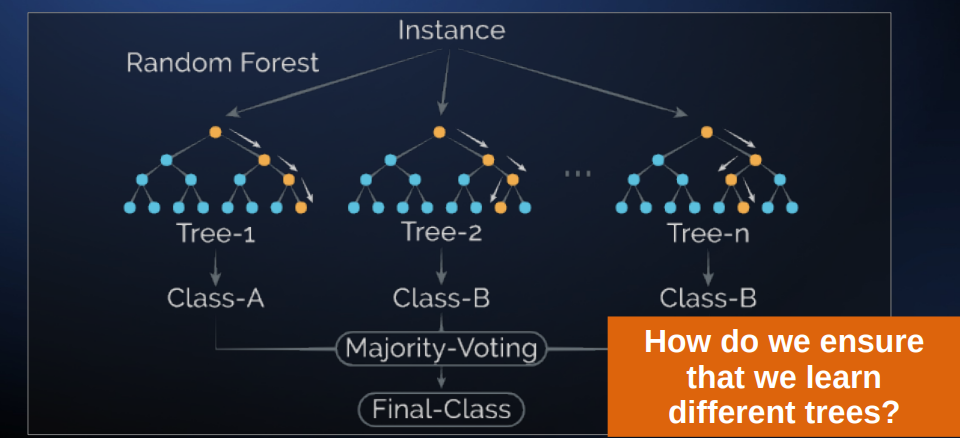
Random Forests
we ensure that we learn different trees using the bootstrap method
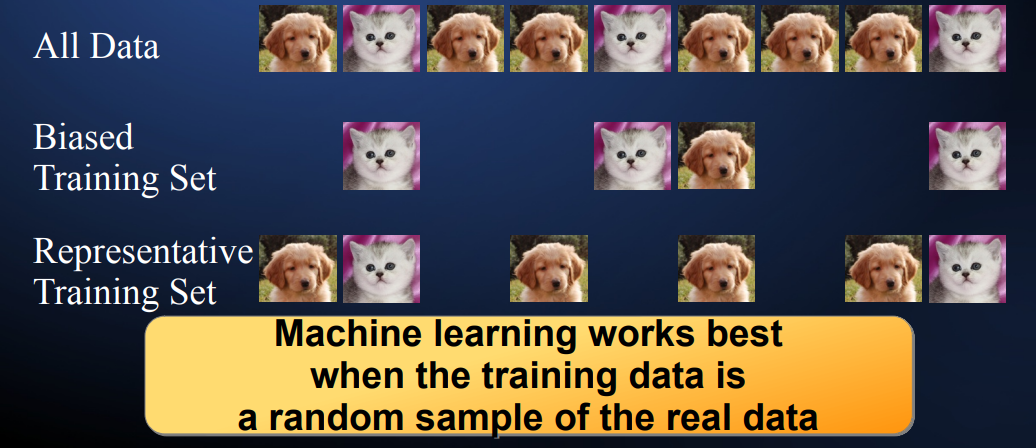
Representative training data
also: random order
Hyperparameters
control the algorithm by determining what kind of model it will learn and how it will do the learning (such as the k in KNN), or the max. degree in polynomial curve fitting
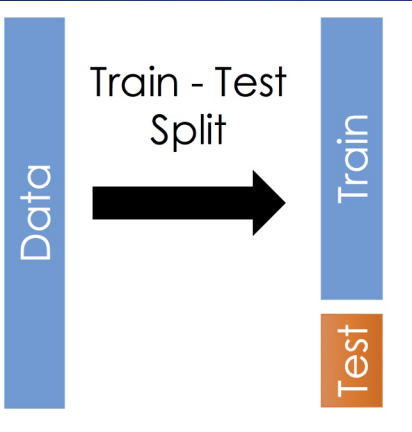
Train-Test Split
Data Leakage
The training set should not reveal unrealistically much about test set instances
Validation set vs test set
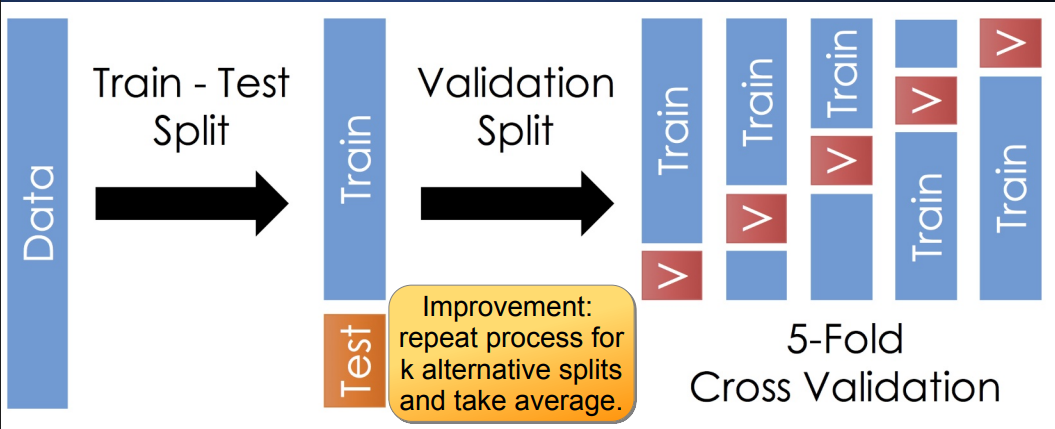
The validation set is used during the training phase of the model to provide an unbiased evaluation of the model's performance and to fine-tune the model's parameters. The test set, on the other hand, is used after the model has been fully trained to assess the model's performance on completely unseen data.
K-Fold Cross-Validation
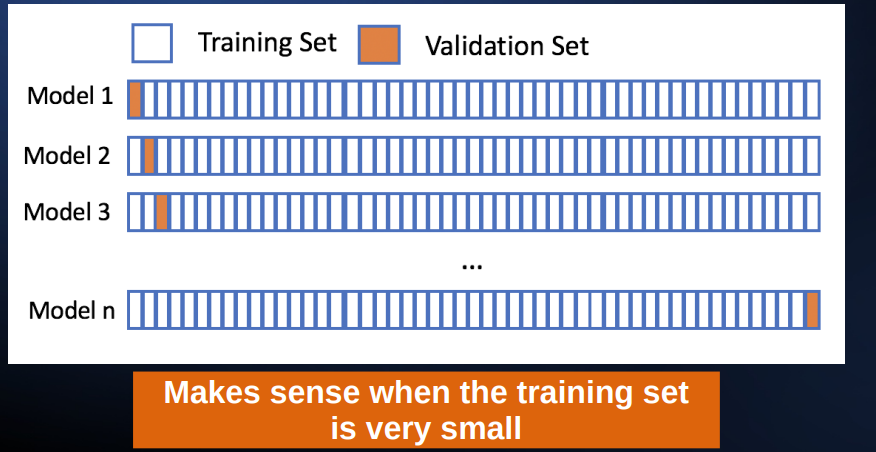
Leave-One-Out Cross-Validation
3 validation options
● Fixed Validation Set
● K-Fold Cross-Validation
● Leave-One-Out Cross-Validation
correllation of bias variance and noise to problems about model and over/underfitting
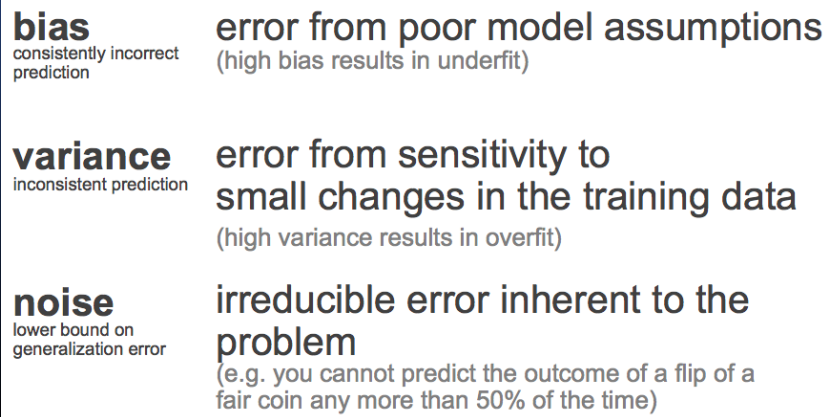
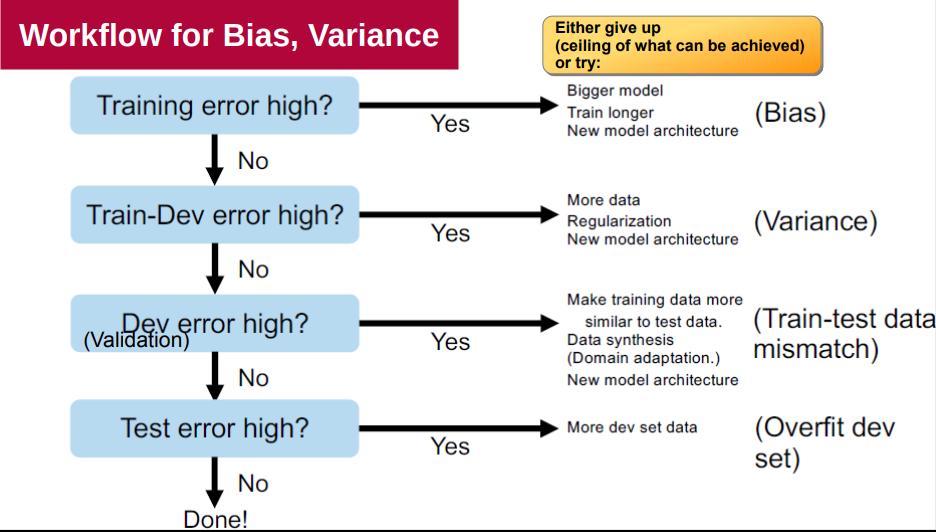
Workflow for reducing bias and variance
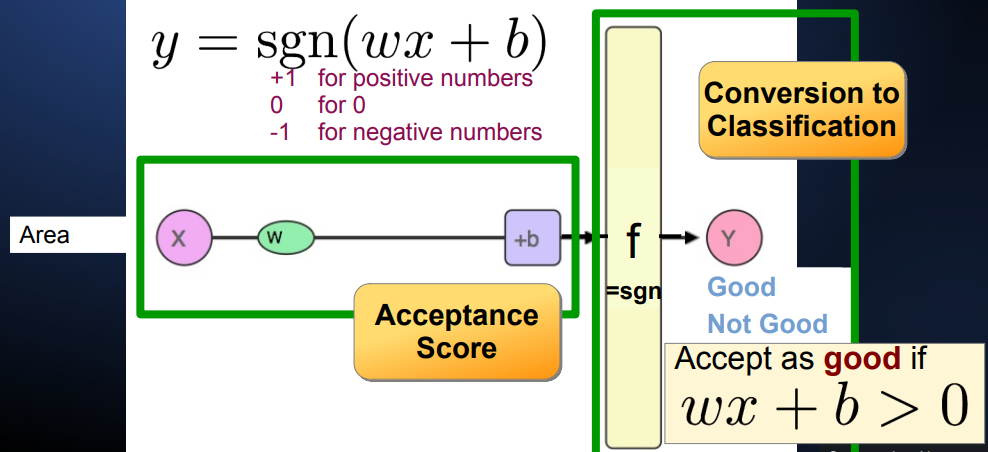
Simplest Linear Classifier: Sign
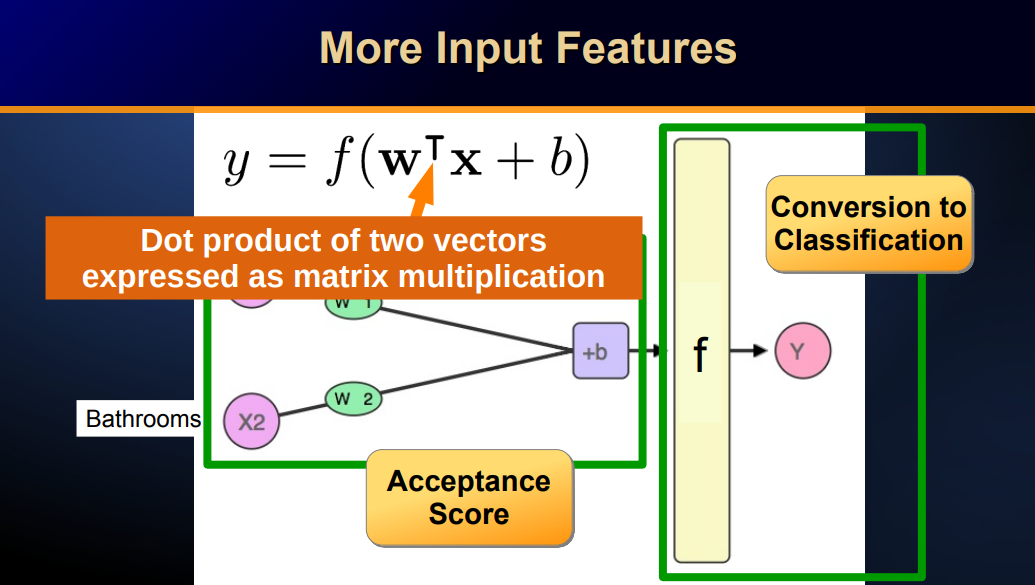
more input features - matrix multiplication
2 input features geometric interpretation
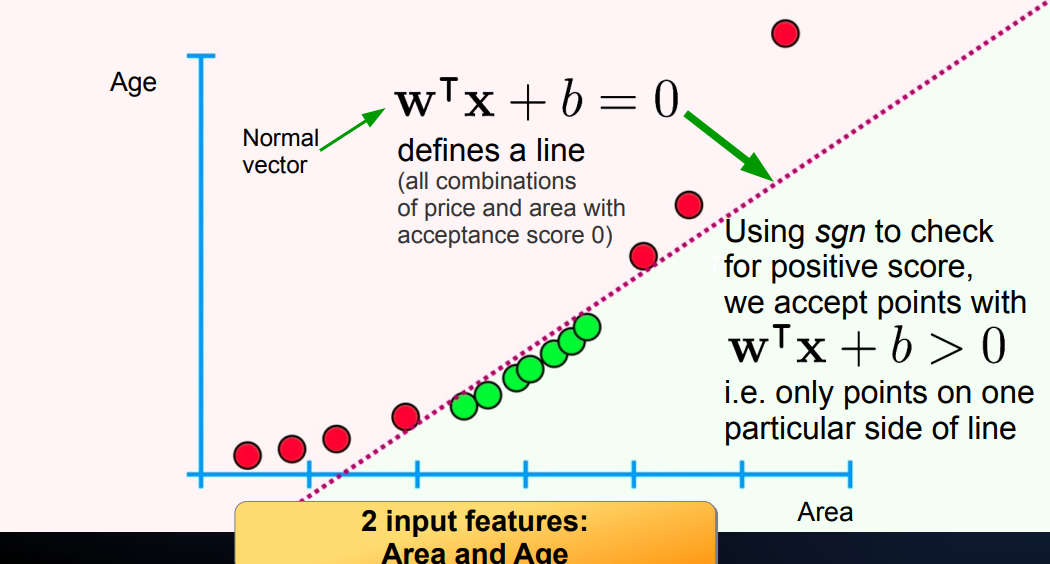
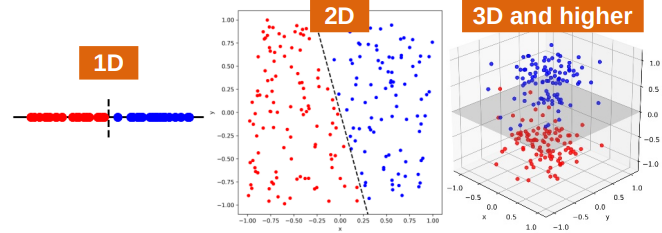
linear classifier geometric interpretation with 1, 2, 3 features
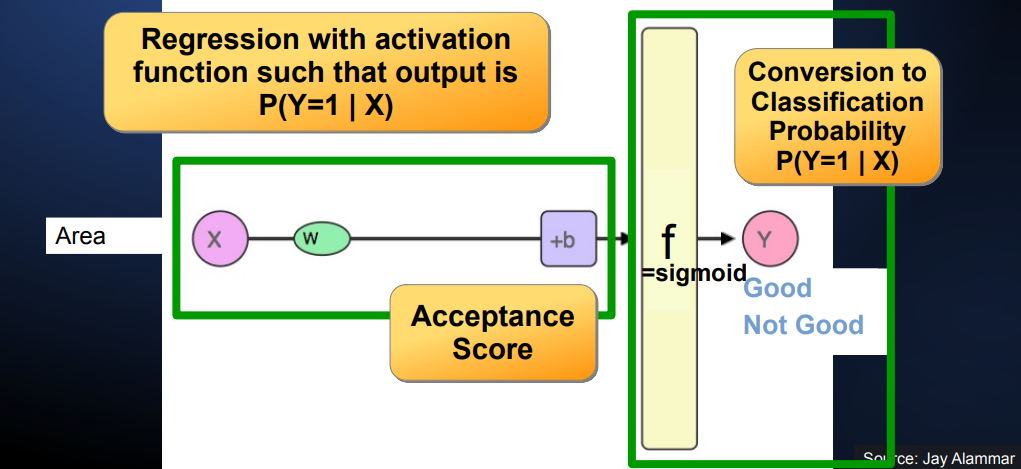
Logistic Regression
now gives probability, not score. only difference is the use of sigmoid.
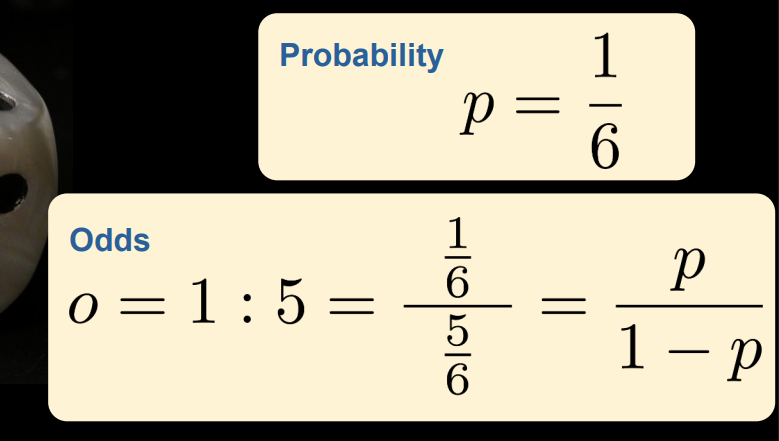
convert probability to odds
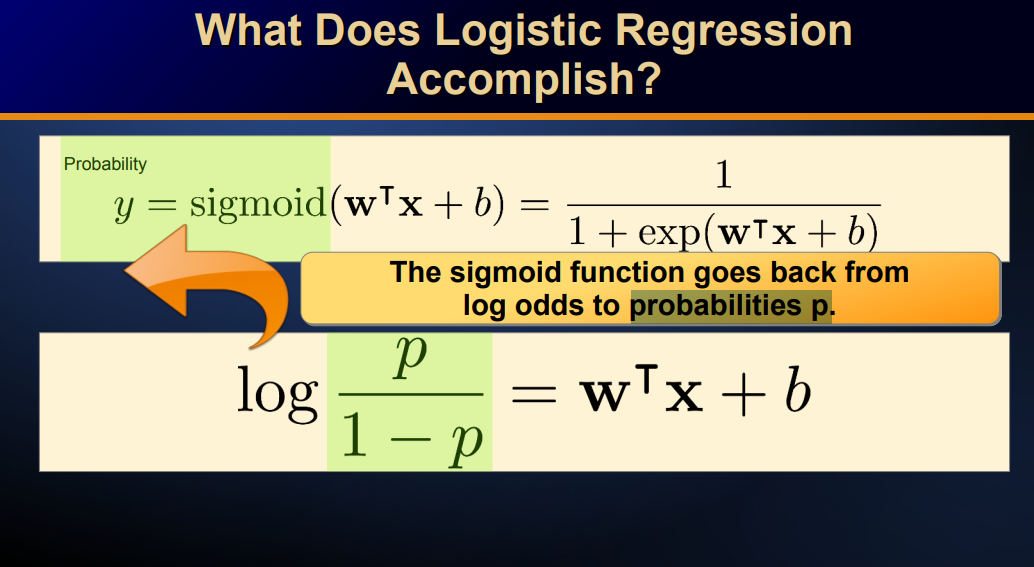
The sigmoid function goes back from log odds to
probabilities
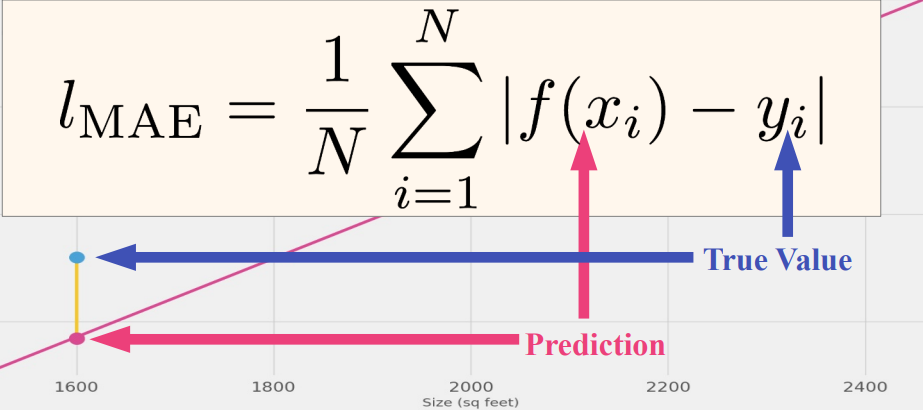
Mean Absolute Error
Mean Squared Error
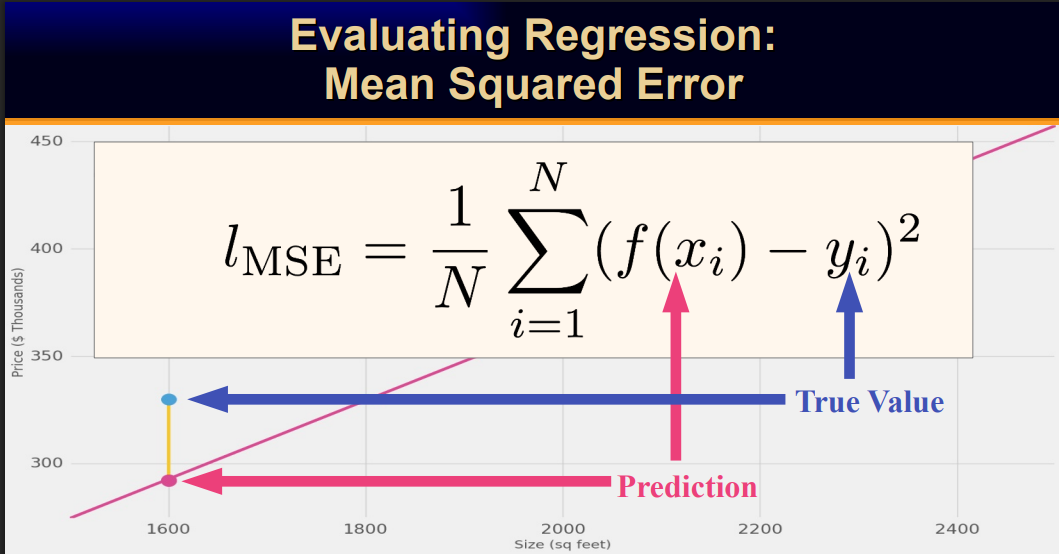
MSE pro and con
pro: Easier to optimize, with less variance
con: but also very sensitive to outliers
RMSE
square root of MSE
Classification Accuracy:
What percentage was correct?
Error rate:
What percentage was Incorrect? (1 - accuracy)
Accuracy minimum for two solutions
50%, otherwise flip
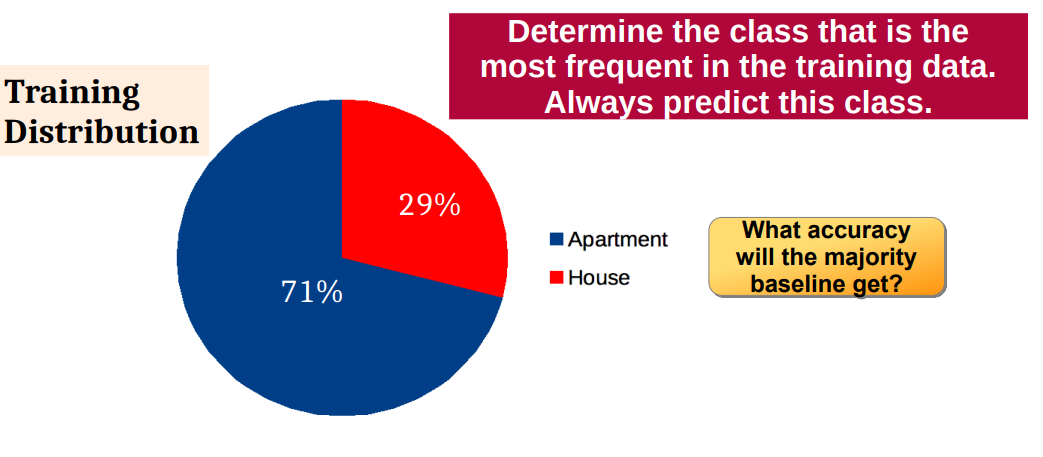
Simple Classification Model: Majority Baseline
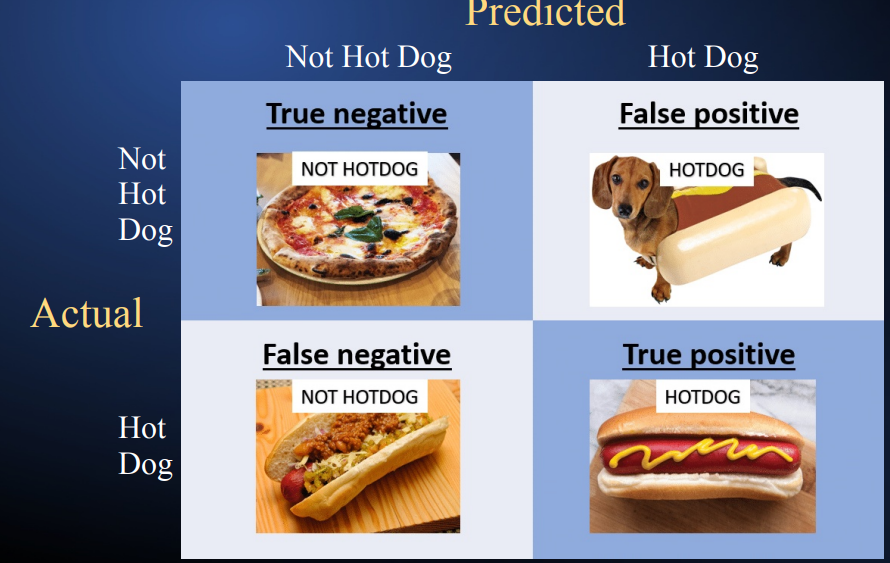
Confusion Matrix
Precision vs Recall
3 out of the 5 animals I got are really dogs → 3/5 = 60% Precision
3 out of all 8 dogs were retrieved → 3/8 = 37.5% Recall
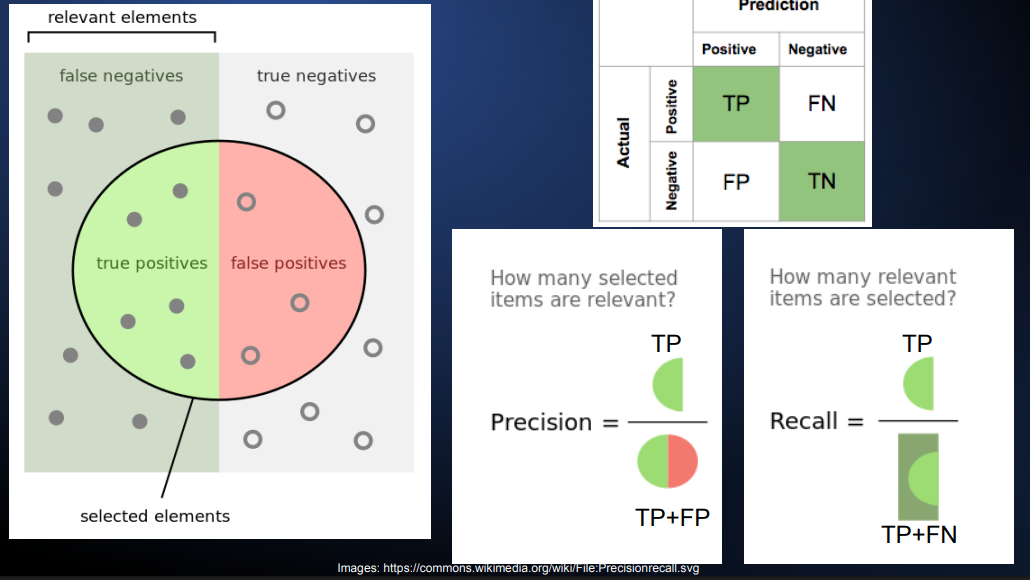
Accuracy
(TP + TN) / total
Why is recall not enough?
We can get 100% recall be classifying everything as true
Why is precision not enough?
We can get close to 100% precision by only classifying things we are really sure about
Calculate Precision and recall from binary classification
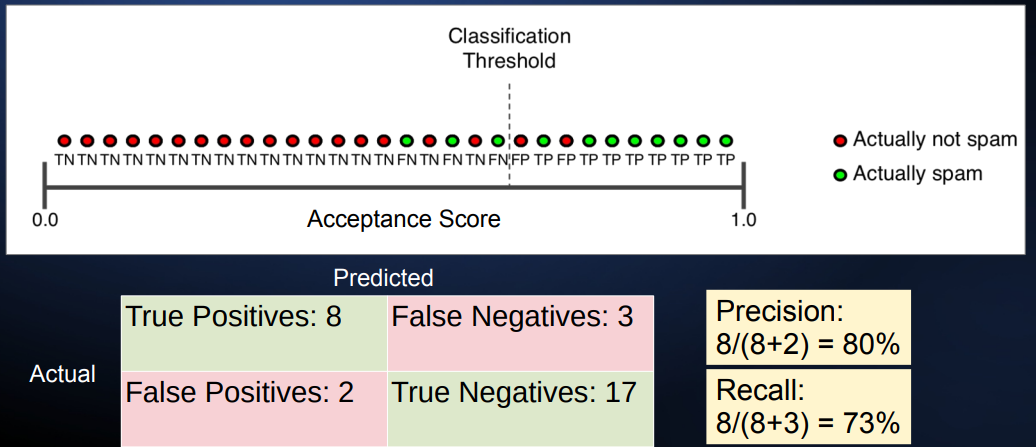
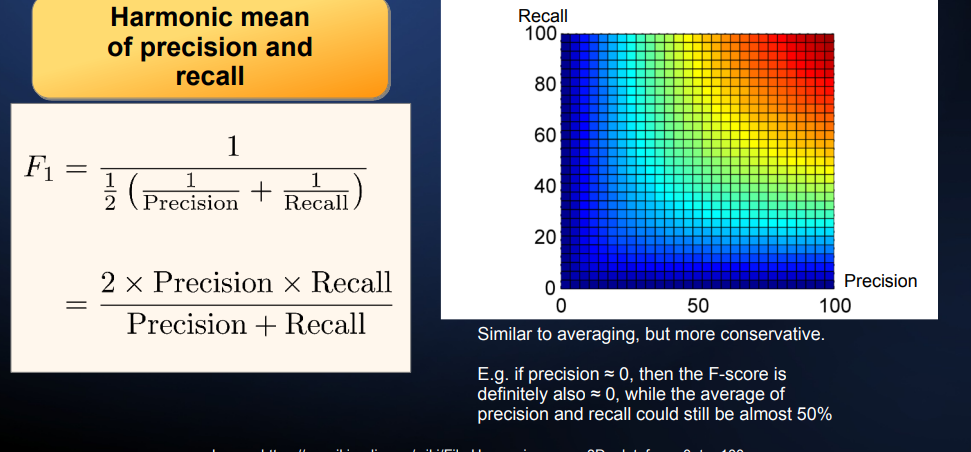
F1 score
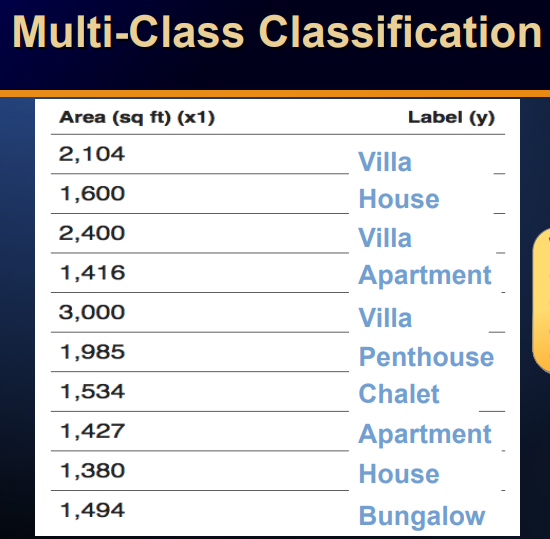
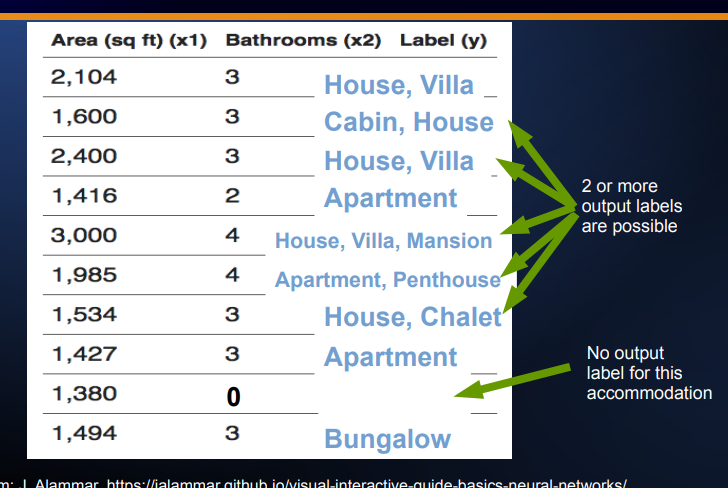
Multi-Class classification
not just yes/no, but more classes
Multi-Label Classification
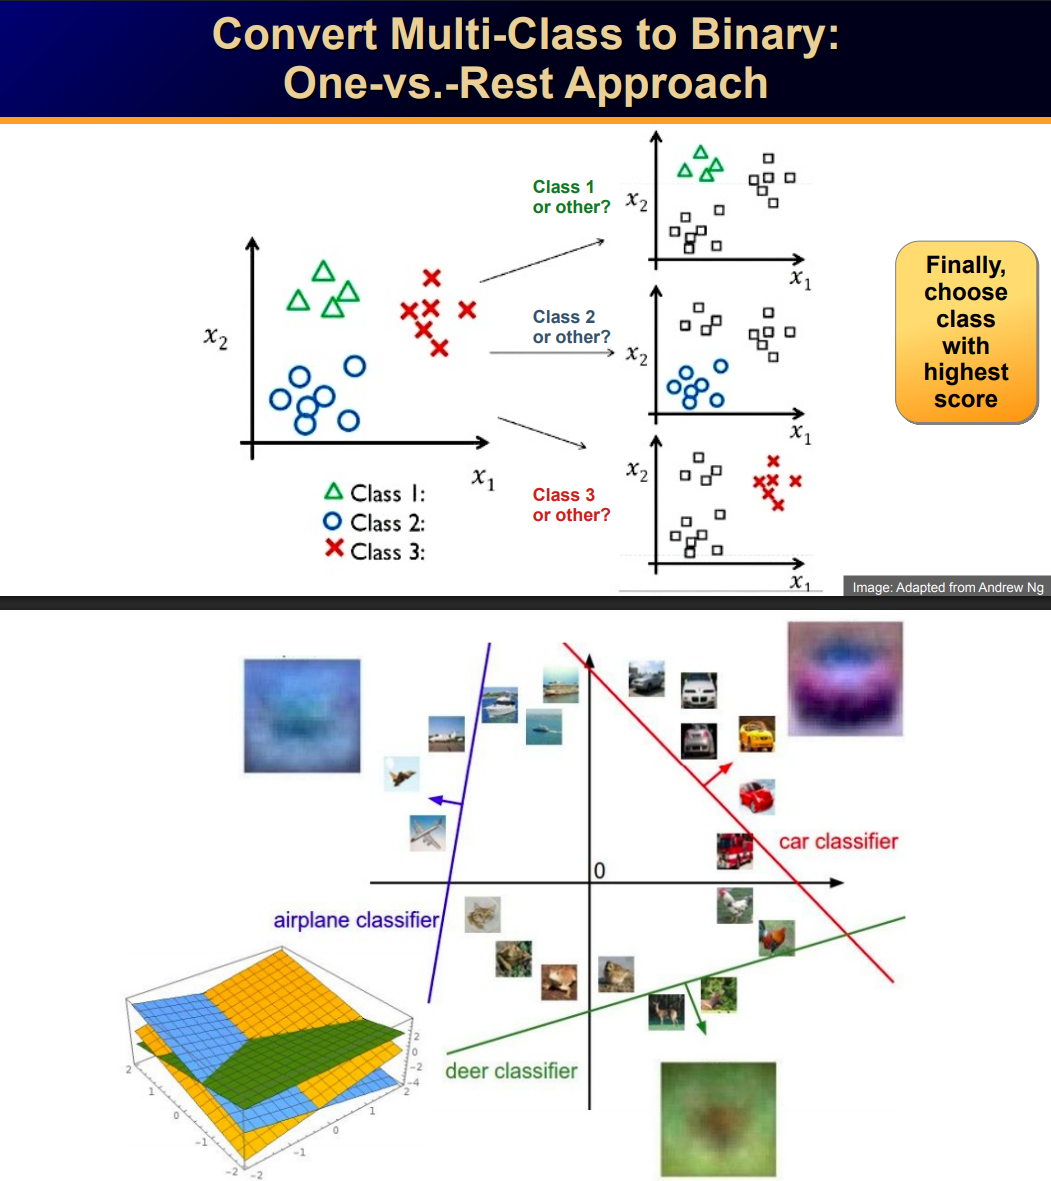
convert multi class to binary classification: One-vs.-Rest Approach
test membership to each single class, output the one with the highest acceptance score
Convert Multi-Label to Binary Classification: Binary Relevance
Do one-vs. rest but choose all accepted classes