Review- Chapter 8 Statistics
1/21
Earn XP
Description and Tags
Name | Mastery | Learn | Test | Matching | Spaced | Call with Kai | Chat |
|---|
No analytics yet
Send a link to your students to track their progress
22 Terms
Statistical inference
drawing a conclusion about a population parameter based on a sample statistic
Confidence Interval
used to estimate the value of a parameter with a range of plausible values
estimate population proportion(p) with a z test
" I am % confident that the true proportional of ALL is within the interval__to__)
Width of CI=1/√n
CI increase →width increase →z* increase
CI decrease →width decrease →ME and SE decrease
MORE narrow graph
decrease CI or Increase n
Higher CI
accept a wider interval OR increase n
*MUST compare to population, not only the sample
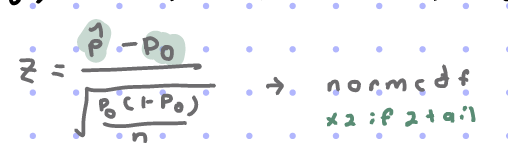
1 Proportion Z test
Confidence Level
“if you took ____samples and constructed the resulting confidence interval, the true proportion of ALL___ will be in __%(as a number) of these intervals”
increase
Significance test
Assess the plausibility of a particular claim about a parameter
TEST claim about the population(p) with a z-interval
CONDITIONS
Random sample(SRS)
n1 p1 >=10, n1(1- p1 )>=10
The sample size is <= 10% of the population size
condition of independence & not population >10n =okay!
the increase in variation due to the dependence almost offsets the decrease due to a relatively large sample
STEPS
Title
Conditions
Hypothesis, label
Test statistic→pvalue→diagram(if need)
Conclusion in context, doubts of validity
Compare p-value with α, level of significance
compare test stat to z*
“Since p value _α, there is/is not statistically significant evidence to reject the null hypothesis, that is there is/is not statistically significant evidence…’
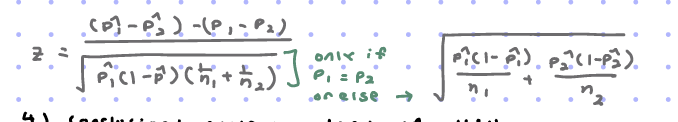
Pooled estimate
p̂ =total success in BOTH sample size/total sample size
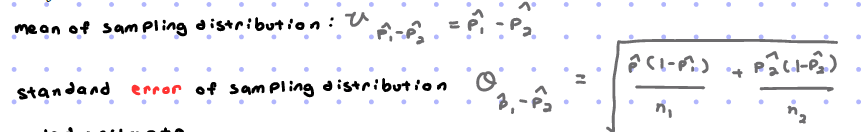
means and standard error of sampling distribution formula
P value
probability of obtaining a sample statistics as EXTREME or MORE EXTREME than one obtained by the null hypotheses( Ho ) is assumed to be true
small(<0.05,0.1)→ sufficient evidence to reject Ho
z*
Critical z
Ways to increase z*
farther p̂ from p
sample size decrease
po farther from 0.5
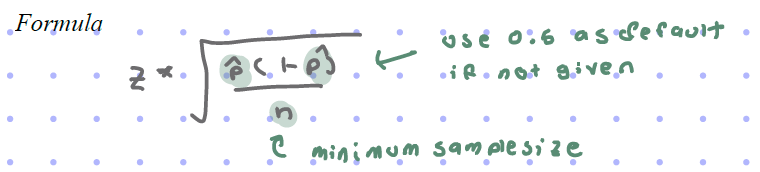
Margin of error
exactly ½ the width of CI
determined by…
small MOE→ large n
how MUCH statistic typically varies from parameter σp̂
how confident do we want our answer to be z*
MATH
z*√((p̂(1-p̂))/n
use 0.5 for p̂ if not given
Hypothesis
Ho = null hypothesis, must use an = sign
Ha= alternate hypothesis, can use <, >, <=,>=, ≠
defines the parameter of interest → refers to the population
p̂
sample proportion
po
assumed proportion in the null hypotheses(Ho ), the given in text
2 tail
≠
2p(z____)
1 tail
either < or >
in context, could be testing for strength, effectiveness…
Errors
are inversely related
Type I error (α)
rejecting the null hypotheses(Ho ) when it is true
increase if α increase
Type II error(β)
failing to reject null hypotheses(Ho )when its false
MORE likely for small n
*the only way to have power
Power
(1-β)
probability that type II error does not occur → correctly rejecting null hypotheses(Ho )when its false
influenced by α
Power Increase by…
n Increase
α Increase
SE decrease
True parameter further from null
Difference of 2 Proportions
CONDITIONS
2 samples are taken randomly or randomly assigned
n1p̂1 , n1(1-p̂1), n2p̂2, n2(1-p̂2) >=5
The sample size is <= 10% of the population size
Confidence Interval of Difference of 2 Proportions
Captures 0
yes → __% confident that there is no difference between p1 and p2
→means that 1 value is positive, 1 value is negative
no → __% confident that there is a difference between p1 and p2
→not plausible for there to be no difference
n can sometimes be split in half
“the true difference in proportion between___and___is”
2 groups having the SAME “proportion”→ risk ratio =1, so for a positive/greater proportion than the other CI range is the decimal +1.
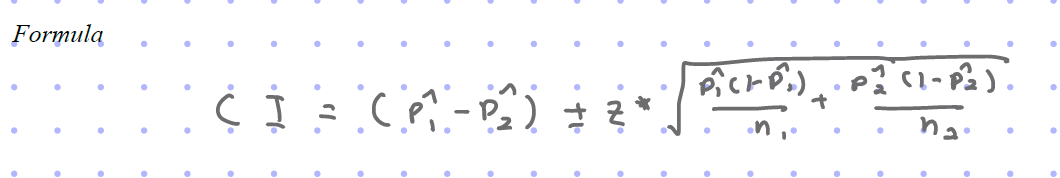
Test statistic of Difference of 2 Proportions
STEPS
name 2 proportion z test
result → C up, C Low
Conditions
Hypotheses
Test statistic → p value → diagram(if need)
Conclusion in context, doubts of validity
compare p value and α