Module 4: Tests for Hypothesis (Problem Solving)
1/9
There's no tags or description
Looks like no tags are added yet.
Name | Mastery | Learn | Test | Matching | Spaced |
|---|
No study sessions yet.
10 Terms
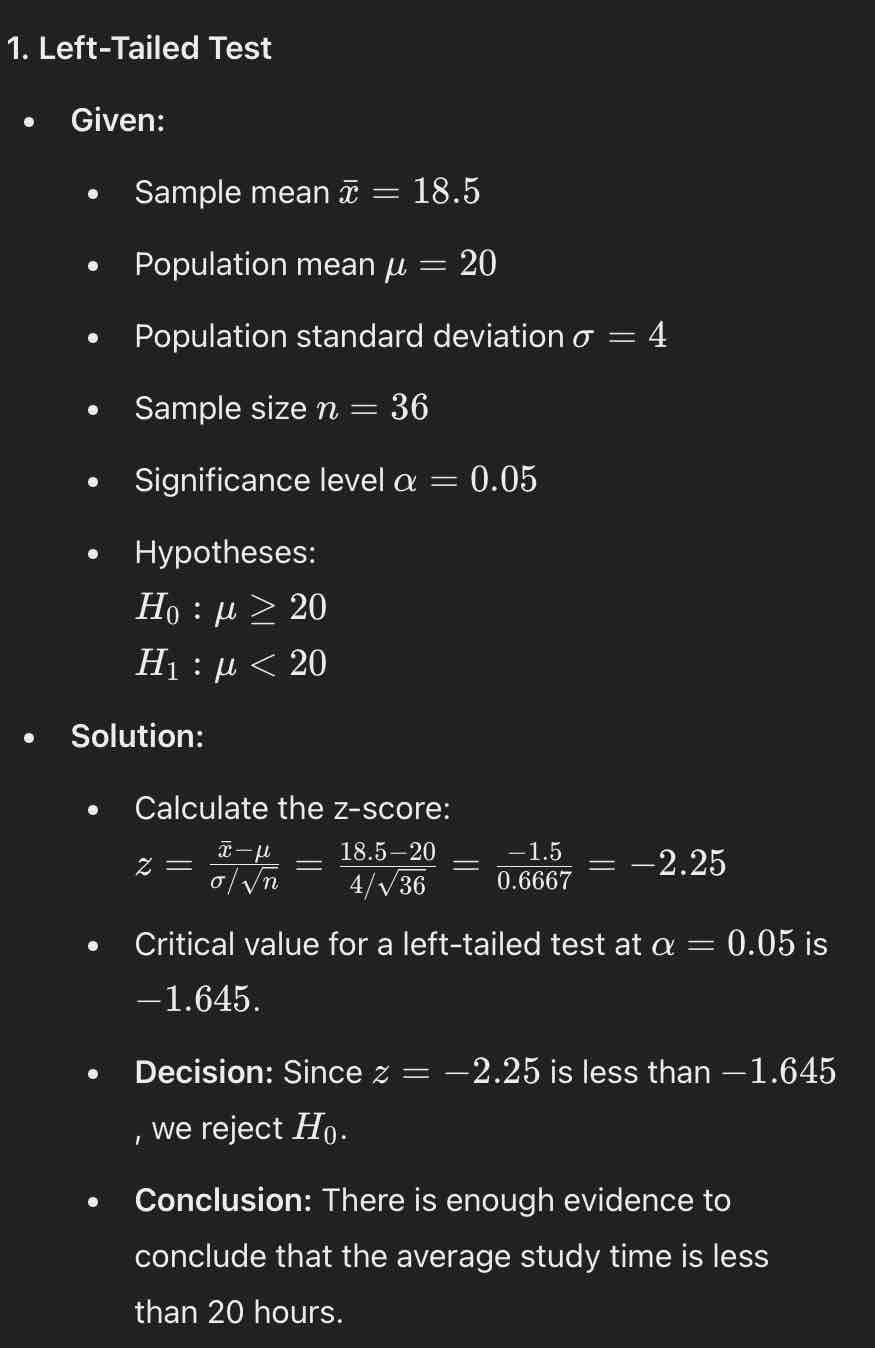
Z score: -2.25
Critical value: -1.645
Decision: Since z = -2.25 is less than -1.645, we reject H0
Conclusion: There is enough evidence to conclude that the average study time is less than 20 hours.
A university claims that the average time students spend studying each week is at least 20 hours. A random sample of 36 students has a mean study time of 18.5 hours with a known population standard deviation of 4 hours. At a 0.05 significance level, test if the average study time is less than 20 hours.
Solution:
z-score: 1.52
Critical value: 2.33
Decision: Since z = 1.52 is less than 2.33, we do not reject H0.
Conclusion: There is not enough evidence to conclude that the cars’ average fuel efficiency is greater than 25 miles per gallon.
Right-Tailed Test
A car manufacturer claims that its new model has an average fuel efficiency of at most 25 miles per gallon. To test this claim, a sample of 40 cars showed a mean of 26.2 miles per gallon with a known population standard deviation of 5 miles per gallon. At a 0.01 significance level, test if the cars’ average fuel efficiency is greater than 25 miles per gallon.
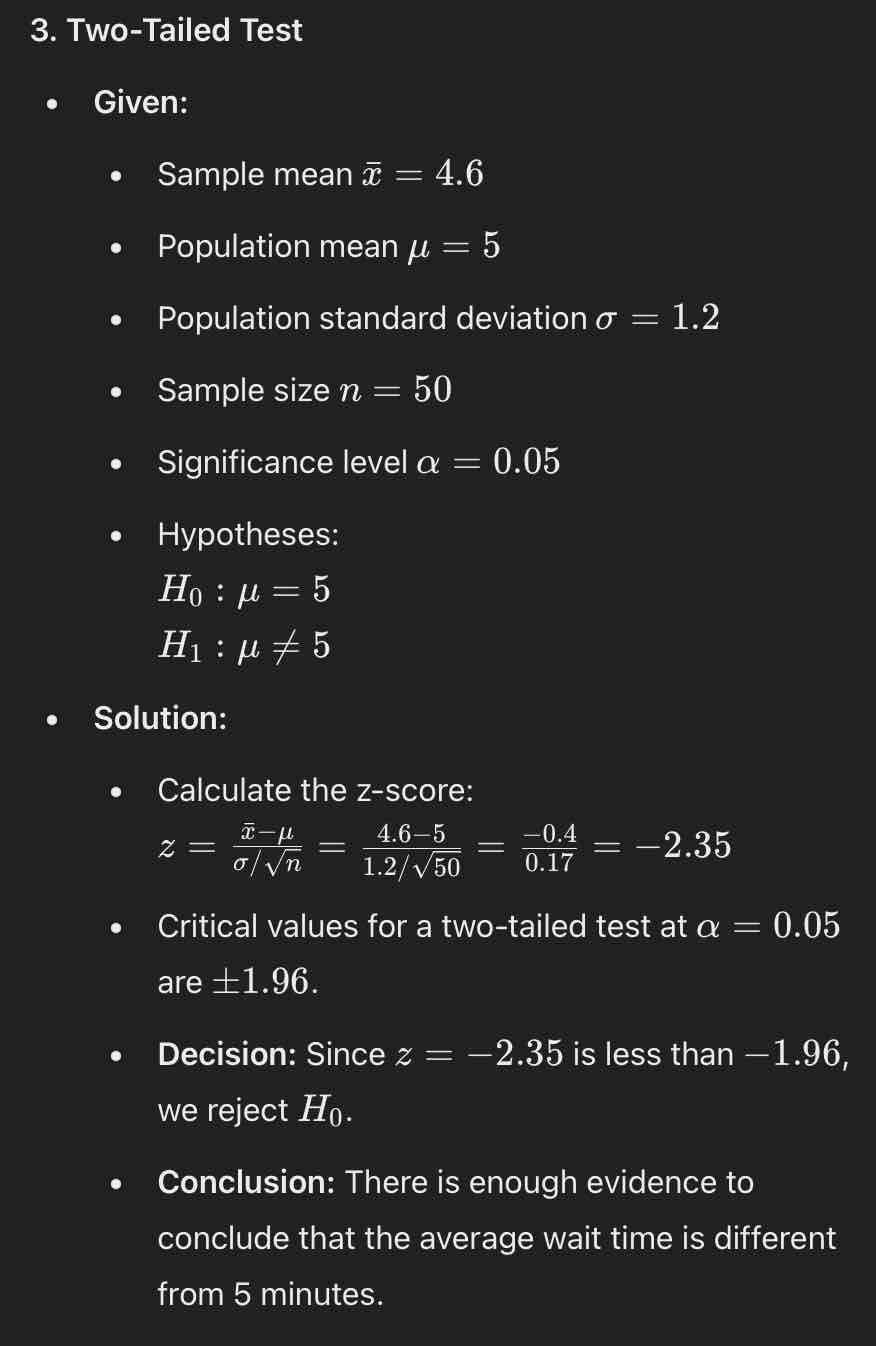
Z score: -2.35
Critical value: ±1.96
Decision: Since z = -2.35 is less than -1.96, we reject H0
Conclusion: There is enough evidence to conclude that the average wait time is different from 5 minutes
A bank claims that the average time customers wait in line is 5 minutes. A random sample of 50 customers showed an average wait time of 4.6 minutes, with a known population standard deviation of 1.2 minutes. At a 0.05 significance level, test if the average wait time is different from 5 minutes.
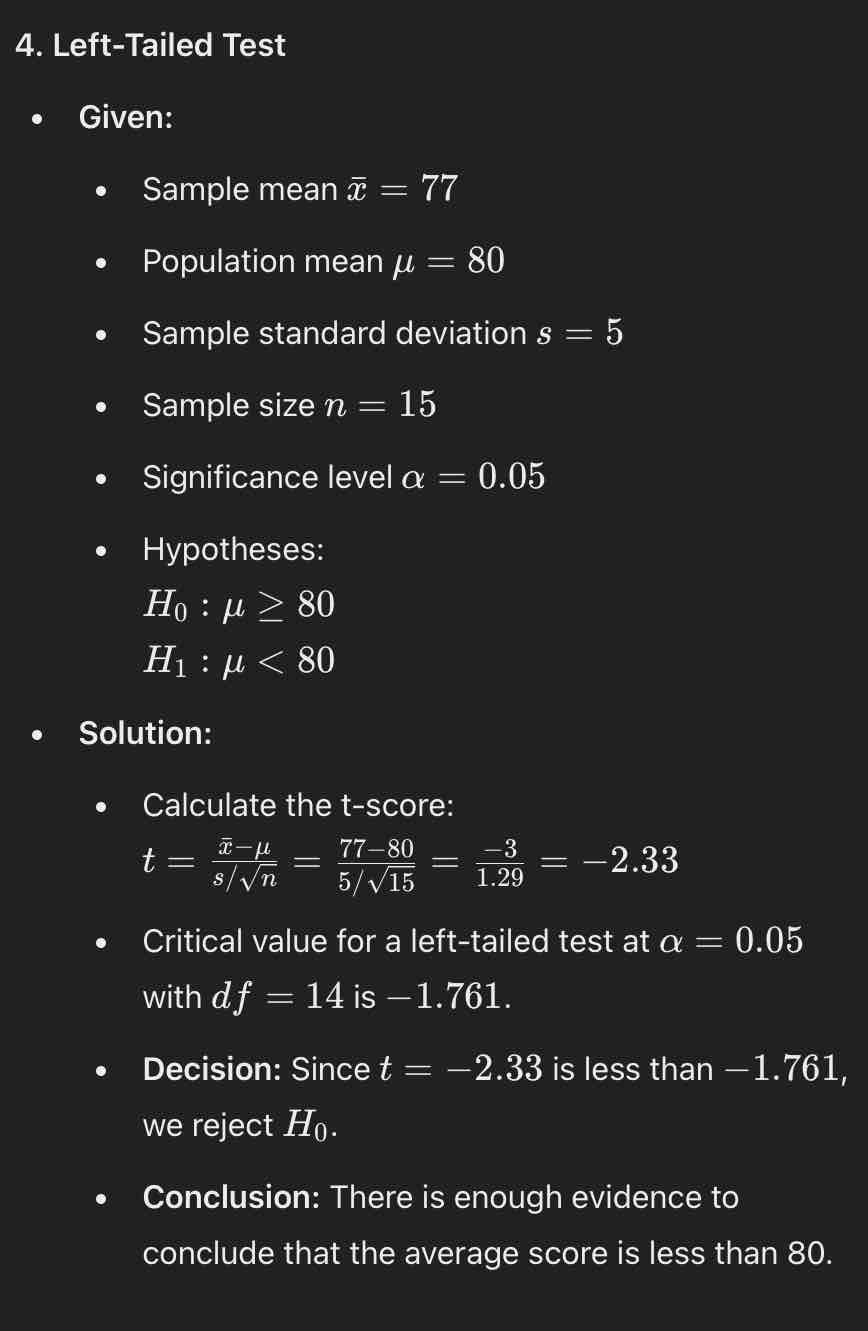
Z score: -2.33
Critical value: -1.761
Decision: Since z = -2.33 is less than -1.761, we reject H0
Conclusion: There is enough evidence to conclude that the average score is less than 80
An educator claims that students in her school district score an average of 80 on standardized tests. A sample of 15 students scored an average of 77, with a sample standard deviation of 5. Test at a 0.05 significance level if the average score is less than 80.
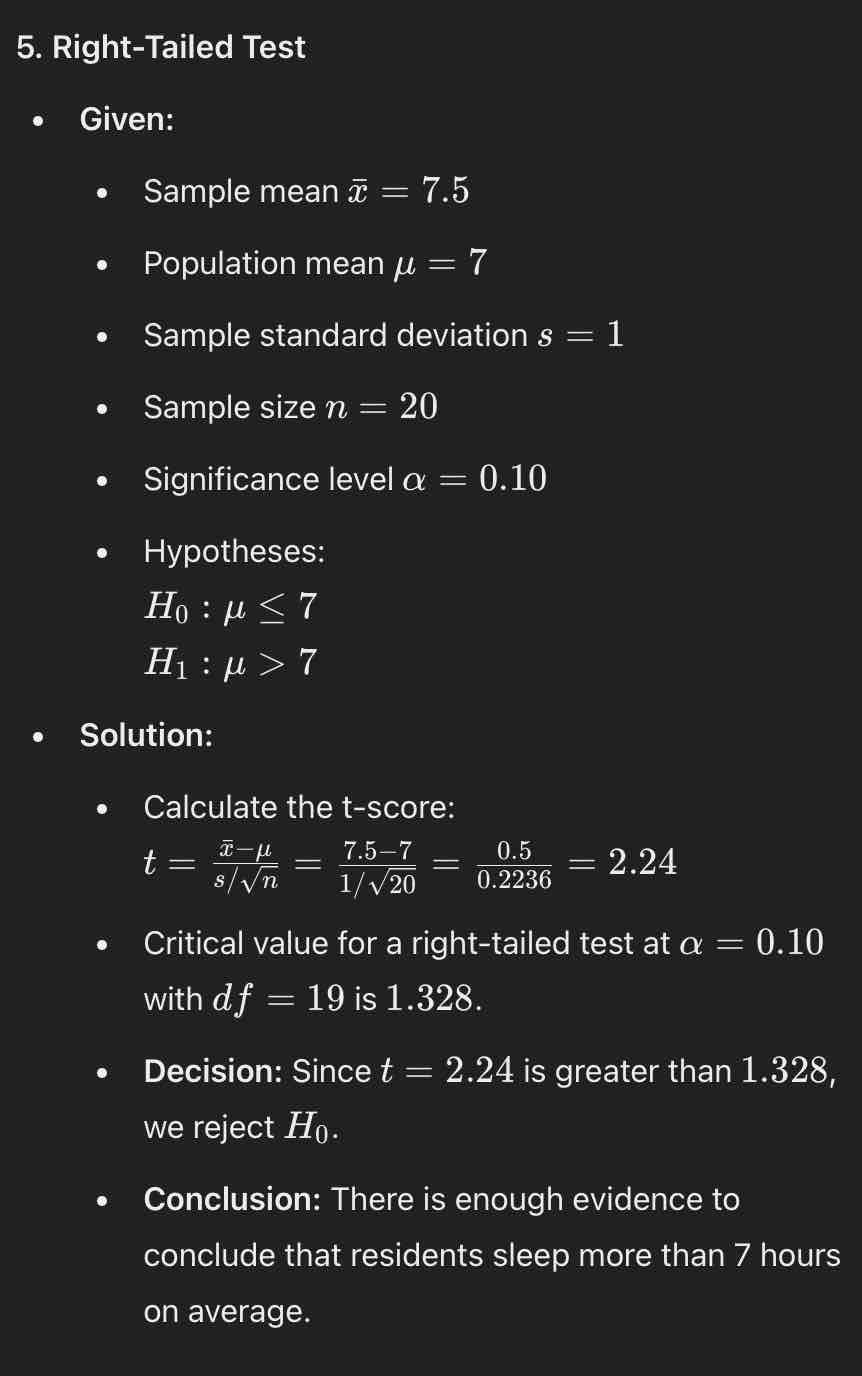
Z score: 2.24
Critical value: 1.328
Decision: Since z = 2.24 is greater than 1.328, we reject H0
Conclusion: There is enough evidence to conclude that residents sleep more than 7 hours on average
A health organization claims that the average hours of sleep per night is no more than 7 hours for people in a certain city. A sample of 20 residents recorded an average of 7.5 hours of sleep per night with a sample standard deviation of 1 hour. At a 0.10 significance level, test if the residents sleep more than 7 hours on average.
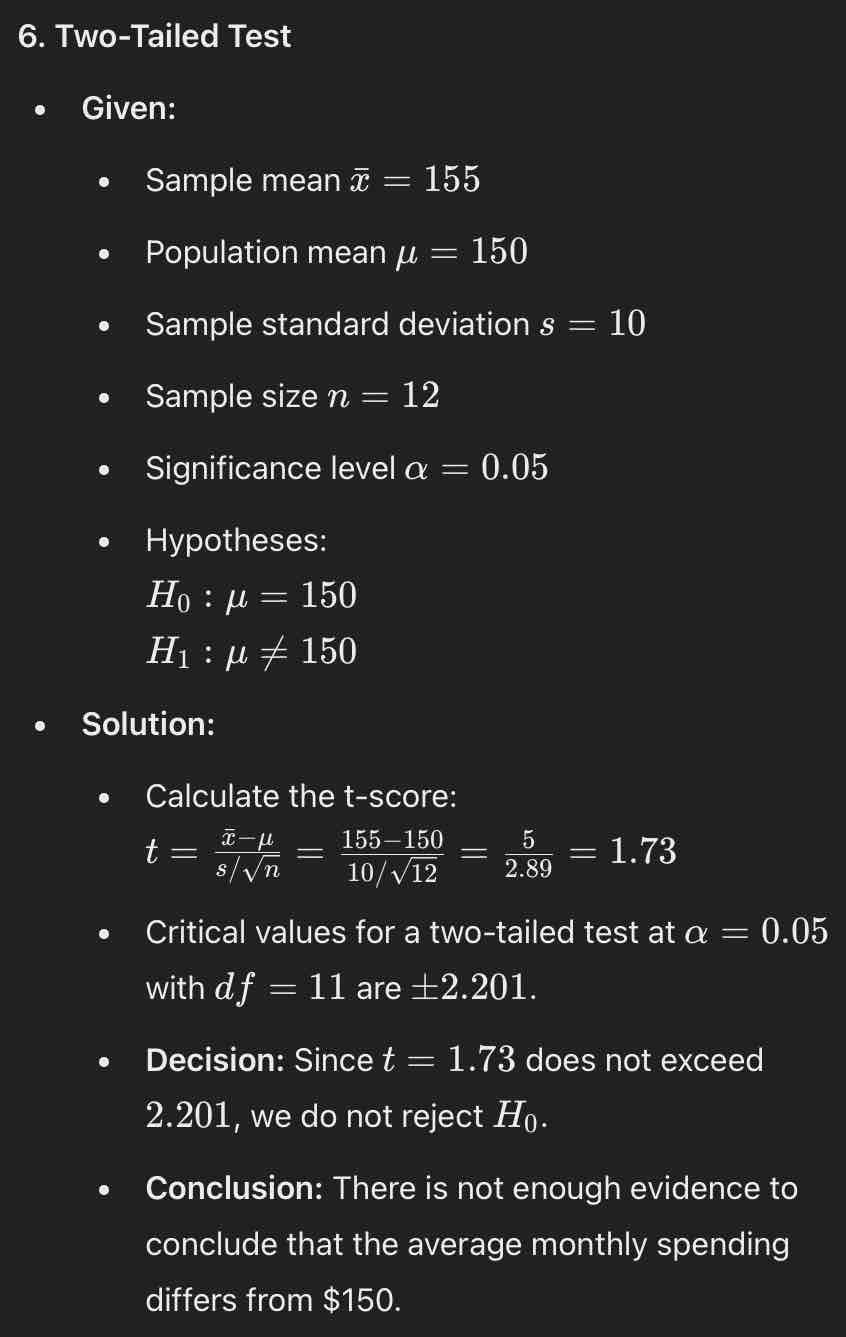
Z score: 1.73
Critical value: ±2.201
Decision: Since t = 1.73 is less than 2.201, we do not reject H0
Conclusion: There is not enough evidence to conclude that the average monthly spending differs from $150
A manager believes that the mean monthly spending on entertainment by their employees is $150. A sample of 12 employees showed a mean of $155 with a standard deviation of $10. Test at a 0.05 significance level if the average monthly spending on entertainment is different from $150.
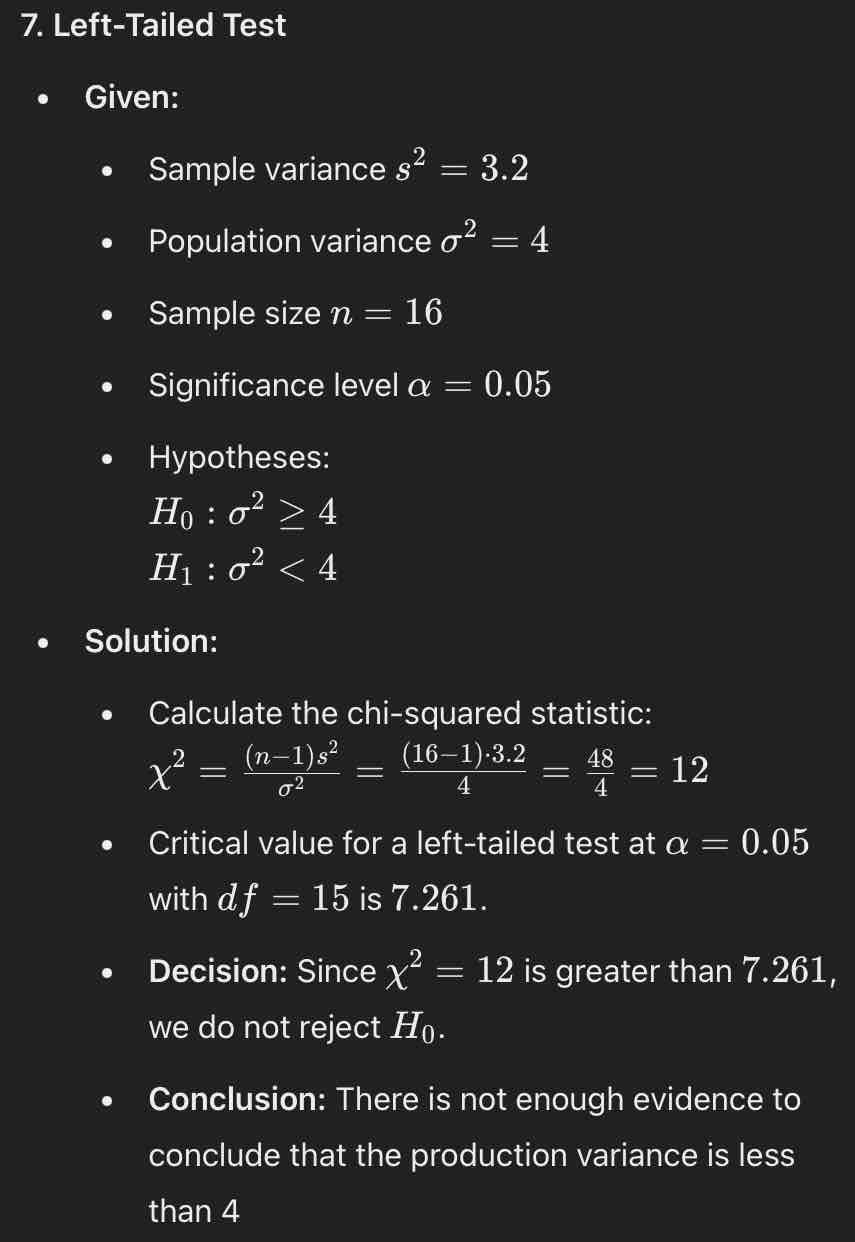
Chi-squared statistic: 12
Critical value: 7.261
Decision: Since χ² = 12 is greater than 7.261, we do not reject H0
Conclusion: There is not enough evidence to conclude that the production variance is less than 4
A machine's production process is considered consistent if the variance in output weight is no more than 4 kg². A sample of 16 outputs had a variance of 3.2 kg². At a 0.05 significance level, test if the production variance is less than 4 kg²
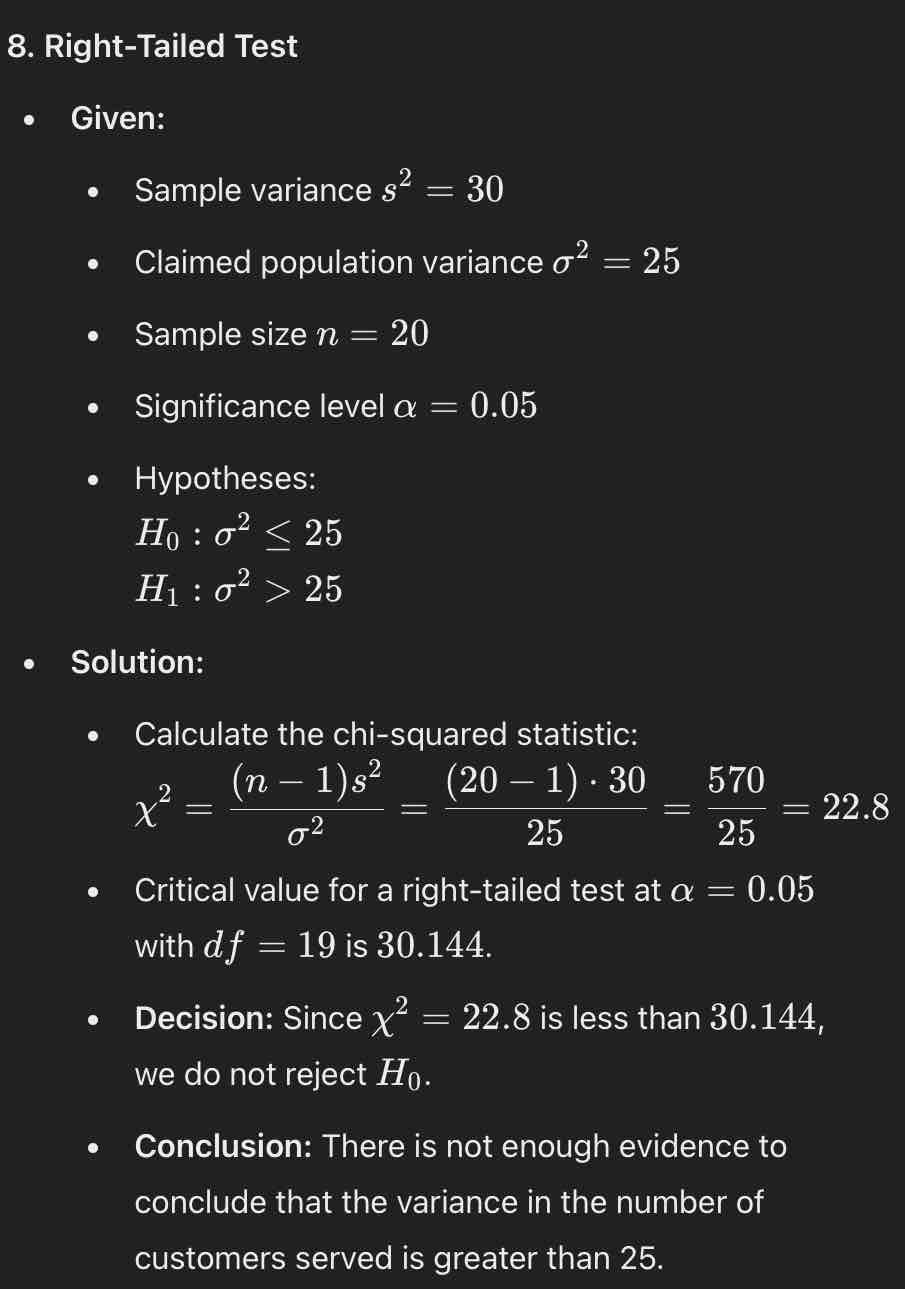
Chi-squared statistic: 22.8
Critical value: 30.144
Decision: Since χ² = 22.8 is less than 30.144, we do not reject H0
Conclusion: There is not enough evidence to conclude that the variance in the number of customers served is greater than 25
A restaurant manager believes that the variance in the number of customers served each day is at most 25. Over a 20-day period, the variance was observed to be 30. At a 0.05 significance level, test if the variance in the number of customers served is greater than 25.
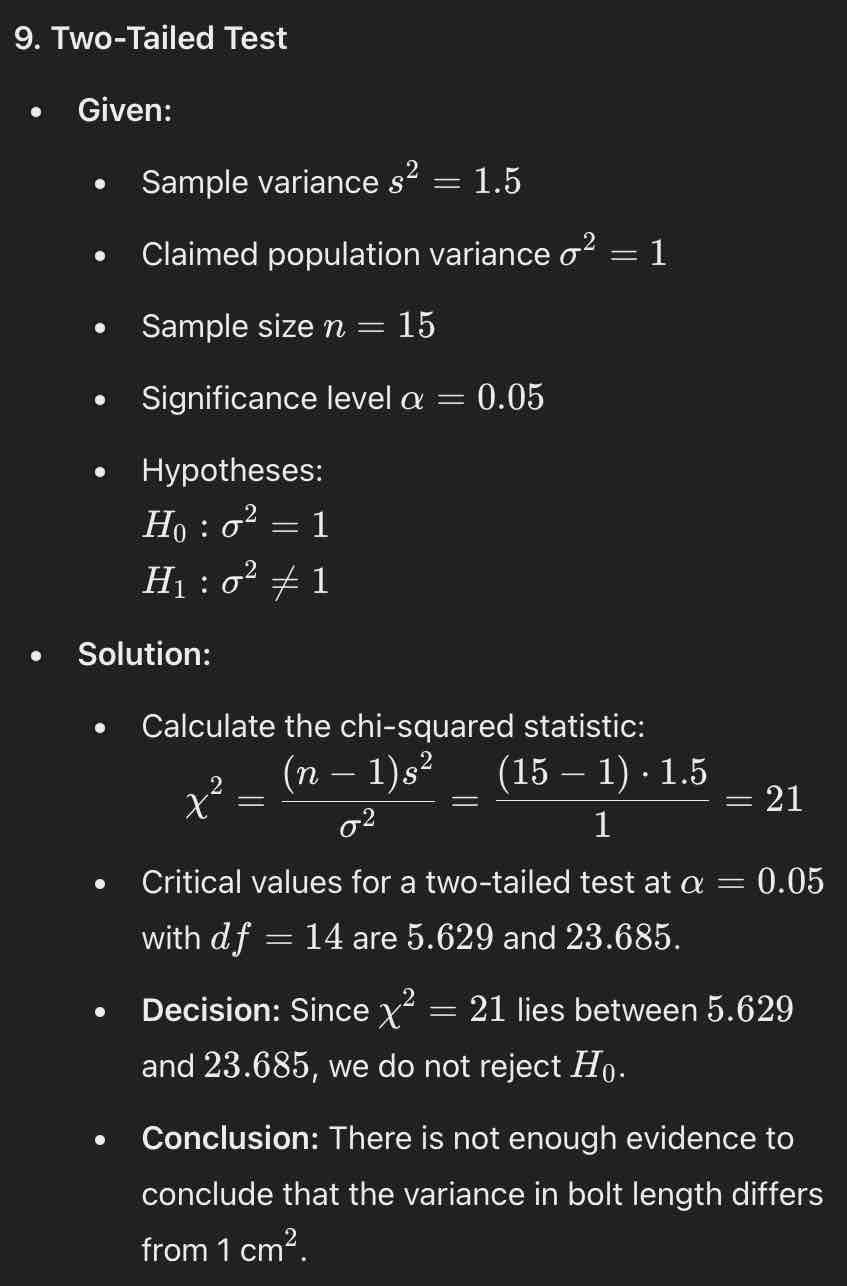
Chi-squared statistic: 21
Critical values: 5.629 and 23.685
Decision: Since χ² = 21 lies between 5.629 and 23.685, we do not reject H0
Conclusion: There is not enough evidence to conclude that the variance in bolt length differs from 1 cm²
A manufacturer claims that the variance in the length of bolts produced is 1 cm². A sample of 15 bolts has a variance of 1.5 cm². Test at a 0.05 significance level if the variance in bolt length differs from 1 cm².
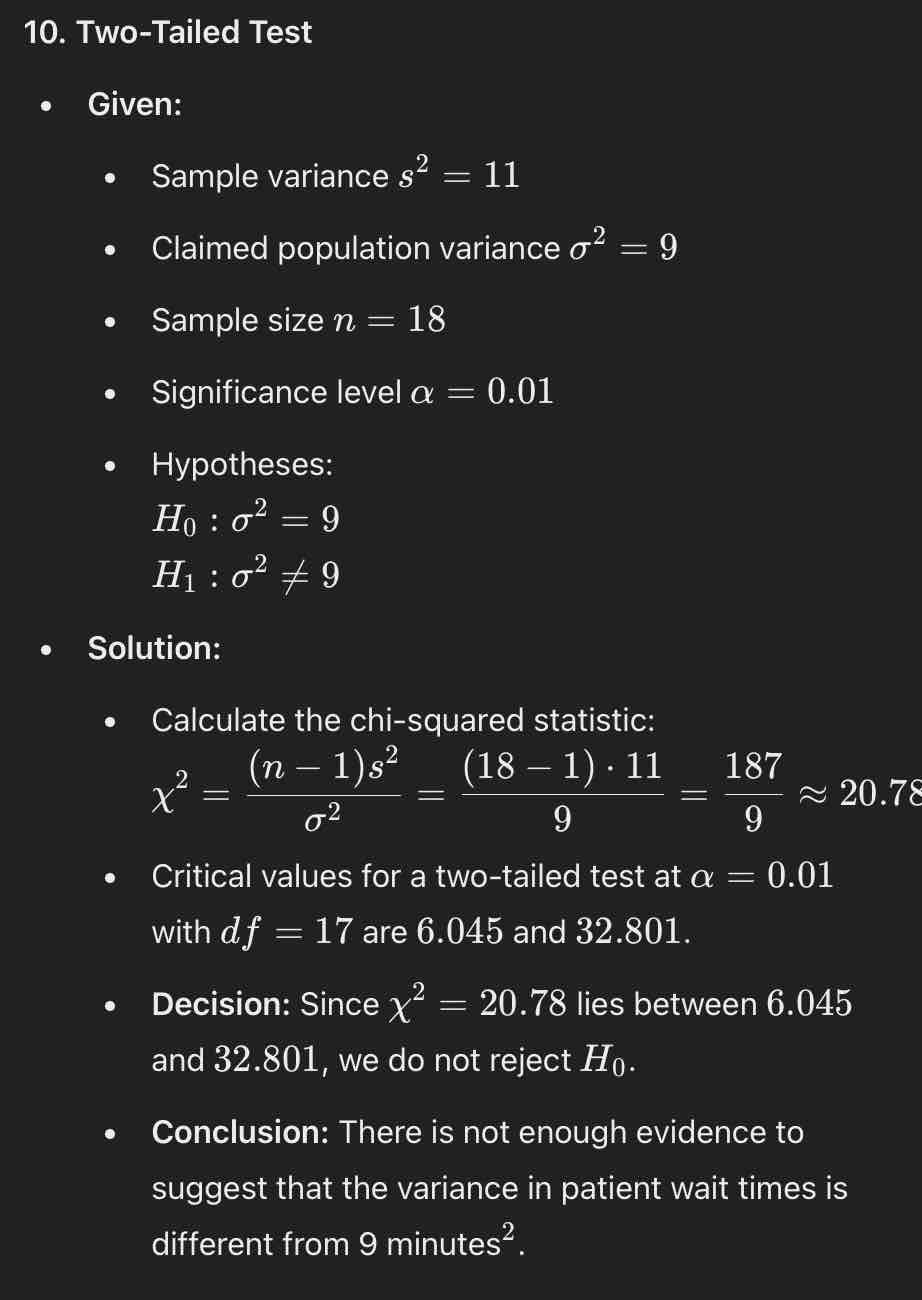
Chi-squared statistic: 20.78
Critical values: 6.045 and 32.801
Decision: Since χ² = 20.78 lies between 6.045 and 32.801, we do not reject H0
Conclusion: There is not enough evidence to suggest that the variance in patient wait times is different from 9 minutes²
A hospital administrator claims that the variance in patient wait times is 9 minutes22. A sample of 18 patients has a variance of 11 minutes22. At a 0.01 significance level, test if there is enough evidence to suggest that the variance in patient wait times is different from 9 minutes².