2.8 Market Failure
1/55
There's no tags or description
Looks like no tags are added yet.
Name | Mastery | Learn | Test | Matching | Spaced | Call with Kai |
|---|
No analytics yet
Send a link to your students to track their progress
56 Terms
Market Failure
misallocation of resources in a free market leading to loss of allocative efficiency
Externalities
External impacts on a third party not involved in an economic transaction. These can be positive or negative and are often referred to as spillover effects.
Public Goods
Goods that are beneficial to society but under-provided by the free market because they are non-excludable and non-rivalrous in consumption (e.g., flood defences).
Common Pool Resources
Finite resources with no private ownership that are shared collectively. They are non-excludable but rivalrous in consumption (e.g., fishing grounds).
Demerit Goods
Goods that are harmful to society, resulting in over-provision and an over-allocation of resources (e.g., cigarettes).
Merit Goods
Goods that are beneficial to society but are often under-provided and under-allocated by the free market (e.g., schools).
Marginal Private Benefit (MPB)
The additional benefit received from the consumption or production of one additional unit of output.
Marginal Private Cost (MPC)
The additional cost incurred through the consumption or production of one additional unit of output.
Marginal Social Benefit (MSB)
The total benefit to society from one additional unit of output, calculated as MSB = \text{Private Benefit} + \text{External Benefit}.
Marginal Social Cost (MSC)
The total cost to society from one additional unit of output, calculated as MSC = \text{Private Cost} + \text{External Cost}.
Socially Optimum Output
The level of output where MSB = MSC. At this point, market failures are accounted for and no market failure exists.
Allocative Efficiency
Achieved at the socially optimum level of output (Q_{opt}) where community surplus (the sum of consumer and producer surplus) is maximised.
Market Failure Diagram Labels
The Y-axis represents costs/benefits, the supply curve is labelled S = MSC, and the demand curve is labelled D = MSB.
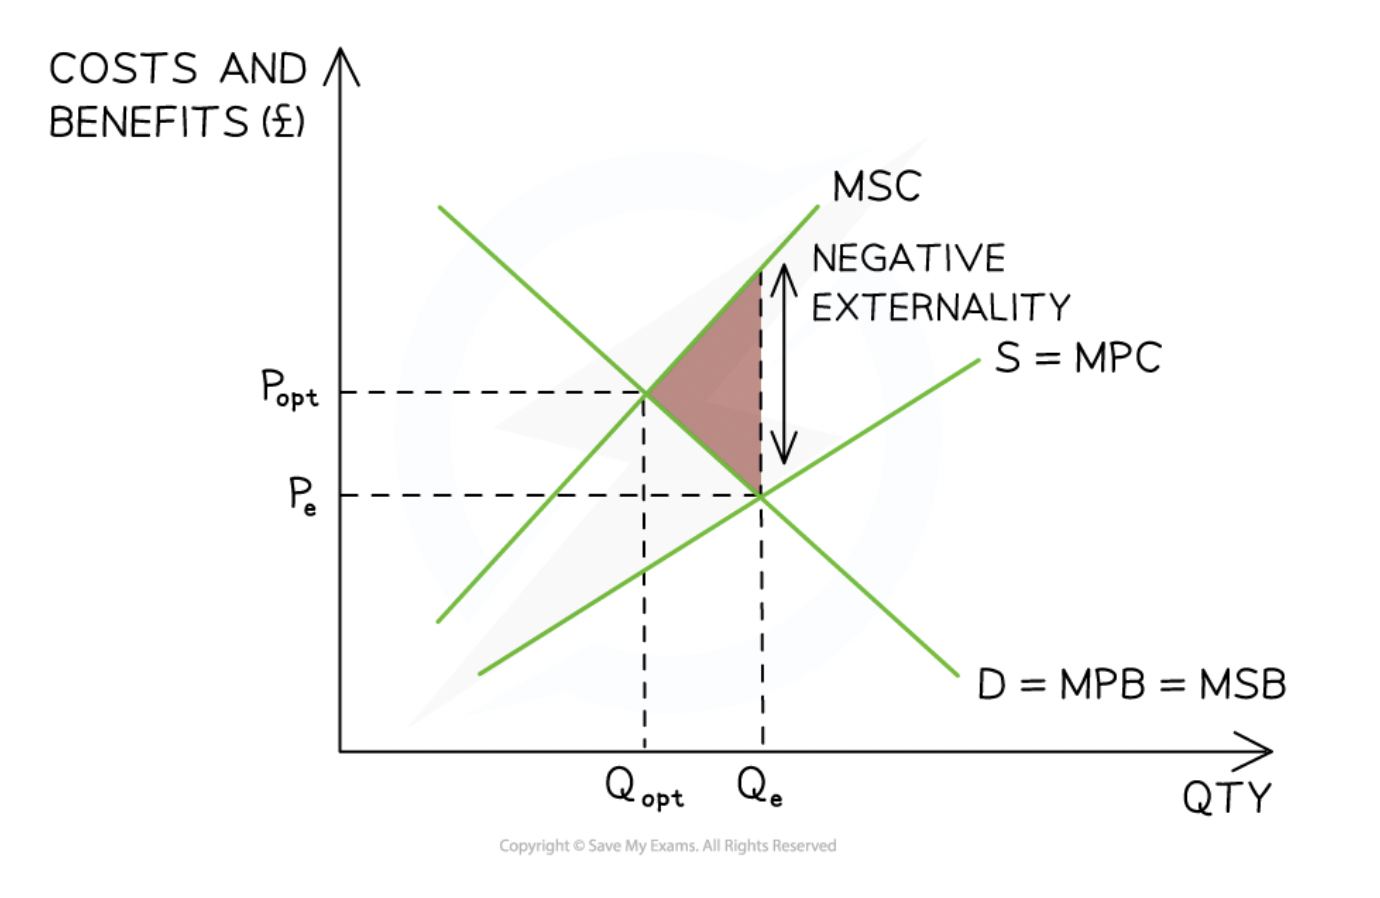
Negative Externalities of Production
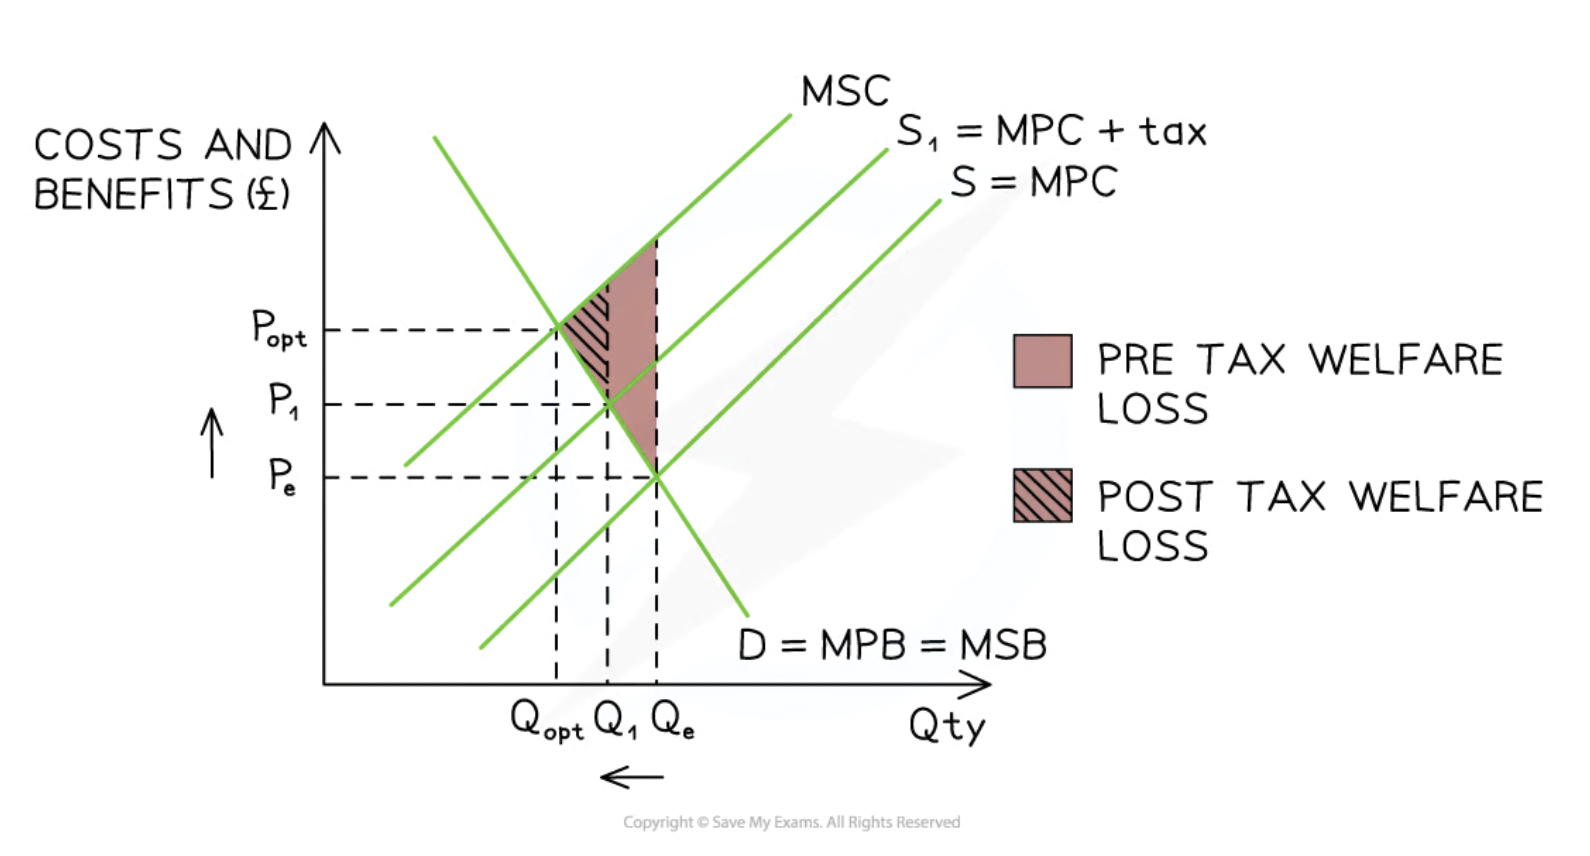
Occur when the production of a good/service creates external costs for third parties (e.g., air pollution). The market fails due to over-provision because producers only consider Marginal Private Costs (MPC) rather than Marginal Social Costs (MSC).
Negative Externalities of Production Diagram Analysis
Assumptions: MSB = MPB as the focus is on the producer side.
Free-market Equilibrium: Found where MPC = MSB (at quantity Q_{e}).
Socially Optimum Equilibrium: Found where MSC = MSB (at quantity Q_{opt}).
Market Failure: private costs are only considered by the producers and not the external costs, if external costs were considered, the supply would decrease and they would be sold at a higher price
the factors of production used to manafucture this over provision repesent a welfare to society
To be effiecient, fewer factors of production should be allocated to this good/service
Government interbention → to reduce the welfare loss
Welfare Loss (Negative Production Externality)
The loss to society represented by a triangle pointing back toward the socially optimal quantity (Q_{opt}). It represents the cost to society of resources allocated to over-production.
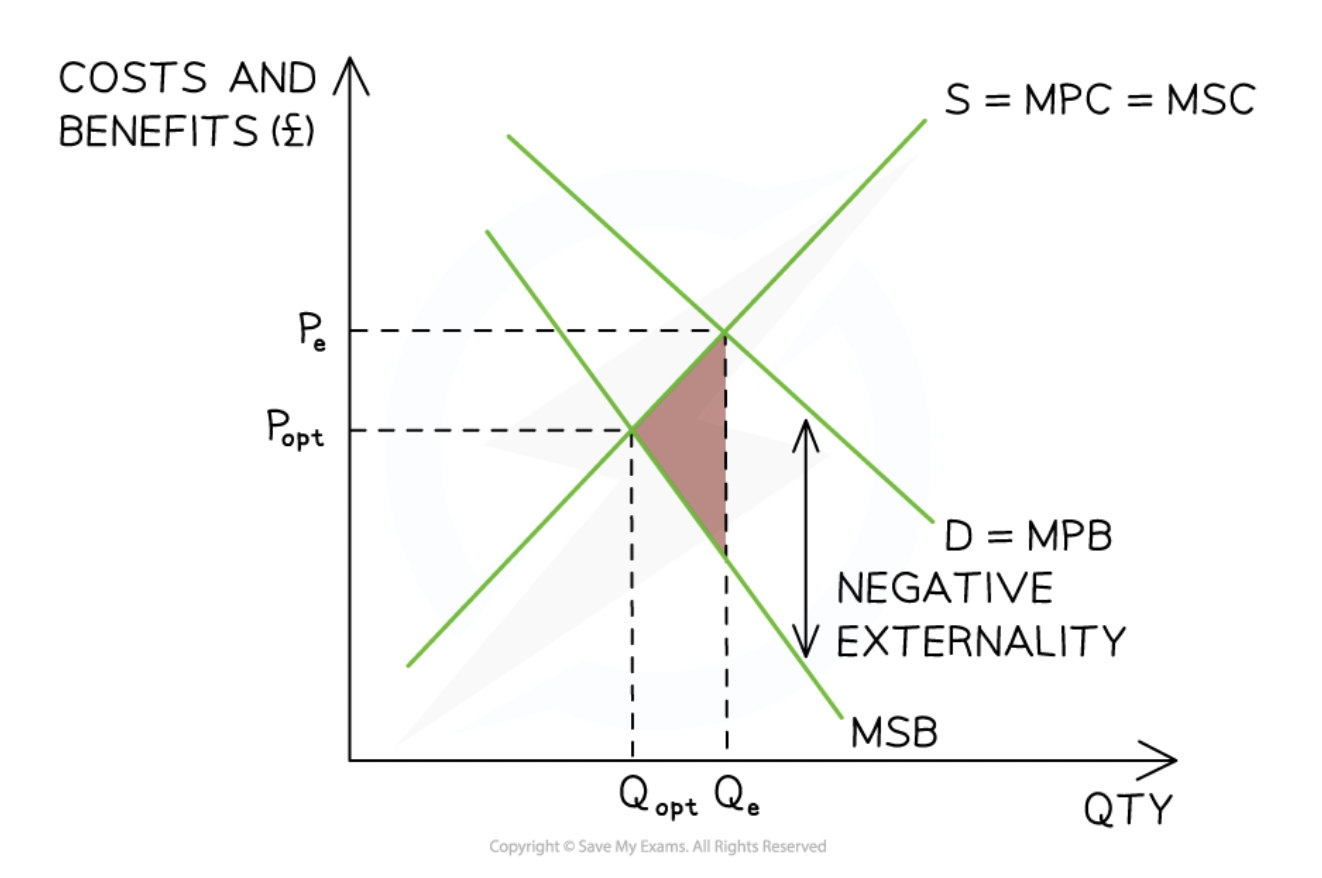
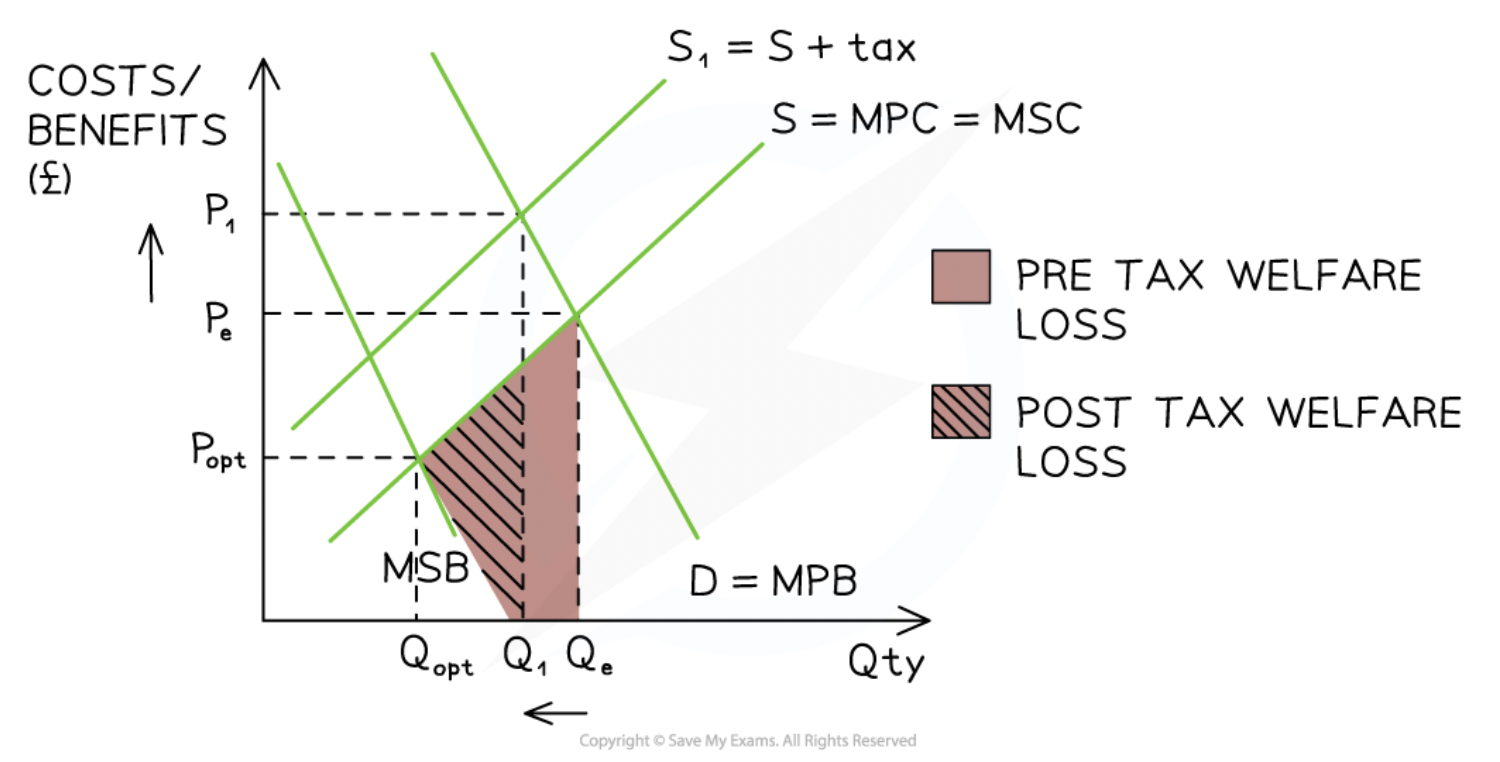
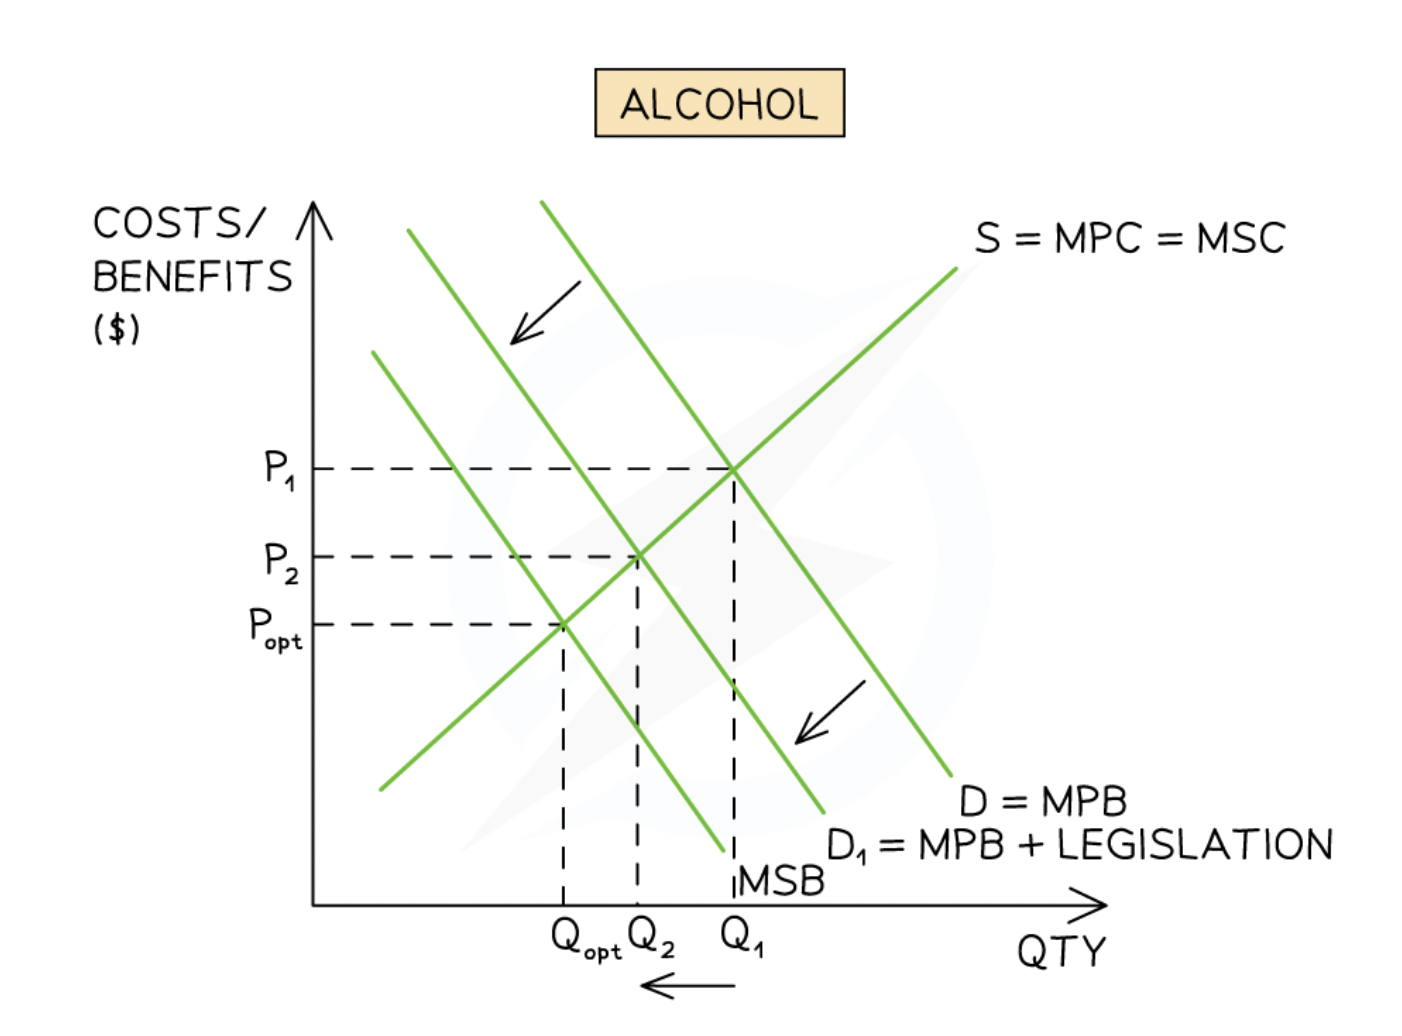
Negative Externalities of Consumption
Market failure due to over-consumption of goods as only the private costs are considered by the consumers and not the external cost
If external costs were considered, demand would decrease and they would be sold at a lower price
Examples: Cigrattes, alchol and junk food
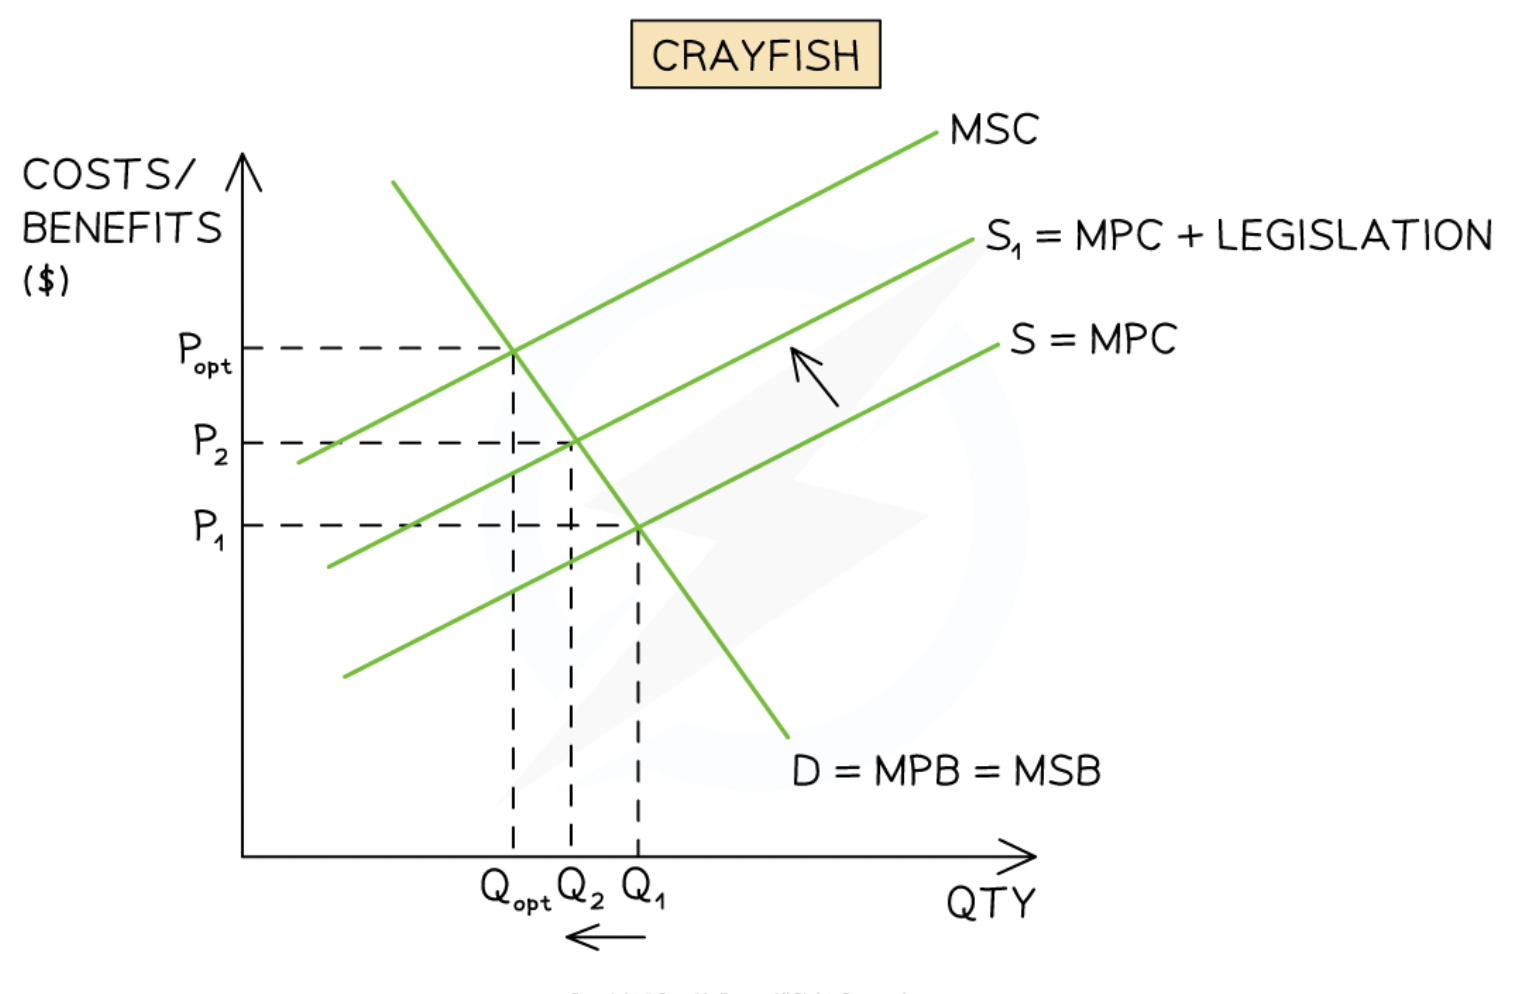
Negative Externalities of Consumption Diagram Analysis
Assumptions: MSC = MPC as the focus is on the consumer side.
Free-market Equilibrium: Found where MPB = MSC (at quantity Q_{e}).
Socially Optimum Equilibrium: Found where MSB = MSC (at quantity Q_{opt}).(no market failure at this)
Market Failure: Over-consumption equal to Q{e} - Q{opt}.
Therefore factors of production used to manufcate this overconsumption - is repsented by the welfare loss
To be socially effiecient, few factors of production should be allocated to this resouce
government should intervence with taxes, legislation, education etc'); to force market to be more socially efficient
Demerit Goods
Goods that are harmful to consumers and create negative externalities in consumption (e.g., gambling, alcohol). They are typically over-consumed and often addictive, leading governments to intervene through taxes or regulation.
Government Intervention for Negative Externalities
Policies such as indirect taxes, legislation, or regulation designed to force a market toward social efficiency (Q_{opt}) and reduce welfare loss.
Negative externalites of production graph
Negative externalities of consumption graph
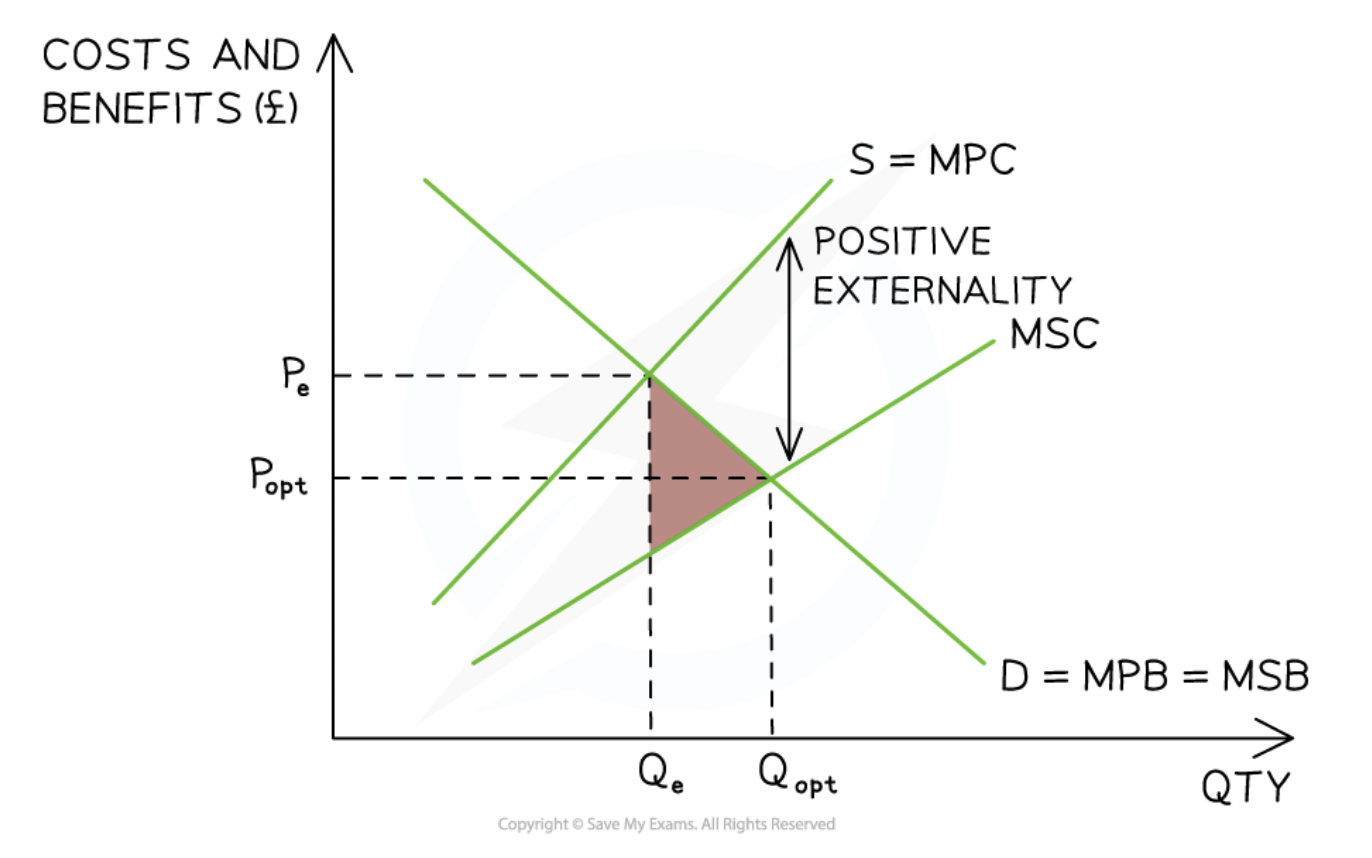
Positive Externalities of Production
Occur when the production of a good/service creates external benefits for third parties (e.g., honey production aiding crop pollination). The market fails due to under-provision because producers only consider Marginal Private Costs (MPC) and not external benefits.
Positive Externalities of Production Diagram Analysis
Assumptions: MSB = MPB as the focus is on the producer side.
Free-market Equilibrium: Found where MPC = MSB (at quantity Q_{e}).
Socially Optimum Equilibrium: Found where MSC = MSB (at quantity Q_{opt}).
Market Failure: Under-provision equal to Q{opt} - Q{e}. Resources are under-allocated compared to the social optimum.
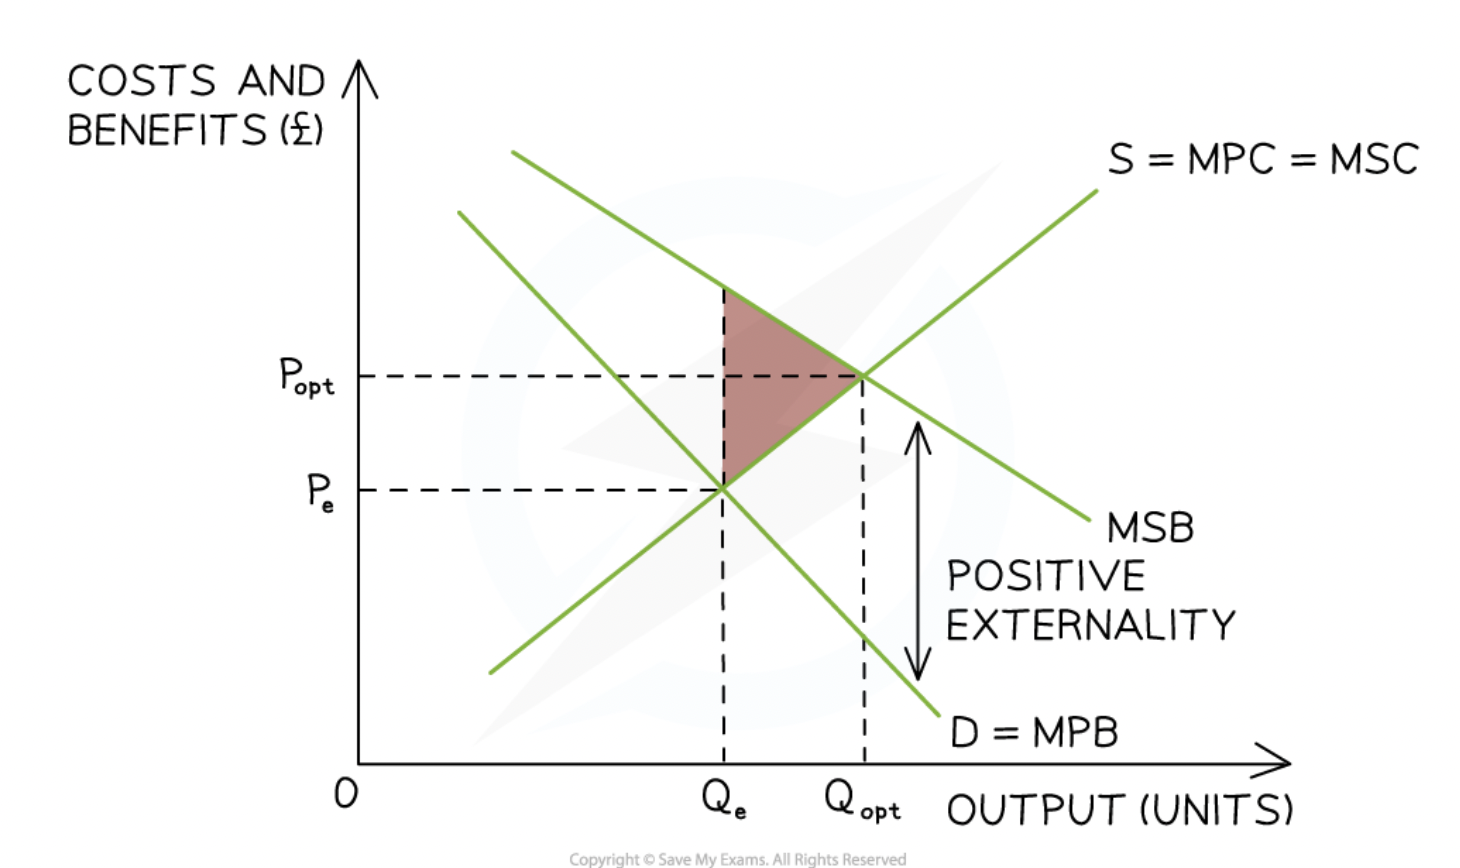
Positive Externalities of Consumption
Occur when the consumption of a good/service creates external benefits for third parties (e.g., vaccinations). The market fails due to under-consumption because consumers only consider Marginal Private Benefits (MPB) rather than Marginal Social Benefits (MSB).
Positive Externalities of Consumption Diagram Analysis
Assumptions: MSC = MPC as the focus is on the consumer side.
Free-market Equilibrium: Found where MPB = MSC (at quantity Q_{e}).
Socially Optimum Equilibrium: Found where MSB = MSC (at quantity Q_{opt}).
Market Failure: Under-consumption equal to Q{opt} - Q{e}. Societal welfare is not maximised.
Merit Goods
Goods that are beneficial to society but are under-consumed because individuals do not fully recognise the private or external benefits (e.g., education, electric cars). They generate positive externalities, leading governments to intervene via subsidies or partial provision.
Welfare Loss (Positive Externality)
Also called a potential welfare gain, this is the loss to society from consuming or producing below the socially optimum level (Q_{opt}). In a diagram, the triangle points forward toward the socially optimal quantity.
Externalities Diagram Rules
Producer Side: If the external benefit or cost is on the producer side, draw two supply curves (MPC and MSC).
Consumer Side: If the external benefit or cost is on the consumer side, draw two demand curves (MPB and MSB).
Positive externalities of production graph
Positive externalities of consumption graph
Common Pool Resources
Resources that are non-excludable (no private ownership, anyone can access them without payment) but rivalrous in consumption (they are finite and can be used up).
Non-excludable (Common Pool Resources)
A characteristic where it is difficult or impossible to prevent individuals from using a resource because no private ownership exists.
Rivalrous (Common Pool Resources)
A characteristic where one person's use of a resource reduces the amount available for others, as the supply is finite.
The Tragedy of the Commons
Occurs when common pool resources are used unsustainably, leading to negative externalities of production such as resource depletion and environmental damage.
Examples of Common Pool Resources
Ocean fishing (international waters)
Communal grazing land
Rivers and water sources
Natural rainforests
Darién Gap Case Study: The Resource
The Rosewood Cocobolo tree is a scarce resource being depleted. It sells for \$4,000 per \text{m}^3 in Panama and \$12,000 per \text{m}^3 in China.
Challenges in the Darién Gap
Illegal logging, lack of law enforcement, corruption, and violent clashes between indigenous tribes and loggers.
Solution: Collective Self-governance
Tribes work together to restrict illegal activity using local knowledge and technology (e.g., drones). Disadvantage: Illegal loggers are often better armed, leading to violence.
Solution: Legal Ownership Rights
Granting land titles to indigenous tribes so illegal logging becomes prosecuted as theft. Disadvantage: High levels of corruption mean officials may accept bribes to ignore the law.
Solution: International Agreements
Global laws to protect flora and fauna, such as Interpol seizing over 200\text{ m}^3 of illegal wood. Disadvantage: Ineffective if major consuming countries do not follow or enforce the rules.
What are the 9 solutions to address market failure?
indirect tax
carbon tax
subsidies
legislation and regulation
education
tradable permits
collective self governance
international agreement
government provision
Pigouvian Tax (Indirect Tax)
A tax placed on a product with harmful side effects to increase its price and reduce the quantity demanded or supplied. It operates on the 'polluter pays' principle.

Specific Tax on Negative Production Externality (Analysis)
The supply curve shifts left from S=MPCS=MPC to S1=MSCS1=MSC. Final Equilibrium: New equilibrium at QoptQopt where MSC=MSBMSC=MSB. Price increases and quantity decreases, successfully internalising the externality and eliminating welfare loss.
Specific Tax on Negative Consumption Externality (Analysis)
A tax on demerit goods that increases production costs, shifting the supply curve left (S \rightarrow S_{1}). The resulting higher price and lower output reduce over-consumption and societal welfare loss.
Evaluation of Indirect Taxes
Advantages: Generates government revenue and forces internalisation of external costs. - Disadvantages: Ineffective if demand is price inelastic (PED < 1), may encourage illegal markets, and can lead to unemployment in affected industries.
Carbon Tax
A tax on producers who emit greenhouse gases based on the carbon content of their emissions. It shifts the supply curve left (S \rightarrow S_{1}), raising costs to reduce the carbon footprint and atmospheric pollution.
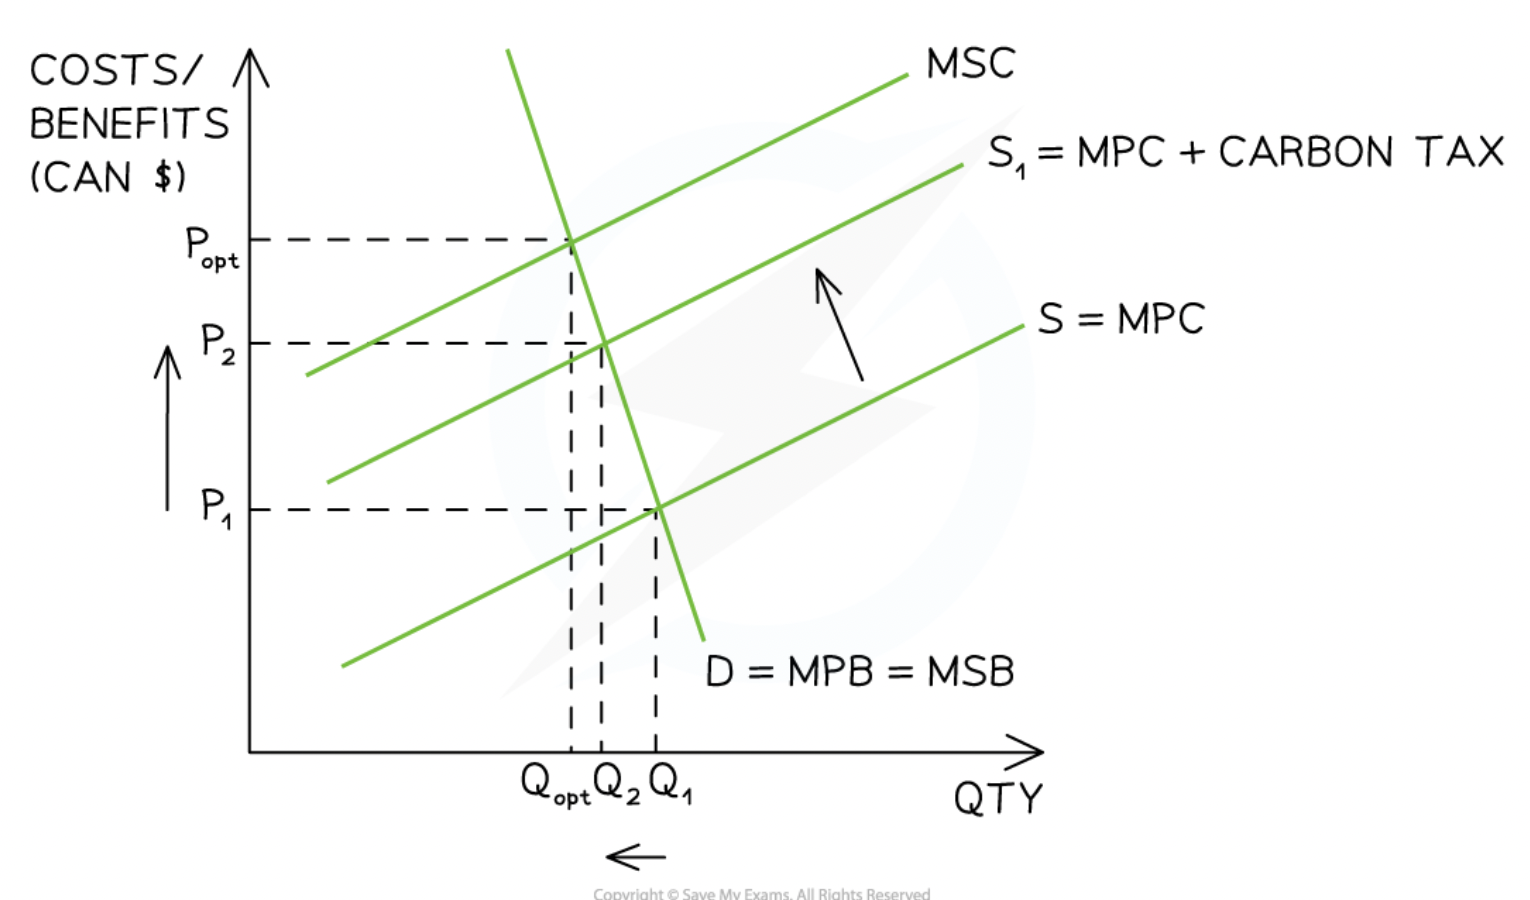
Evaluation of Carbon Taxes
Advantages: Encourages investment in pollution abatement technology and reduces external environmental costs. - Disadvantages: Consumers may still buy inelastic goods (like electricity) despite price increases, and it may force some firms out of business.
Subsidies (Analysis)
Government payments to firms that shift the supply curve right, addressing the under-provision of merit goods.
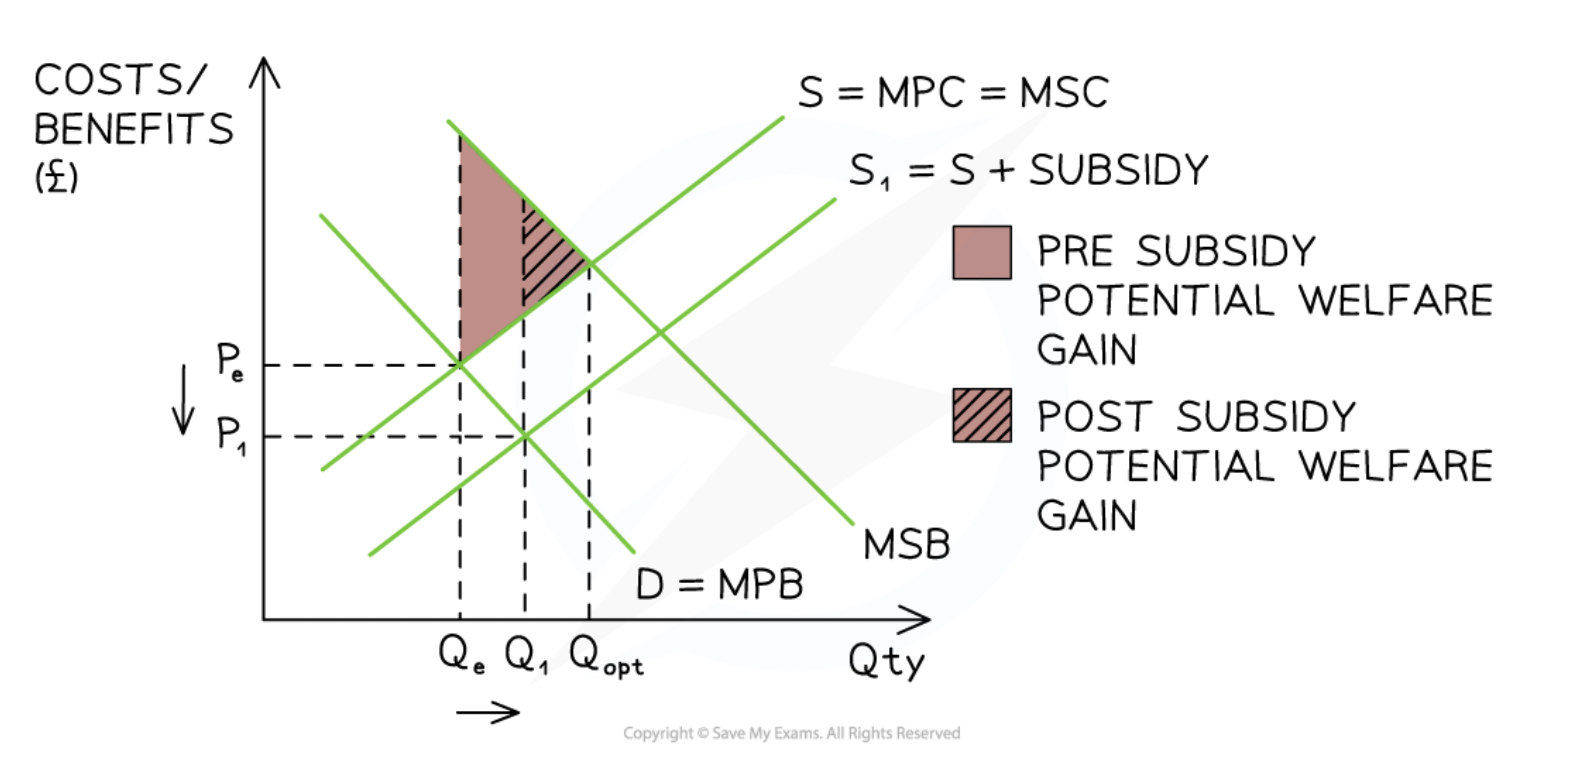
Evaluation of Subsidies
Advantages: Increases demand for merit goods and helps domestic firms compete. - Disadvantages: High opportunity cost for government spending and may lead to inefficiency by protecting uncompetitive firms.
Legislation and Regulation (producer side)
The use of laws and regulatory agencies (e.g., the FDA) to limit harmful activities. It can shift demand left (through age limits) or supply left (through quotas) to reduce market failure.
Legislation and Regulation (consumer side) graph
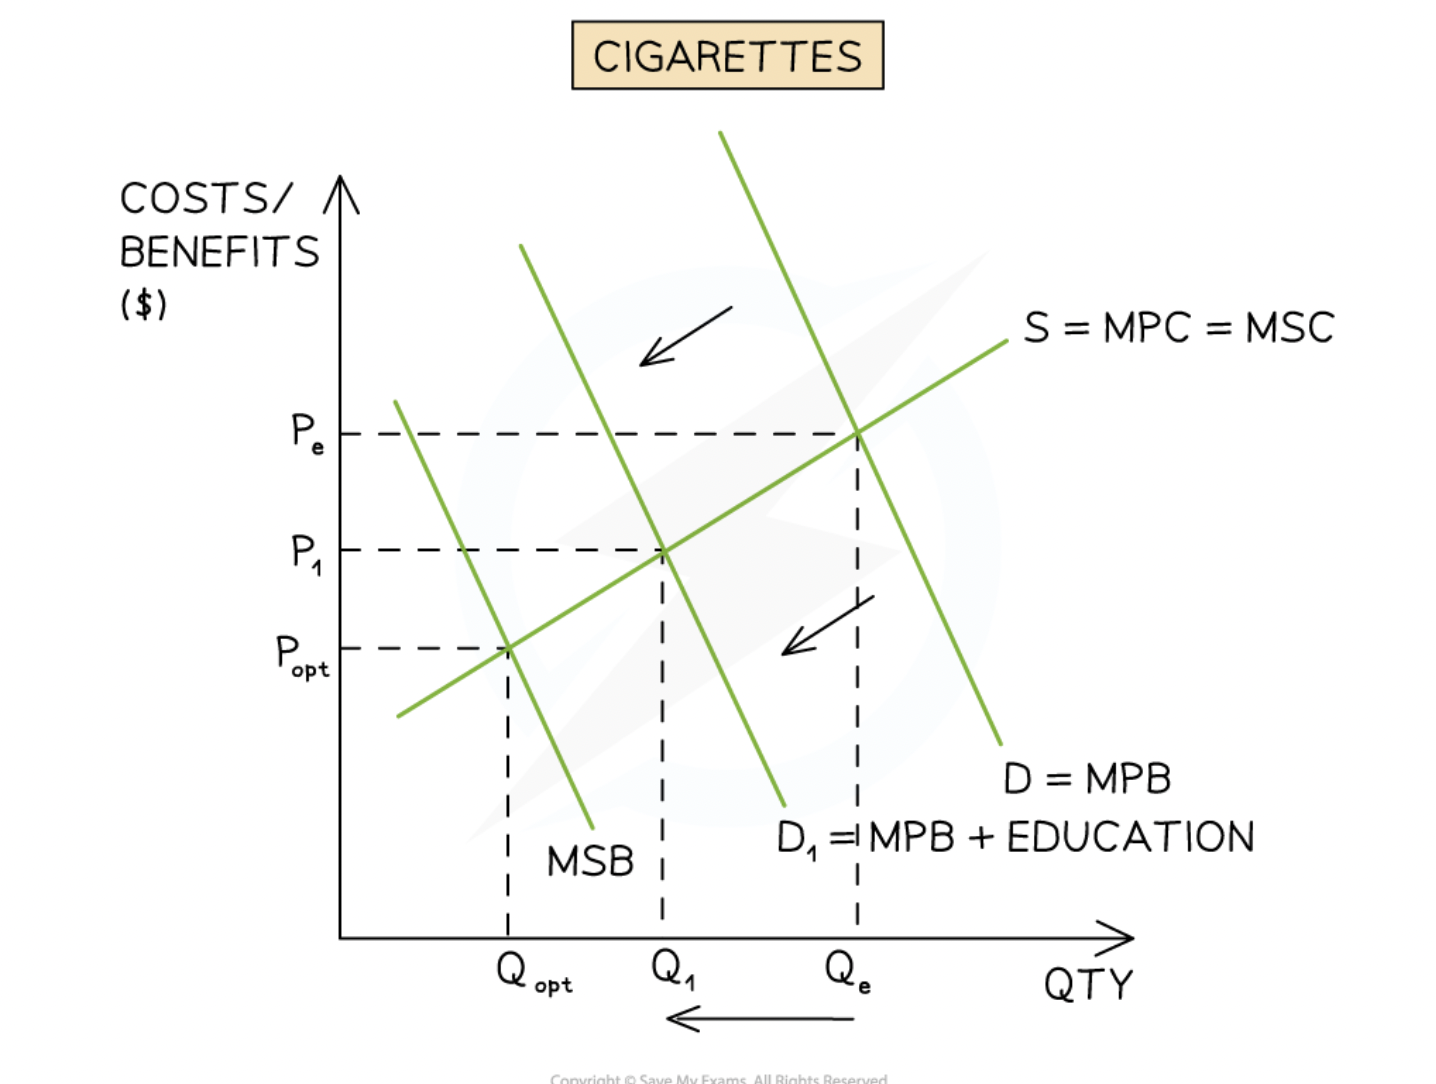
Education and Awareness Campaigns
Government programs designed to change consumer behavior. For merit goods, they shift demand right by highlighting dangers.
Tradable Permits
A system where firms purchase permits to pollute. These permits can be traded/sold if not needed, providing a financial incentive for firms to reduce their greenhouse gas emissions.
International Agreements
Globally coordinated efforts (e.g., COP \ 27) to address problems that transcend national borders, such as climate change and the depletion of common pool resources.
Government Provision
The state directly provides merit goods (like school or healthcare) to ensure universal access and resolve market failures where goods are under-provided by the free market.