6.3->6.6 - Applying goodness of fit tests for Binomial, Poisson and Geometric -> Contingency tables
1/8
There's no tags or description
Looks like no tags are added yet.
Name | Mastery | Learn | Test | Matching | Spaced |
|---|
No study sessions yet.
9 Terms
When testing a discrete uniform distribution, how would you find the expected frequencies?
each option should have an equal chance of happening, so each class should have an equal frequency.
They should also add up to the same number as the observed frequencies.
So you can just use this information to fill in the table with expected frequencies.
When testing a binomial distribution, how would you find the expected frequencies?
P(X=n)*n
(as E(X)=np)
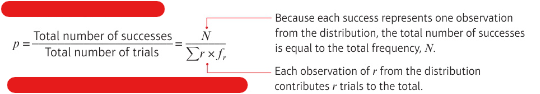
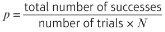
if the probability isn’t given when testing a binomial distribution, how could you estimate it?
(to find number of successes do the the observed frequency values times the amount of times that success happened)
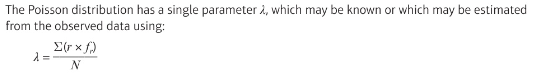
When testing a Poisson distribution, how would you find the expected frequencies?

if the mean isn’t given when testing a Poisson distribution, how could you estimate it?
how could you find the expected values in a contingency table?

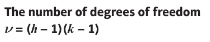
how could you find the degrees of freedom in a contingency table?
where h=amount of rows and k=amount of columns
When testing a Geometric distribution, how would you find the expected frequencies?

if the probability isn’t given when testing a Geometric distribution, how could you estimate it?