BRL Practical Review Spring 2025
1/94
There's no tags or description
Looks like no tags are added yet.
Name | Mastery | Learn | Test | Matching | Spaced | Call with Kai |
|---|
No analytics yet
Send a link to your students to track their progress
95 Terms
How many micrograms in 1 milligram
1000
How many milligrams in 1 gram
1000
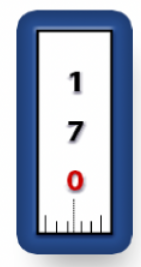
What transfer pipette is this
What amount is it currently holding
What is the range it can hold
p-20
17.0 microliters
2.0 - 20.0 microliters
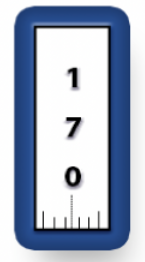
What transfer pipette is this
What amount is it currently holding
What is the range it can hold
p-200
170 microliters
20 - 200 microliters

What transfer pipette is this
What amount is it currently holding
What is the range it can hold
p-1000
170 microliters
100-1000 microliters
Pipette Bulbs and Serological Pipettes uses
for milliliters (1-10)
bulb is used to pick up
Percentage Error (%) Equation
(Theoretical Mass - Measured Mass) / (Theoretical Mass) * 100
Some errors with pipetting include…
Not switching tips
Pushing down while in the liquid
Air bubbles trapped in the tip
How to lable
S11-T4-DavidFritsche-(name)
Use of a buffer
To keep a stable pH range
Resist changes in H+ ion concentration
Solution Dilution Formula
What does each variable mean
C1V1=C2V2
C1 - concentration of stock solution
V1 - volume of stock solution needed to make dilute solution
C2 - final concentration of stock solution
V2 - final volume of dilute solution
Dilution Factor (DF) Equation
DF = C1/C2 = V2/V1
Dilution Factor meaning
factor by which the concentration of the dilute solution is reduced compared to the concentration of the stock solution
Example of Dilution (1)
Prepare 1L of 1X TBE buffer from a 10X TBE stock solution
how much tbe buffer in mls
how much water in mls
100ml of TBE buffer
900ml of water
Example of Dilution (1)
Prepare 6mL of 1X TAE buffer from a 10X TBE stock solution
600 microliters of TAE buffer
5400 microliters of water
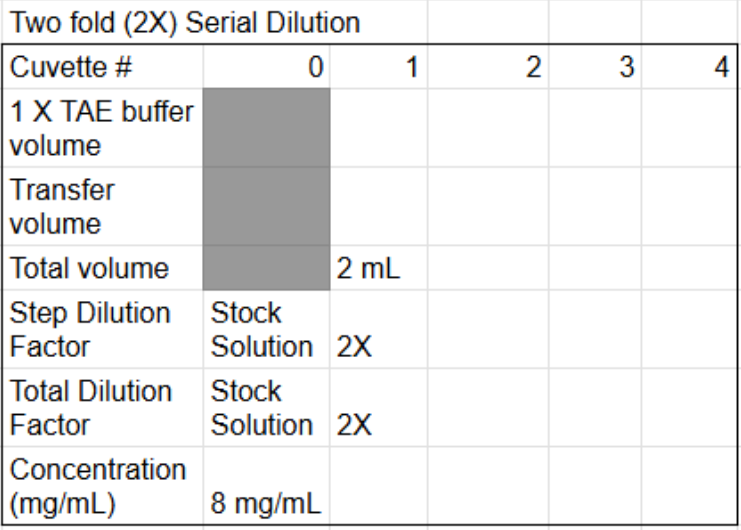
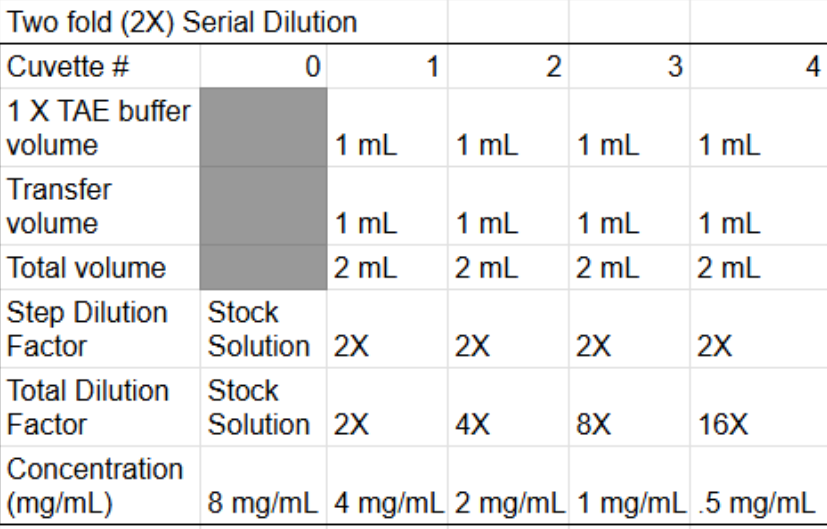
Finish the table
How to find transfer volume
How to open calculator
Home > Accessories > Calc
What does the SpectroVis (spectrophotometer) do?
measures absorbance or transmittance of a pigmented solution
How does the spectrophotometer measure the absorbance or transmittance?
Measures the amount of light reaching the photometer
What are the two methods to determine concentration of unknown samples
1. Use trendline equation
2. Use ratio concentration formula
What is the ratio concentration formula
What does each variable mean
Cs / Cu = As / Au
Cs - concentration of standard
Cu - concentration of unknown
As - absorbance of standard
Au - absorbance of unknown
What are the steps for measuring absorbance using SpectroVis and LabQuest
1 Connect SpectroVis to LabQuest via USB
2 In LabQuest app, go to Meter Screen (speedometer) in upper left corner
3 Sensors > Calibrate > wait 90 seconds for lamp to heat up
4 Wipe window of Blank (buffer) and place into SpectroVis, then hit Finish Calibration
5 Go to sensors > data collection > Time Based > OK
6 Change Wavelength > ‘550’nm . OK
Continue with lab, take mean after 10 seconds
What 4 things must every graph have
1 Title
2 Graph format (indep variable on X axis, dep on Y)
3 Labels on axis
4 Legend
Example of Graph format (indep variable on X axis, dep on Y)
pH vs NaOH added
pH - y axis (dependent response)
NaOH added - x axis (independent explanatory)
What does the R2 value tell you?
measure of how well the linear trendline fits the data
What are the two types of ways to increase our knowledge of biological systems
Discovery Science
Hypothesis Driven Science
What is Discovery Science
large amounts of data or surveys of natural systems to discover patterns and correlations
What is Hypothesis Drive Science
utilizes what is generally known as the scientific method
preforms an experiment
What are the 7 steps of the scientific methods, and give a quick bit of information about each and example
1 Observation/ problem - ID the problem to be solved, “why is the patient ill and how do i help?”
2 Background - collect information about what is already known “reading scientific literature about the causes of cancer”
3 Hypothesis - a tentative explanation for how the system or obhect works “the town’s high cancer rate is due to radon gas”
4 Prediction - If then statements logically derived from the hypothesis “if we incase ventilation in the town to reduce radon gas, then cancer rates will go down
5 Test Prediction/ experiment - test your predictions and analyze the outcomes “you would install better ventilation systems to lower radon levels and compare the cancer rates between regularly ventilated homes
6 Draw conclusion - analysis of results to determine if predictions were right.
7 Report conclusion - write out articles
What 3 variables are in a controlled experiment?
Independent - parameter changed by the interviewer
Dependent - parameter that responds to the changes from the independent variable
Control - variables that could affect the dependent variable, should be kept constant
What are the two groups in a controlled experiment
Control group - group in which independent variable is either not included
Experimental group - group in which independent variable is added or changed
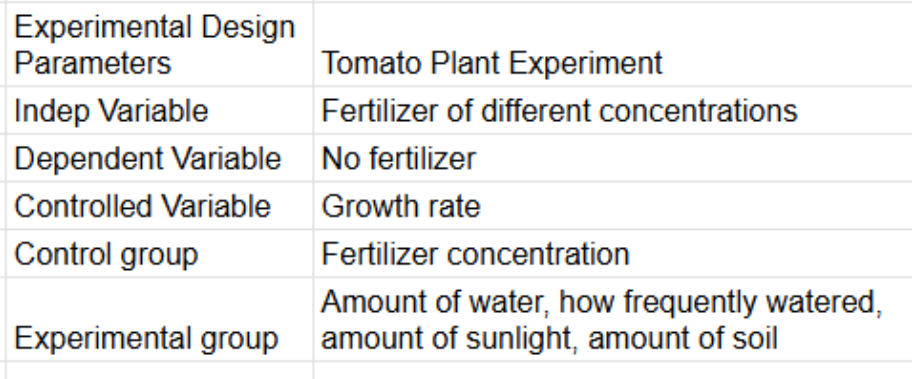
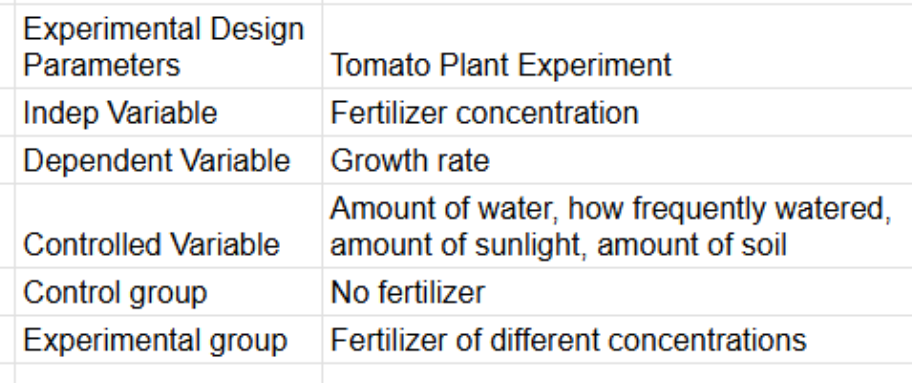
Example of an Experimental Design
Match these together
Definition of Population
All individuals in the group being studied
Definition of Sample
Sub-set of the population
Descriptive Statistics
Summarize and describe the data
Mean, median, SD, mode, range
central tendency (mean, median, mode) measures of dispersion (range, variance, SD), and distributions (normal)
Inferential Statistics
Used to draw conclusions, or inferences about the population based on the sample
- can be used to compare two groups and draw conclusions about observed differences between groups
- T-test
What does a T-test give you
used to determine if the difference between the means of two samples is statistically significant
provides p-value
What does a column chart give you
displays the means and standard deviation
What are the 9 WQI parameters (in order from most important to least important)
- Dissolved Oxygen 0.17
- Fecal Coliform 0.16
- Change in Temp 0.11
- pH 0.11
- Biological Oxygen Demand 0.11
- Total Phosphates 0.10
- Nitrates 0.10
- Turbidity 0.08
- Total Solids 0.07
Describe the process from test results to final WQI measure
1 Take results
2 Look on graph for (Q)uality-values
3 Multiply Q-value by weighting factor
4 Add all values together to get WQI
WQI Ratings to Ranges (5)
90-100 Excellent
70-90 Good
50-70 Medium
25-50 Poor
0-25 Very Poor
Are Q value graphs linear or the same for every parameter
No
Describe a Lentic source
ZEN Still water sources, ponds or lakes
Describe a Lotic Source
Moving water sources, streams, rivers, brooks, creeks
longitudinal dimension - flowing from upstream and downstream
Point Source Pollution (2 example)
any contaminant that enters the environment from an easily identified and confined place
Factories and sewage treatment plant
Effluents
Sewage and pollution dumped into water
Nonpoint-source pollution (examples and causes)
results from many diffuse sources like runoff, precipitation (acid rain), atmospheric deposition
Caused by rainfall which picks up and carries natural and human made pollutants which then fall into bodies of water
When can you take a single grab water sample?
Small bodies of water, such as streams and ponds
When taking water from a lotic source, where should the water be taken from and why?
Downstream to avoid disturbing the sediment
(WQI PARAMETERS) Change in Temperature
- where is temperature issues seen(how is it measured); what is a change of temp a sign of; what temp holds more gas; effects increase in temp; effects from factories; what helps limit sunlight exposure; what is fall turnover; what is the best; whats the units
If the water temp changes from over a section from where it was collected, this could be a sign of thermal pollution
- WQI measures the change in water temp from one area to another
- Effects the solubility of gases (oxygen), more gas can be stored in cold water than hot.
- Increase of temp can increase photosynthetic rate of aquatic plants, causing algal blooms which harms ecosystems
- River water is used in factories and treated when returned, but typically returned at a warmer temperature
- shade is necessary to limit sunlight exposure
- fall turnover, when air temp drops and chills surface water, cold surface water cycles down to the bottom, bringing up oxygen and nutrients
— best is low change in temp from one place to another
— degrees celcius
(WQI PARAMETERS) pH
What does it measure; whos sensitive; where does an increase/decrease come from; describe acid rain; range of pH typical for streams and lakes and drinking water; whats the best; whats the units
— measures the concentration of OH- and H+ ions in a solution
— aquatic organisms are very sensitive to changes in pH
— changes in pH can be from algal blooms (more basic), industrial process (both more acidic basic), or oxidation of sulfide-containing sediments (more acidic)
— Acidic rain from dissolved carbon dioxide and air pollutants will increase pH
— streams and lakes range around 7-8, drinking water 6.5-8.5
— the best is a ph of 6.5-8.2
— pH
(WQI PARAMETERS) Dissolved Oxygen
What is it and why is it important? How does it get into water? What are the factors affecting concentration (7)? Anything unique about when to test? Describe issues with Algal blooms? Whats the unit and whats the best?
— oxygen gas dissolved in water and is very important since some species need a lot of DO and some need little
— diffused into water from the atmosphere, aeration as water flows, and photosynthesis of aquatic plants
— factors that affect the concentration of DO: temp, stream flow, air pressure, aquatic plants, decaying organic matter, and human activity
— DO tests should be conducted at the same to avoid differences from photosynthesis
— Algal blooms cause large fluctuations in DO; they grow fast → increasing DO, then die and are eaten by aerobic bacteria → lower DO sharply which can cause fish to die off
— unit is % saturation (if given in mg/L then divide it by 100) and best is around 100%
(WQI PARAMETERS) Biochemical Oxygen Demand (BOD)
What is it? What is the role of Organic materials? How would BOD decrease? What does BOD look like in a good environment? Bad environment? What is unique about measuring BOD? Whats the units and whats the best?
— oxygen available/what is need for aquatic organisms; based on organic material decomposition; when there is more OMD, then an increase in oxygen demand is seen, and when there is less OMD, then less oxygen demand is seen.
— Plants and animals use oxygen during cellular respiration
— In healthy water bodies, oxygen is replenished faster than it is used by aquatic organisms
— In unhealthy water bodies, aerobic bacteria decompose such large volumes of organic material that oxygen is depleted from the body before it can be replenished
— Measured after a 5 day incubation period to see the before and after oxygen used
— Units mg/L, and lower is better
(WQI PARAMETERS) Total Solids
What is it? What are the factors that contribute to it? What are some of the issues that come with it? What are the units and the best?
— measure of all suspended, colloidal, and dissolved solids in a sample of water
— factors that contribute to total solids are soil erosion, naturally occurring rocks and minerals dissolving, sediment stir up, various types of runoffs (agriculture - fertilizers and suspended soil particles), industrial waste, effluents from water treatment plants, Organic matter like plankton or decaying matter.
—High amount of total solids can lower the clarity of the water, letting less sunlight through and slowing down photosynthesis rate; cloudy water makes the water hotter due to the suspended particles in the water absorbing sunlight
— units are mg/L and the best is around 50mg/L
(WQI PARAMETERS) Turbidity
What is it measure? What factors effect? What are the effects of high turbidity? Higher or lower after rainfall? What are the Units and the best?
—measure of the waters lack of clarity, high turbidity is cloudy, low turbidity is clear. More particles in water mean higher turbidity
— similar to total solids, soil erosion, runoffs, bottom dwelling organisms, and organic matter all increase turbidity
—High turbidity can lower the clarity of the water, letting less sunlight through and slowing down photosynthesis rate; cloudy water makes the water hotter due to the suspended particles in the water absorbing sunlight
— turbidity is higher after rainfall
—units are Nephelometric Turbidity Units, NTU, standard for drinking is around 0.5 to 1NTU
(WQI PARAMETERS) Nitrates
What is important about Nitrates for plants and animals? What are the manmade sources? What baby disease could come from a high level for nitrates? What process could be caused by high concentration in water? Units and good range in water?
— Important source of nitrogen necessary plants and animals to synthesize amino acids
— manmade sources of nitrates are animal feedlots, runoff from fertilized fields, or treated municipal wastewater
— Levels 10mg/L can cause methemoglobinemia, or Blue Baby Syndrome
— High concentration in water bodies could cause Eutrophication which causes unpleasant odor and taste of water, as well as reduced clarity and dead biomass occurs. Algal blooms can occur as well
— range from 0.1 to 4mg/L NO3- —N and unpolluted waters have below 1mg/L NO3- —N
(WQI PARAMETERS) Fecal Coliform Bacteria Test
What does this test for? Where can fecal coliform come from and get out into the environment? Why is E.Coli specifically tested for? Explain the test? Units?
— test determines whether or not there are fecal bacteria present like E.Coli, which are bacteria that live in the intestinal tracts of animals and humans
— High E. Coli levels can result from leaking septic or sewer systems, polluted runoff that has picked up animal waste, waterfowl in the stream or wading cows
— E.Coli is tested since it’s always found in the intestines and are not typically found in soil and water
—- During the test, a water sample is added to media containing only lactose, and any coliform present will ferment the lactose and generate gas
— CFU/100mL
(WQI PARAMETERS) Total Phosphate
What does phosphate directly encourage? What can occur? High levels of Phosphate correlate to what DO and what BOD? What are the 4 types of phosphates? How does it get in the water? Whats the best and what are the units?
—Phosphorus is a limiting factor in plant and algal growth, and only small amounts are needed or extreme growth of algae and Eutrophication can occur.
— High levels of phosphorus are correlated to low DO and High BOD
— 4 phosphates: orthophosphates, organically bound phosphates, condensed phosphates, total phosphates.
— added to water from industrial and agricultural waste by means of runoff and soil erosion, also can come from excrement of animals in and around the water
— Best is very low amounts, roughly below 0.1 mg/L PO4- P
Describe the process of taking the pH of a sample.
Swirl the sample, remove pH sensor from bottle, rinse tip with water then dry off with kimwipe, submerge the tip 3-4cm in the sample, before collecting wait for pH to stabilize in the new environment, let run for 10 seconds then take the mean
Describe the process of taking the total solids of a sample.
Wash and let oven dry a 150mL beaker, label the beaker, weigh the beaker before adding water (A), swirl the water the Nalgene bottle to uniformly spread the solids, then measure out 100mL of water into the beaker, place the beaker in the oven for a week then record the new weight of the total solids left behind. IF less than 0.025 grams, repeat in the same process to get the left over solids (B)
Math part
B(g)-A(g) = C(g)
C(g) * 1000 => D mg
total water (mL) / 1000 = E(L)
Total solids = D/E => mg/L
Describe the process of taking the turbidity of a sample.
Plug sensor into labquest and let it heat up, get box full of Turbidity standards, begin calibration by going to sensors > calibrate > turbidity, then place the BLANK cuvette in to machine and press Calibrate Now, enter 0 NTU for value 1 then hit Keep. Remove and do the same for 100 Standard, this time hit 100 NTU for value 2. Use serological pipette and bulb to fill up sample up to white line. Let run for 10 seconds and take the average
Describe the process of taking the DO of a sample.
Plug DO prob in to Labquest, and switch the probe to % saturation. Submerge prob 4-6 cms and hold the probe for 40 seconds to allow for automatic temperature compensation. After 40 seconds, let run for 10 seconds then take the average.
Describe the process of taking the BOD of a sample.
Plug DO prob in to Labquest, and switch the probe to mg/L. Submerge prob 4-6 cms and hold the probe for 40 seconds to allow for automatic temperature compensation. After 40 seconds, let run for 10 seconds then take the average. Before caping, refill the bottles back up to the neck. AFTER A WEEK repeat. Take the initial - final
Describe the process of taking the Nitrates of a sample.
— 1. Attach probe to clamp support stand and insert the Nitrate Ion Selective Electrode onto the support stand. Next, put the NISE over the rinsate beaker to rinse it with DI water and dry with a kimwipe. Uncap the high nitrate standard and put it under the NISE, then allow the NISE to soak in the high standard for 30 mins, not on the bottom and make sure the small white dot is fully submerged.
— 2. First Calibration - Plug ISE into Channel 1 of Vernier interface. Sensors > Calibrate > Nitrate ISE > Calibrate Now. While the ISE is still submerged, wait for “live voltage” to stabilize, then enter 100 for value 1 > keep
— I. Remove NISE from High, swap with rinsate beaker, then wash with DI and dry
— 3. Second Calibration - Do the same with the Low Standard. Wait for “live voltage” to stabilize, then enter 1 > keep > OK
— 4. Collect Nitrate Concentration - rinse with DI similarly to the I. step. Place tip into Nalgene water sample for 60 seconds before taking measurements. Then record for 10 seconds and take the mean.
— 5. Clean - Up - rinse probe with DI water and dry with kimwipe. Make sure sponge is moist, if not use DI water. The tip of the prob should NOT touch the sponge, and the white dots should be in the bottle.
Describe the process of taking the Fecal Coliform of a sample. What does it tell you about the sample if there is/isnt a bubble
A water sample is added to a media containing only lactose for an Energy source that any E.Coli would use to produce CO2 through fermentation. After incubation, look at the air bubble formed and determine if there was E.Coli present or not. Use the chart to determine the MPN
Tells you the presence/absence of fecal coliform
How could scientists determine a species when things look morphilogically similar to one another?
Looking at a biological species genone sequence.
What is a conserved region of DNA and what’s its significance
— a nucleotide sequence that has little to no variation across species and has remained relatively constant throughout evolution
— provides good confidence to identify organisms to species level.
What is DNA Barcoding? What useful information does it give? What is the goal of the DNA Barcoding Discovery Study?
— molecular technique that allows you to determine the taxonomic identity of a biological specimen using DNA sequences
— helps ID organisms to a species level even when working with specimens lacking important morphological characteristics
— Identify bacteria to the species level present in the water sample
What gene is used for bacterial samples to ID them? Whats unique about the primers? How long is the bp fragment?
16S rRNA gene
Primers are set for specifically this gene
should generate about 1500 bp fragment
What is Direct Amplification
Going from culturing bacteria to PCR and skipping DNA extraction
What is the flow/steps for DNA Barcoding of bacteria
— Culturing bacteria
— Direct Amplification to PCR
— Gel Electrophoresis to check PCR
— DNA Sequencing (Sanger Method)
— Sequence analysis
What is the Agar Gel made up of? (3) What does it do? Whats the purpose of Luria Broth
— agarose
— agaropectin
— nutrients
— Helps the bacteria samples grow
— Helps the bacteria samples grow
Why do bacteria not need to have their DNA extracted in order to do PCR?
The heat from PCR will lyse the cells releasing the DNA
What is the goal of PCR?
To create billions of copies of the specific barcode fragment wanted to be sequenced
In this case 16S rRNA
What are the 4 constituents (materials) needed for PCR
— DNA template
— Primers
— dNTPs
— DNA polymerase to synthesize new DNA (Taq Polymerase is used)
What are the 3 steps of PCR
— Denaturation
— Primer Annealing
— Synthesis
Describe the Denaturation step in PCR
DNA sample is heated to 95 degrees Celsius to disrupt H-bonds causing the DNA strand to denature into single stranded DNA
Describe the Primer Annealing step in PCR
At 50 degrees Celsius, the two primers, which grow in both 3prime to 5prime and 5prime to 3prime, anneal to the DNA single strands.
Describe the Synthesis step in PCR
The temp is raised back up to 72 degrees Celsius, allowing the Taq Polymerase to synthesize DNA from the primers
What is a master mix? Why is it used? What is in it? What will we do with it?
— Instead of adding each reagent individually, a master mix is used since it contains all the reagents
— Helps reduce pipetting errors and time spent to set up the reaction
— Contains: DNA polymerase, dNTPs, buffer, primers, water
— Put a small amount of the master mix into each PCR tube
What goes into the …
Sample tube
Positive tube
Negative tube
why?
Sample tube - our bacterial cultural (what we are testing for)
Positive tube - contains known bacterial DNA
Negative tubes - contains water and no DNA template
What does Gel Electrophoresis test for?
To see if PCR was successful
What way will the DNA move during gel electrophoresis? Why?
What determines how far a DNA strand will go?
— Towards the positive cat
— The phosphate groups on the DNA backbone have a negative charge
— The size. Smaller ones go farther
What is added to the DNA sample before Gel electrophoresis? What is its composition and each uses? (3)
— Blue gel loading dye
— 1. Glycerol (which is denser than water so the DNA samples will sink to the bottom of the wells
2 Xylene cyanol (tracking dye)
3 Bromophenol blue (tracking dye)
What is a DNA Ladder? Why?
A set of DNA fragments of known sizes which is used to determine the size of DNA fragments that traveled
What is added to the gel to allow the DNA to be seen to the naked eye?
Ethidium Bromide (EtBr) which shines bright red when exposed to UV light
Percentage by weight (w/v) equation and use
— helps you know the percentage of your solute in a total volume of solution
% by weight (w/v) = grams of solute/100mL of solution
Example of Percentage by weight (w/v) equation
How do you prepare a 50-mL solution of 20% (w/v) Sodium Dodecyl Sulfate (SDS). Write out the meaning
20 g / 100 mL = 50mL → 10 g SDS
to make 50mL of a 20% (w/v) SDS solution, dissolve 10 grams of SDS in water and bring the water up to 50mLs
Example of Percentage by weight (w/v) equation
How do you prepare a 70-mL solution of 2.0% (w/v) Agarose. Write out the meaning
2.0g/100mL = 70mL → 1.4g agarose
To make a 70mL of 2.0% agarose solution, youll need 1.4 grams of agarose
Analysis of Gels Issues; Interpret why?: There is no gel bands present and no DNA Ladder either.
Ethidium Bromide was not added
Analysis of Gels Issues; Interpret why?: If there are no bands in the S or P line, BUT the ladder is present.
The primers or dNTPs or taq polymerase may have degraded
Analysis of Gels Issues; Interpret why?: There is a band present in P, but not an S.
It’s possible that the bacterial culture was not properly inoculated, the nutrients and culture conditions were not successful, or the bacterial culture was not added.
OR
Too much bacteria was added during PCR and PCR inhibitors were produced by the bacteria
Analysis of Gels Issues; Interpret why?: Band seen in N
Indication of master mix or PCR contamination
Analysis of Gels Issues; Interpret why?: Your team members have bands, but you dont.
You did not prepare your master mix correctly
Analysis of Gels Issues; Interpret why?: Thin bands seen at the end (100-250bp)
Presence of primer dimers - when primers anneal to themselves