7 & 8. Population Growth
1/39
There's no tags or description
Looks like no tags are added yet.
Name | Mastery | Learn | Test | Matching | Spaced |
|---|
No study sessions yet.
40 Terms
Population size
number of individuals of same species living in a defined geographical area
Population sizes change
births-deaths
+ immigrants-emigrants
Geometric and exponential models describe…
populations growth in an idealized environment with unlimited resources and good constions
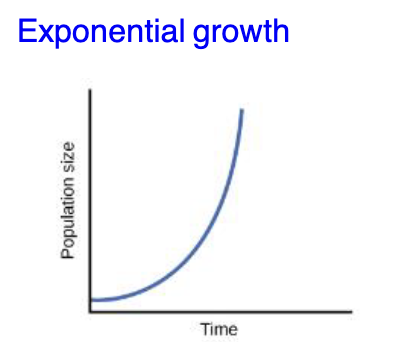
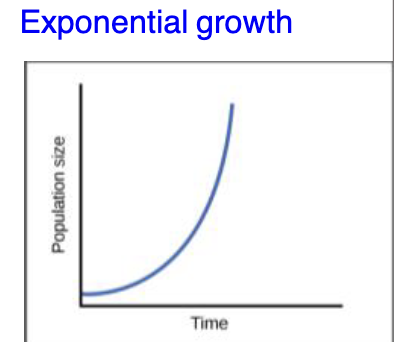
Exponential growth
growth exponentially
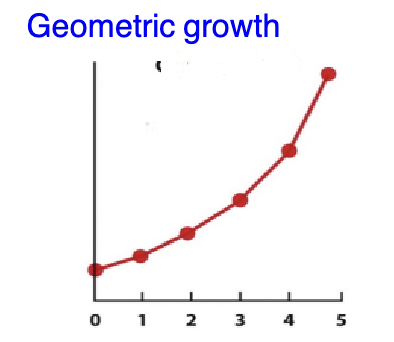
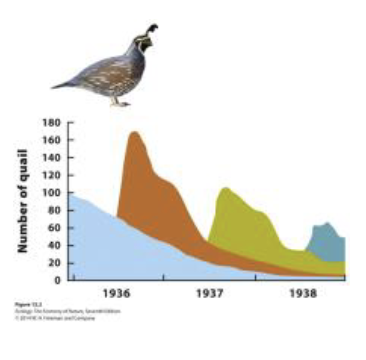
Geometric growth
discrete time intervals
Unregulated growth
Exponential growth
Regulated growth
Logistic growth
If there are limiting factors/resources
Population growth rate
number of new individuals that are produced per unit of time mins the number of individuals that die
Intrinsic growth rate (r )
highest possible per capita growth rate for a population (maximum reproductive rates & minimum death rates)
For a closed population (with no migration) r = b -d
r = birth rate (b) - death rate (d)
r (+ (growing)) (- (decreasing))
Intrinsic growth rate example
population of 100 bats, in one year 80 born, 60 dies
r = b-d
b = 80/100 individuals = 0.8
d = 60/100 individuals = 0.6
r = 0.8-0.6 = 0.2 (population is growing)
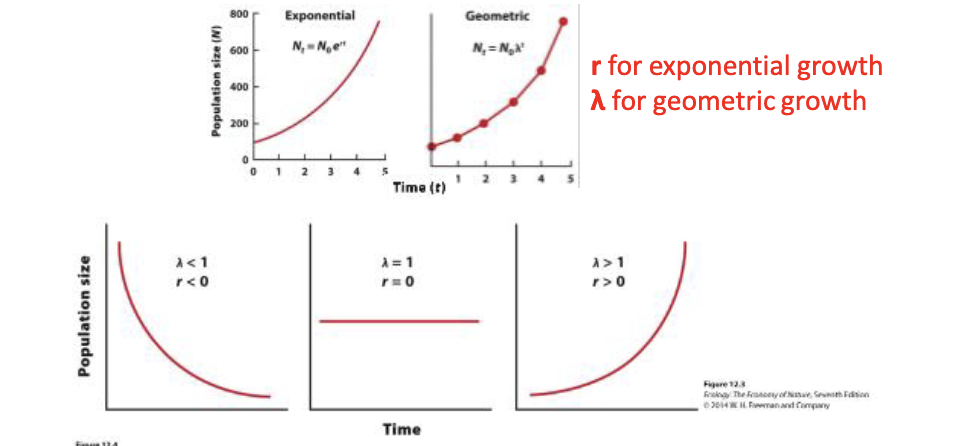
Exponential growth model
model of population growth in which population increases continuously at an exponential rate; described by equation
Nt - N0 e ^rt
Nt = future population size
N0 = current population size
e = exponential constant 2.72
r = intrinsic growth rate
t = time over which a population grows
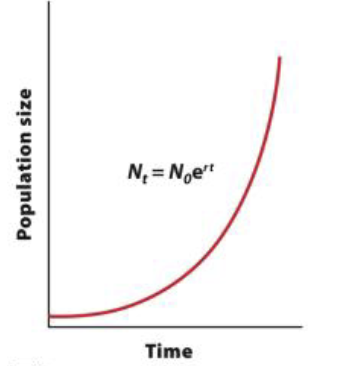
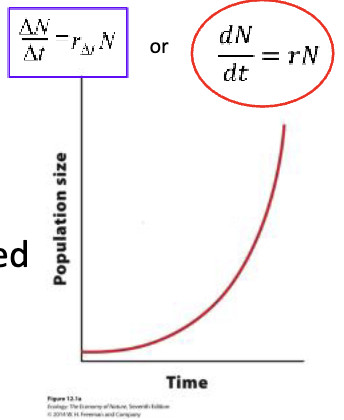
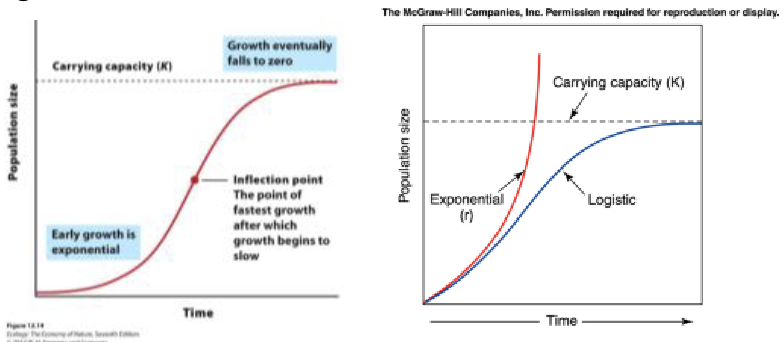
Exponential population growth
The shape of the growth when graphed is a J-shaped curve
The rate of the a population’s growth at a point in time is
G = rN
G = number of individuals added during any time interval
r = intrinsic growth rate: b - d
N = population size
In exponential growth
The shape of the growth when graphed is a J-shaped curve
G = number of individuals added during time (growth increment)
G = r * N
growth rate * population
if isolate r: r = G/N
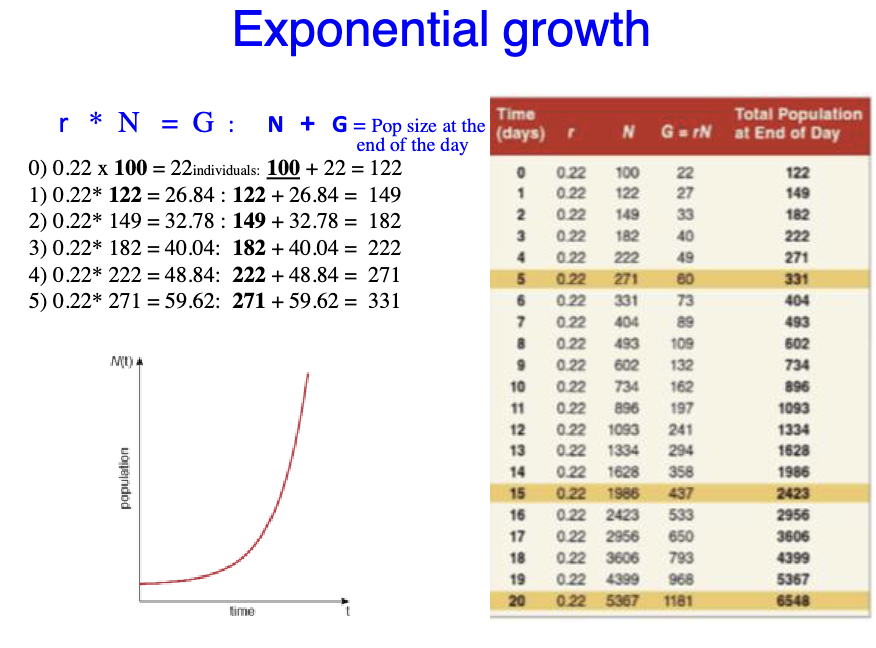
Exponential growth example
We have 100 aquatic beetles with r = 0.22 per day. How many individuals will be added per day?
100 aquatic beetles with r = 0.22 per day
G = 0.22 × 100 = 22. individuals per day
New aquatic beetles will eventually and more offspring to the existing population
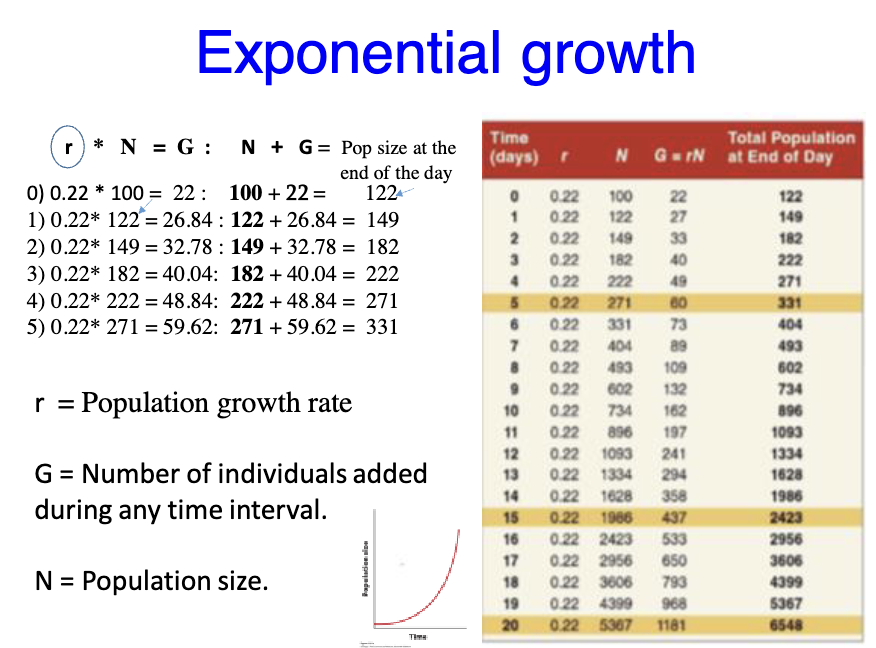
Exponential growth rate example #2
We have 100 aquatic beetles with r = 0.22 per day. How many individuals will be added the first day and how many individuals you will have after one, two, and three days?
G = rN
New population size N + G
r = Population growth rate
G = Number of individuals added during any time interval
N = Population size
Geometric growth model
compares population size at regular time intervals
used for species with discrete
expressed as a ratio of a population’s size in one year to its size in preceding year (λ)
λ cannot be negative
λ > 1, population size has increased
λ = 180/100 =1.8
λ < 1, population size has decreased
λ = 80/100 = 0.8
Geometric growth model info
size of a population after one time interval is:
N1 = N0λ
size of a population after time intervals, the population size would be
N2 = (N0λ)λ = N0λ²
More generally, after t time intervals
Nt = N0λ^t
Comparing growth models
When a population is decreasing, λ < 1 and r < 0
When a population is constant, λ > 1 and r = 0
When a population is increasing, λ > 1 and r > 0
r for exponential growth
λ for geometric growth
Population regulation (controls)
Density dependent controls: Effects increase as population grows. Infraspecific competition, predation, parasitism and infectious disease
Higher population size = food supply diminishes competition increases
Higher density = predators are attracted
Population regulation (controls)
Density dependent controls: effects increase as population grows: intraspecfic competition, predation, parasitism, & infectious disease
Higher population size = food supply diminishes
Higher density = infectious diseases spread more easily
Higher density = predators are attracted
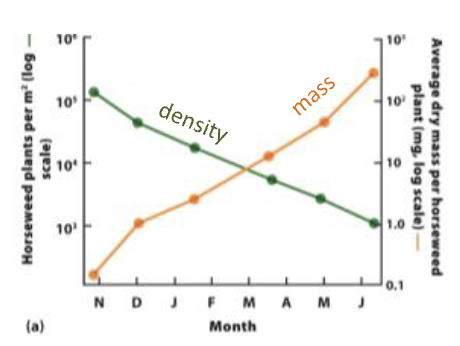
Density-dependence in plants
Resources: sunlight, water, soil nutrients, etc.
Ex: horseweed plants at a density of 100,000 m² over time, many individuals dies.
As density decreased, there was a significant increase in the weight of surviving individuals
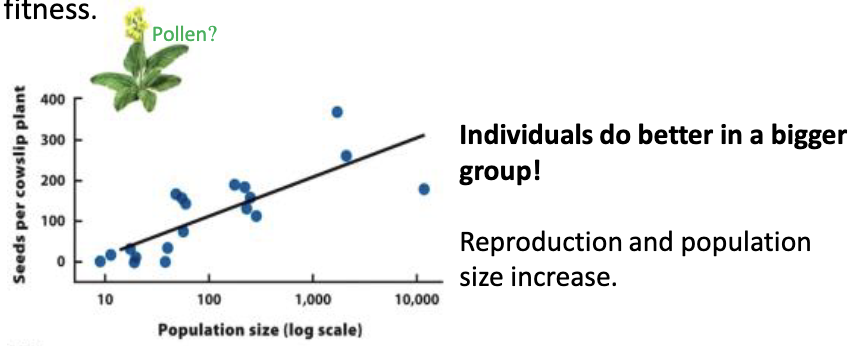
Postitive density dependence
Rate of population growth can increase as population density decreases (inverse density dependence or Allee effect)
Decline in individual population size or density
Postive correlation between population density & individual fitness
Population regulation
Density independent controls: Limit population size regardless of populations’s density
Climatic events (e.g. tornadoes, floods, extreme temps, droughts, fire, etc.)
Birth & death rates do not change as density rises, but suddenly mortality rate increases, reproductive rate decreases
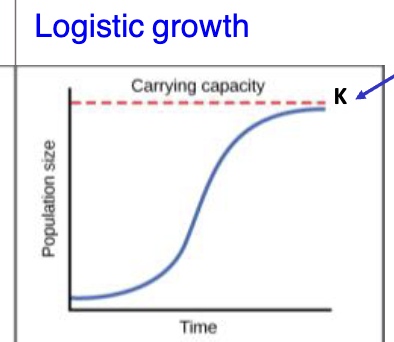
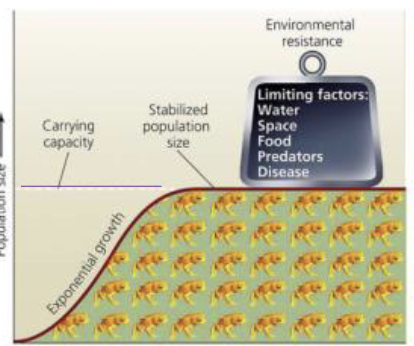
Logistic growth model
The per capita rate of population growth approaches zero as the population size nears carrying capacity (K)
Logistic population growth
density dependent factors are in effect
logistic growth model equation
Growth of populations at high densities:
dN/dt = rN (1-N/K)
Logistic growth in general
G = rN (K-N/K)
G = number of individuals added per unit of time (growth increment)
r = growth rate
N - number of individuals in the population at a given time (population size)
K = Carrying capacity
Carying capacity (K)
The maximum population size that can be supported by the environment
As the population size increases:
Resource shortages
Environmental limitations
within-species competition
imposes an upper limit on a population’s size
typically is not fixed (can change at some point)
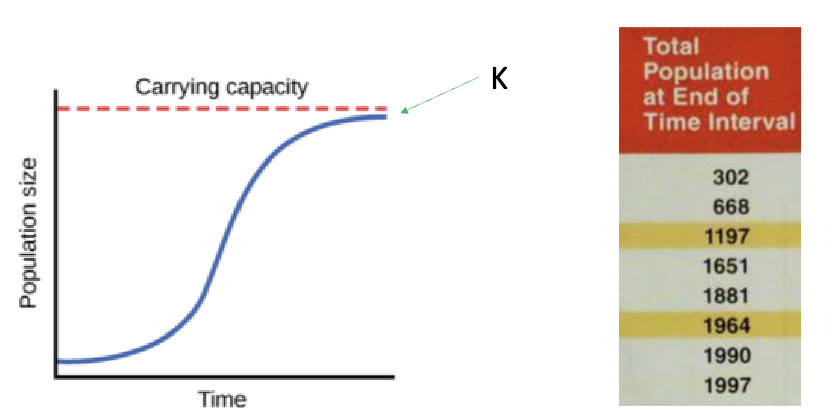
Logistic growth graphs
S- shaped curve: shape of the curve when a population is graphed over time using the logistic growth model
Inflection point: the point on a sigmoidal growth curve at which the population has its highest growth rate
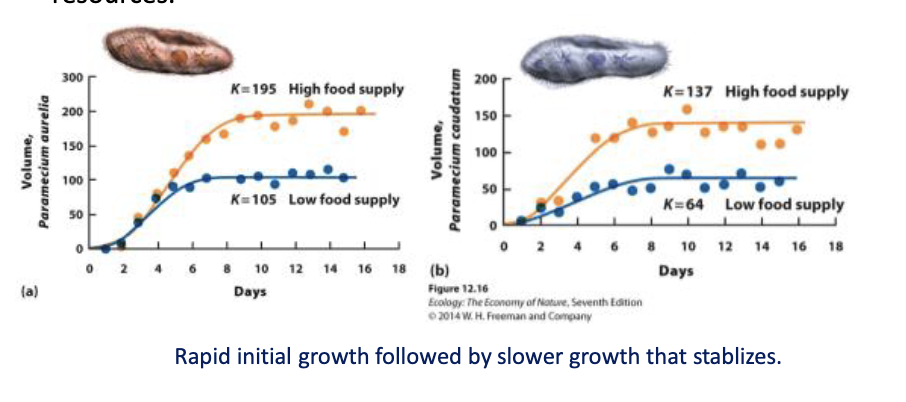
Logistic growth model example
two species of protists with a fixed amount of food each day
Populations initially grew in size, but eventually stabilized at different carrying capacities dependent on the available resources
Is the following population exhibiting logistic growth?
If so, what is the carrying capacity?
no
Is the following population exhibiting logistic growth?
If so, what is the carrying capacity?
no
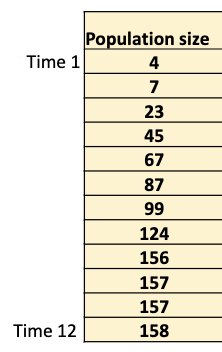
Is the following population exhibiting logistic growth?
If so, what is the carrying capacity?
Yes, 157
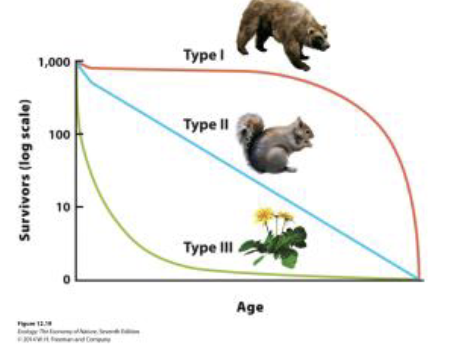
Survivorship curves
Type 1: low mortality early in life, & high mortality later in life (large mammals)
Type II: Constant mortality throughout the life span (different birds, squirrels, corals). Stead decline in survival throughout life
Type III: High mortally early in life and high survival later in life (weeds)
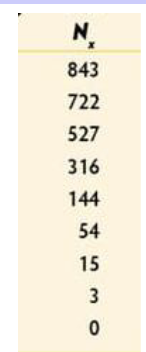
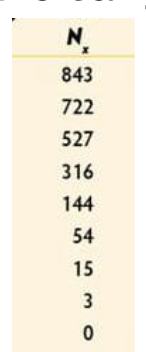
Life table
Class-specific survival and fecundity data
based on number of female offspring per female
x = age class
nx = number of indi
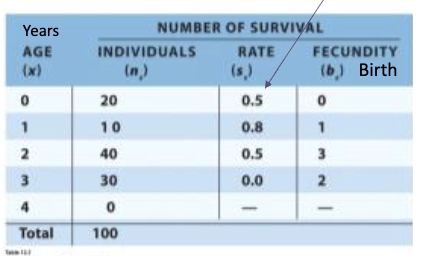
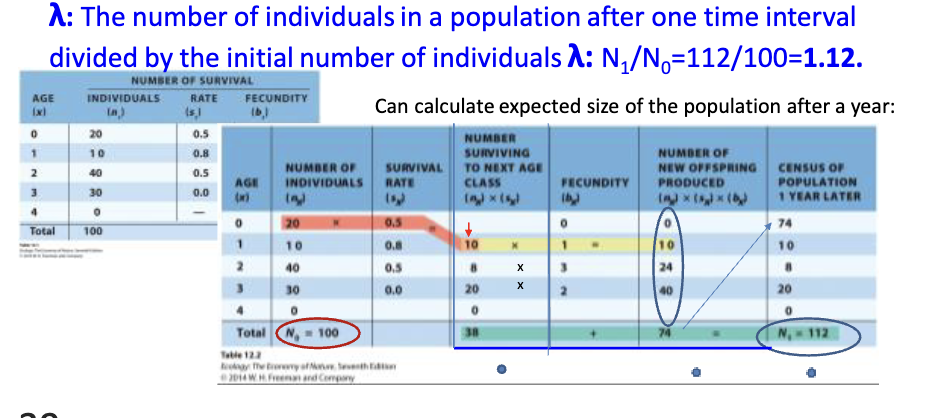
Life table calculations
Number surviving to net age class = (nx) (sx)
Number of offspring produced (nx) (sx) (bx)
λ: number of individuals in a population after one interval divded by the initial number of individuals
λ = N1/N0 =
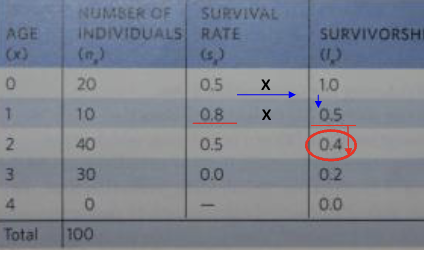
Surviviorship
Probability of surviving from birth to any later age class (/x); surviorhsip in the first age class is always set a 1.
ex: for second year (I2) would be I2 = /1 s1
A mammalogist estimates that there are N1 =
10,000 mice living in a large section of forest,
which she estimates has a carrying capacity (K) of
100,000. The population appears to have an
intrinsic growth rate (r) = 0.05 mice / mouse / year
What do you predict for G during this next year?
a) 45 mice
b) 50 mice
c) 450 mice
d) 500 mice
e) 4500 mice
c) 450 mice
A mammalogist estimates that there are N1 =
10,000 mice living in a large section of forest,
which she estimates has a carrying capacity (K)
of 100,000. The population appears to have an
intrinsic growth rate (r) = 0.05 deer mice / deer
mouse / year
What do you predict for G during this next year?
a) 45 mice
b) 50 mice
c) 450 mice
d) 500 mice
e) 4500 mice
G = rN (K-N/K)
c) 450 mice
A mammalogist estimates that there are N1 =
10,000 mice living in a large section of forest,
which she estimates has a carrying capacity (K)
of 100,000. The population appears to have an
intrinsic growth rate (r) = 0.05 deer mice / deer
mouse / year
What do you predict for G during this next year?
a) 45 mice
b) 50 mice
c) 450 mice
d) 500 mice
e) 4500 mice