AP Stats Unit 1
 Call Kai
 Learn
Learn Practice Test
 Spaced Repetition
 Match
Match Flashcards
 Knowt Play
1/29

There's no tags or description
Looks like no tags are added yet.
Name | Mastery | Learn | Test | Matching | Spaced | Call with Kai | Chat |
|---|
No analytics yet
Send a link to your students to track their progress
30 Terms
Population (N)
The entire group of individuals or items that you want to learn about
Sample (n)
a smaller, manageable subset of individuals or objects chosen from a larger population
Prospective study
A study following data over time
Retrospective study
Uses past records
Categorical Variable
A variable divided into categories or groups
Quantitative Variable
A variable that can be measured or expressed numerically
Marginal relative frequency
The proportion or percentage of individuals in a single specific category relative to the grand total
Joint relative frequency
Uses inside data divided by the grand total
Conditional relative frequency
The proportion or percentage of individuals in a specific category given another category
Association
If knowing the value of one variable helps predict another (If/Then)
Bar Graph & Pie chart
Shows Frequency (how many) or Relative Frequency (percent %)
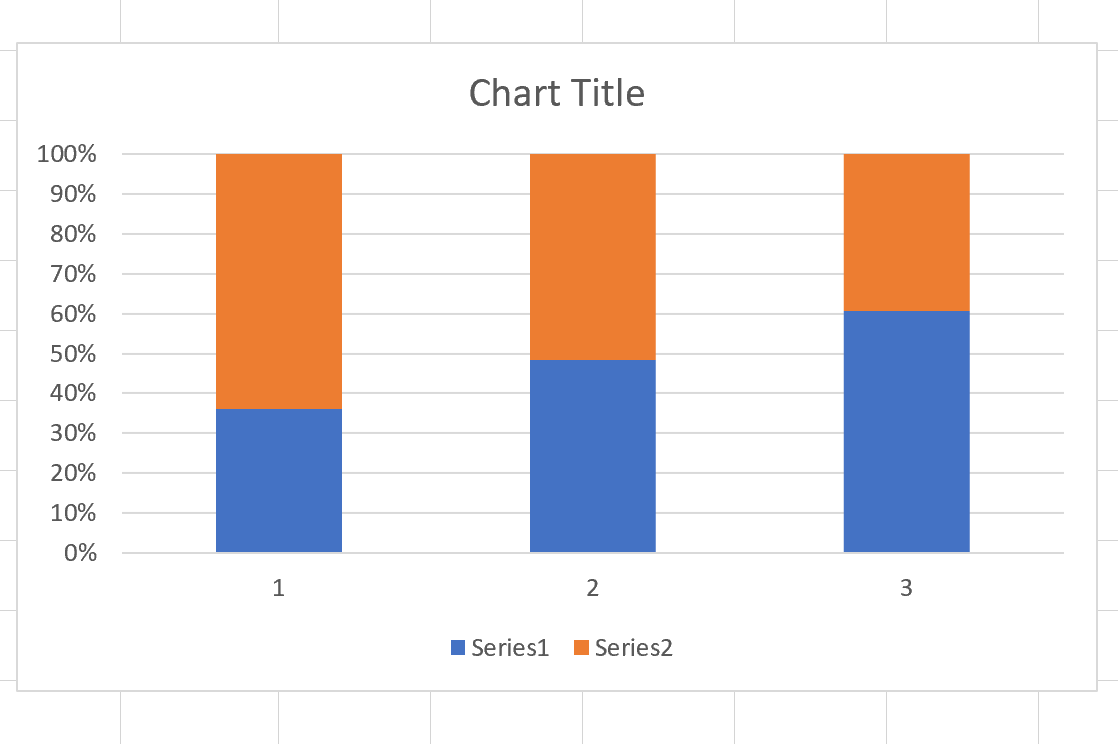
Segmented Bar Graph
Stacks up categories on bars to make 100%
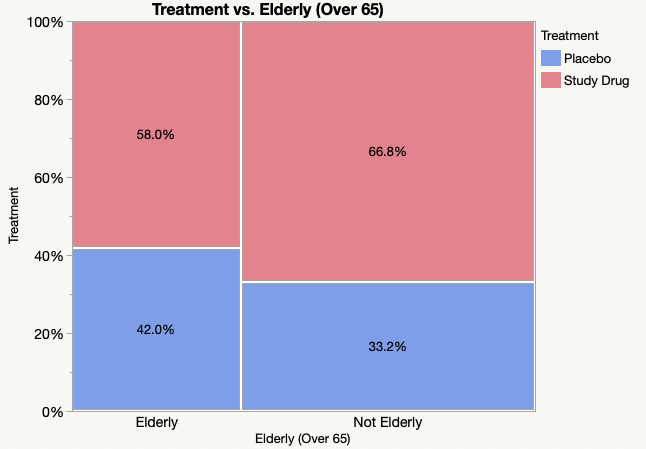
Mosaic Bar graph
Same as segmented bar graph, but width is is proportional to group size
Quantitative Discrete Data
A countable number of values, often represented as whole numbers. (number of students in a class/number of cars in a parking lot)
Quantitative Continuous Data
Counted through decimals or non-whole numbers (Weight/Height)
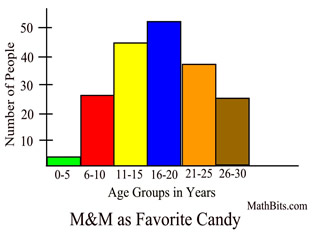
Histogram
General values unlike Dot Plots & Stem n’ Leaf plots
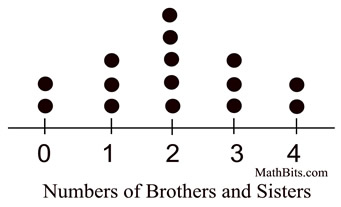
Dot Plots
A graphical display that uses dots to represent individual data points along a number line, emphasizing the distribution of small datasets.
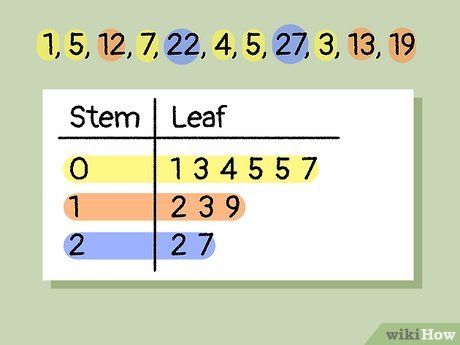
Stem & Leaf Plot
A type of graphical display that shows data by splitting each value into a "stem" (the leading digit) and a "leaf" (the trailing digit), preserving the original data while showing its distribution.
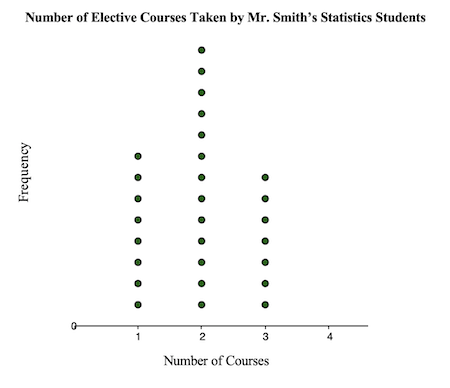
Unimodal
A distribution with a single peak
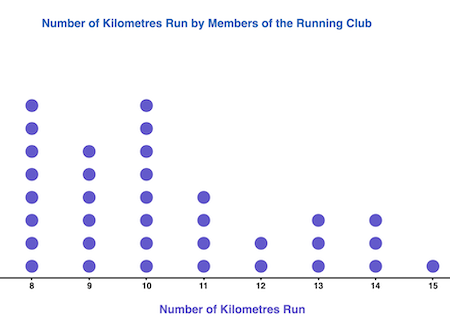
Bimodal
A distribution with two peaks
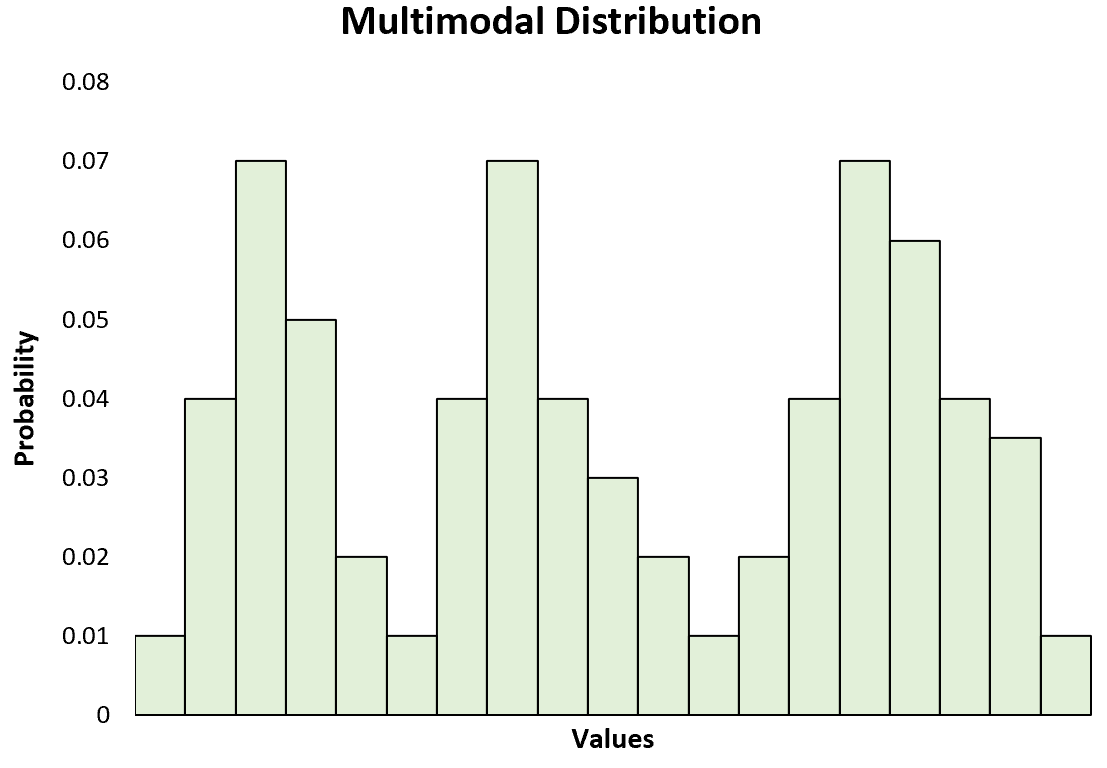
Multimodal
A distribution with multiple peaks.
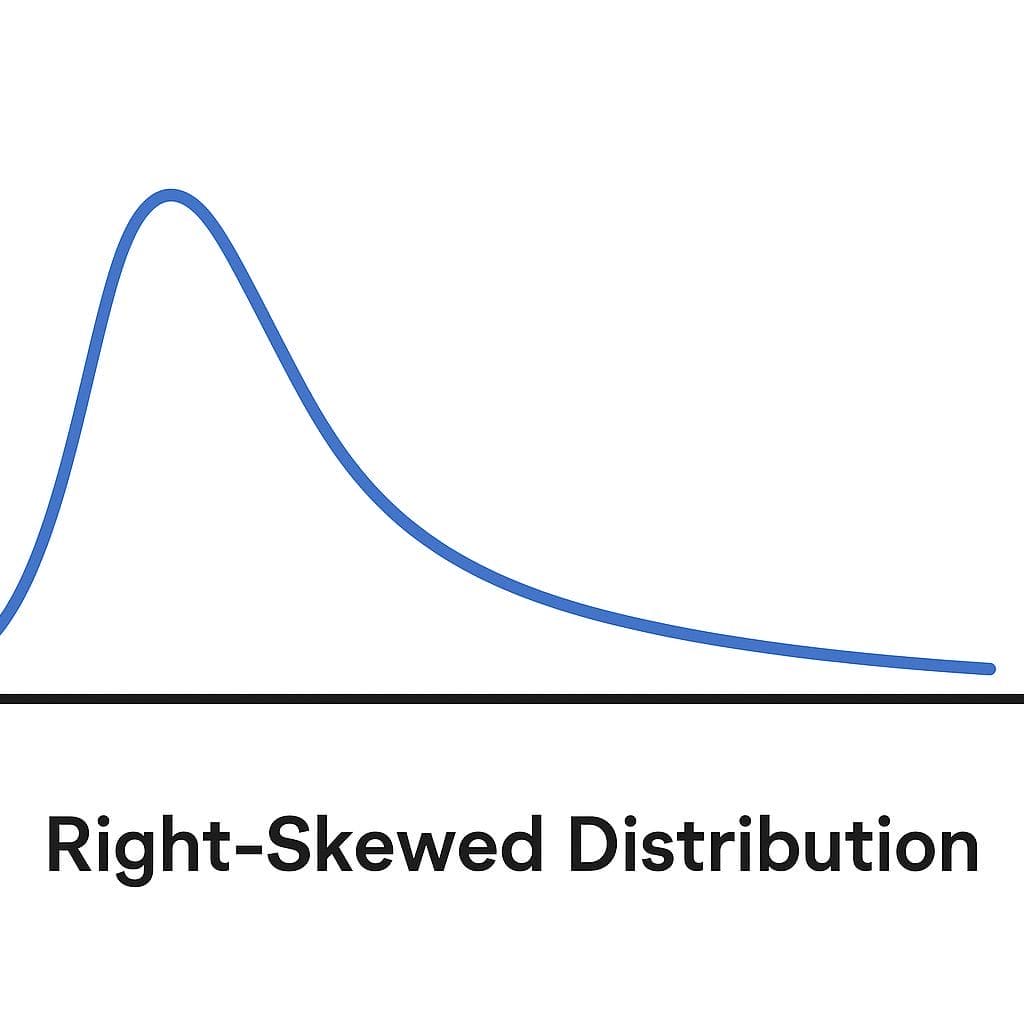
Skewed Right
Less data on the right side
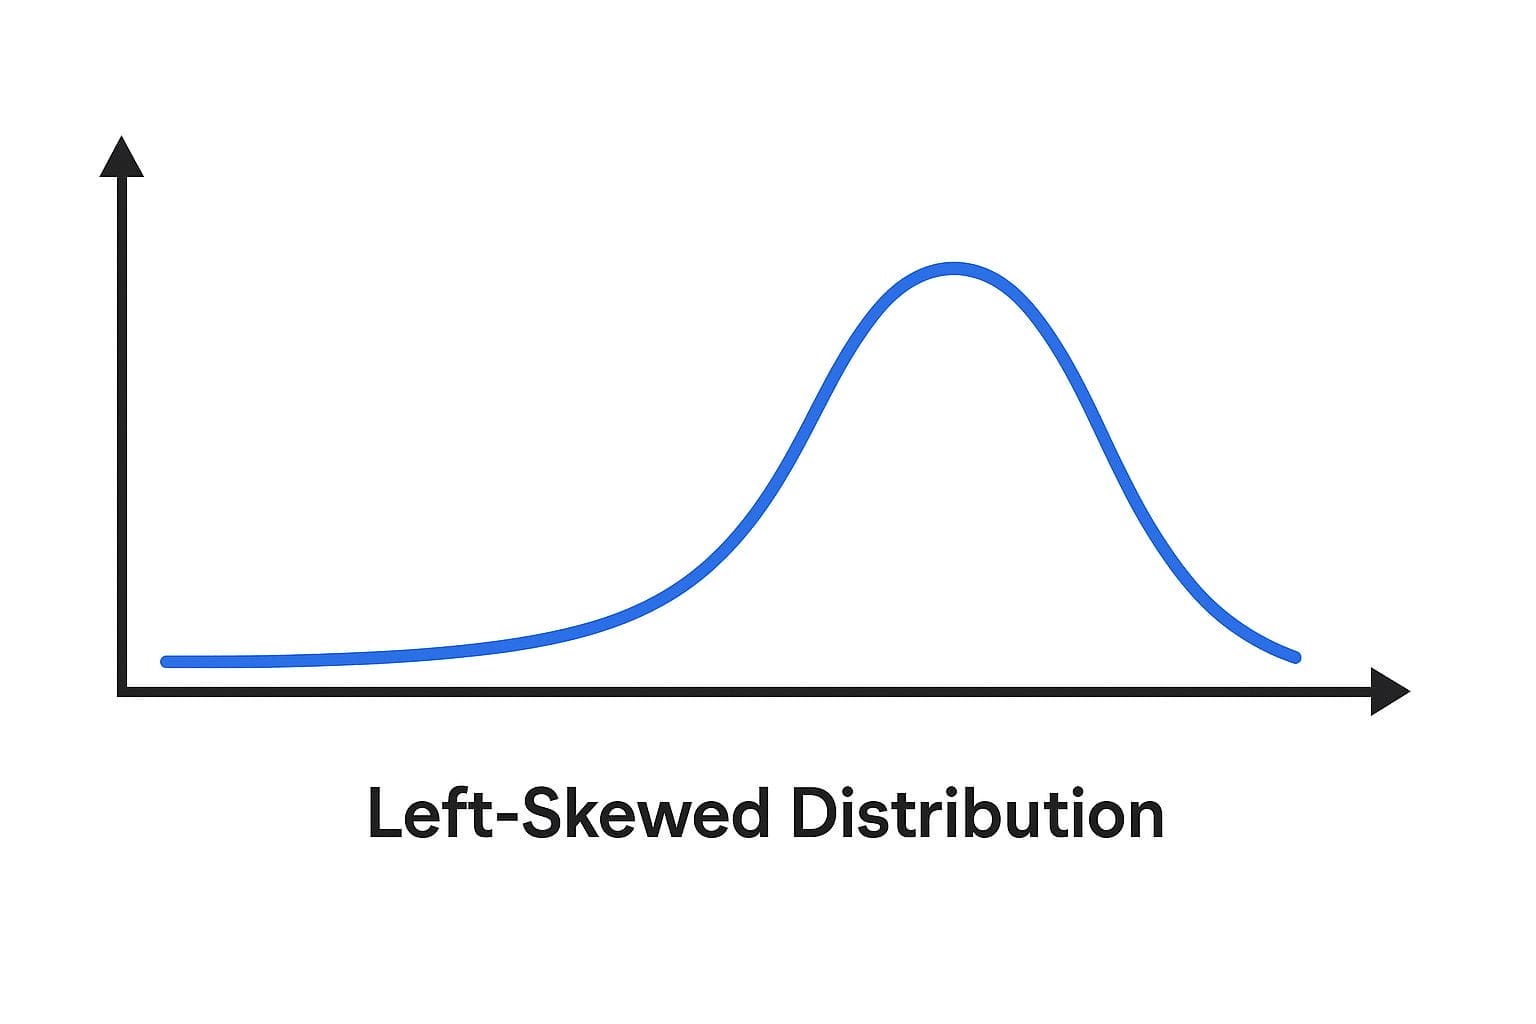
Skewed Left
Less data on the left side
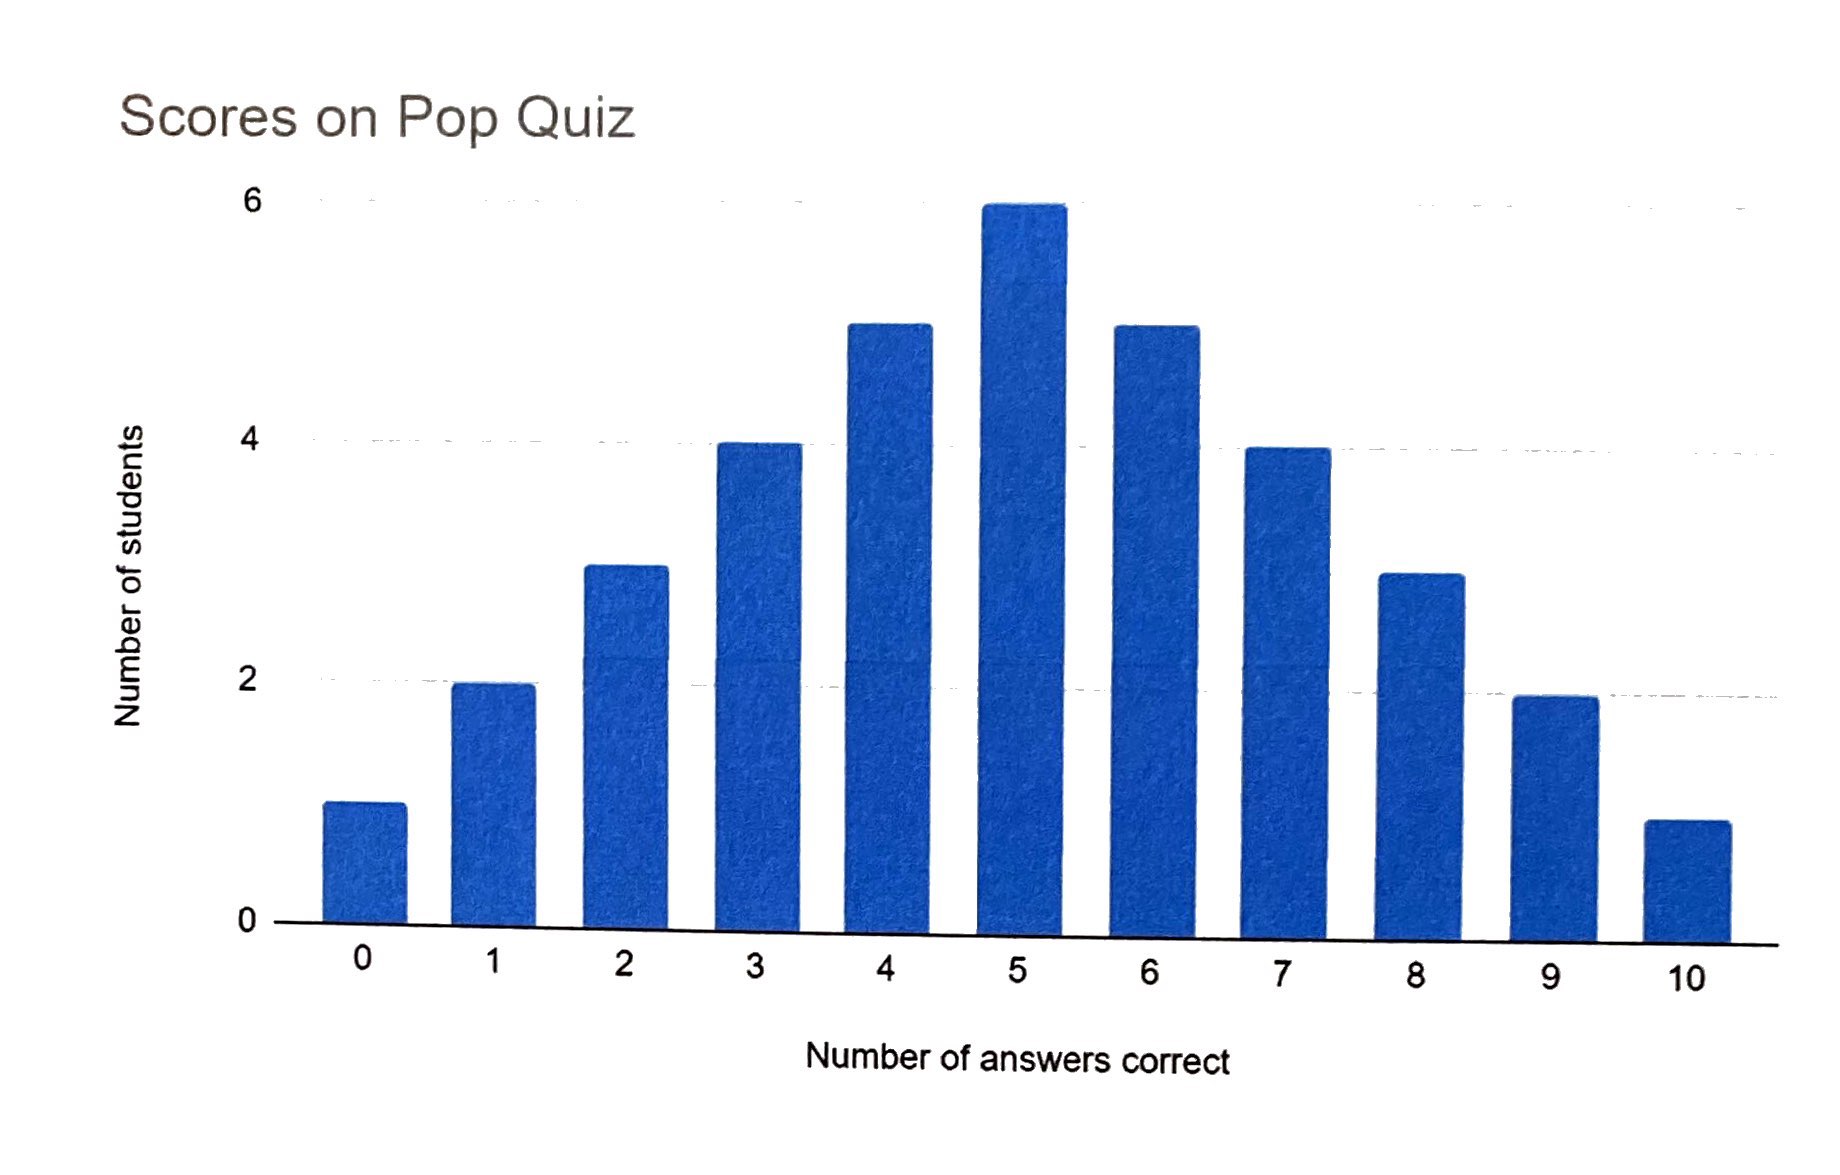
Symmetric Distribution
Where left and right sides are mirror images of each other
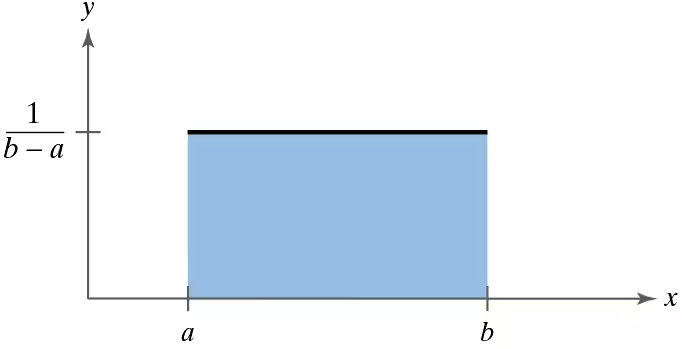
Uniform Distribution
A probability distribution where all outcomes are equally likely, resulting in a flat shape.
Describing Distribution
Shape/Outliers/Center/Variability + Context (SOCV)
Range
The difference between the maximum and minimum values in a data set, indicating the spread of the data. Maximum—Minimum
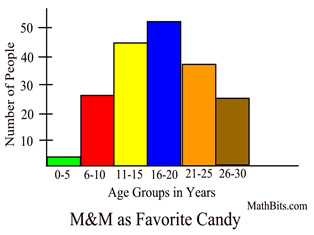
Histogram
A graphical representation of the distribution of numerical data, where the data is grouped into bins and the frequency of each bin is shown with bars.
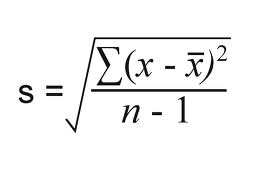
Standard Deviation
Measures the distance of values from the mean in a data set
Standard Deviation Calculation