macroeconomic theory - unit 1
 Call Kai
 Learn
Learn Practice Test
 Spaced Repetition
 Match
Match Flashcards
 Knowt Play
1/104

There's no tags or description
Looks like no tags are added yet.
Name | Mastery | Learn | Test | Matching | Spaced | Call with Kai | Chat |
|---|
No analytics yet
Send a link to your students to track their progress
105 Terms
real GDP per person has..
risen despite recessions due to long run growth and the business cycle
long-run growth (impact on real GDP per person rising over time)
reflects productivity growth, capital accumulation, and improvements in technology. small differences in growth rates over long periods of time have major implications for incomes over time. growth rates also differ across countries
business cycle (impact on real GDP per person rising over time)
economies experience expansions and recessions. these recessions happen about every 5-10 years since WWII
inflation (above and below zero)
the rate at which price levels rise. when prices are rising, the inflation rate is above 0. when prices are falling the inflation rate is below zero
deflation
a sustained decline in the overall price level
economic models
organize thinking and allow counterfactual “what if” analysis. they simplify a complex reality by showing relationships between variables and explain economic behavior and policy choices. organize decisions around an equilibrium
a farmer sells wheat for $1. the miller sells flour for $3. the baker sells bread to a consumer for $6. what are the values added by the farmer, miller, and baker - and total GDP.
farmer: $1
miller: $2
baker: $3
GDP: $6
consumption
value of all goods and services bought by households. takes up majority of the GDP. has shifted heavily towards services
investment
spending on capital - physical assets used in future production
stock
a quantity measured at a point in time (a person’s wealth, number of people with college degrees, the government debt)
flow
a quantity measured per unit of time (a person’s annual saving, number of new college graduates this year, the government budget deficit)
net exports
exports - imports. measure net spending from abroad on domestically produced goods and services
gross national product
measures the value of final goods and services produced by a country’s residents, regardless of where they are located. if a Japanese company produces cars in texas, the production counts towards US GDP, but the income going back to Japanese owners is associated with Japan’s GNP
gross domestic product
value of final goods and services produced within a country’s borders, regardless of who owns the businesses or factors of production. if a US company produces goods in Mexico, the production counts towards Mexico’s GDP but can count toward US GNP
nominal GDP
values production using current year prices
real GDP
measures the value of final goods and services using a base year price, removing the effect of inflation
GDP deflator formula
100 x (nominal GDP / real GDP)
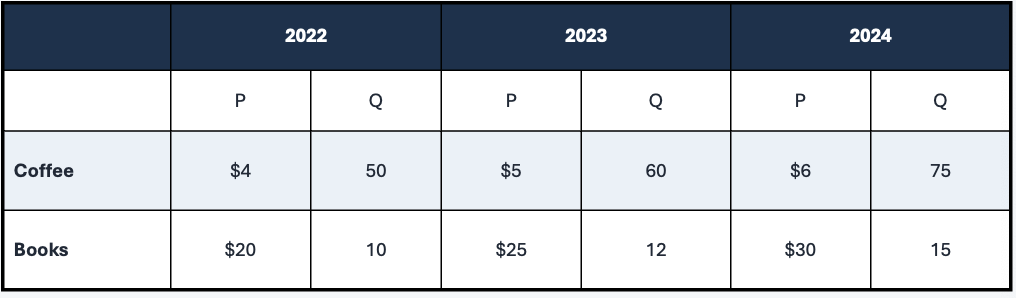
what is the nominal and real GDP for 2022, 2023, and 2024. use 2022 as the base year
nominal: $400, $600, $900
real: $400, $480, $600
inflation rate formula
((new deflator - old deflator) / old deflator ) x 100

find the GDP deflator and inflation rates
GDP deflator: 100, 125, 150
inflation rates: 25%, 20%
consumer price index
weighted average of the overall level of consumer prices, published by the Bureau of Labor Statistics. tracks changes in a typical household’s cost of living, adjusts contracts and benefits for inflation, and compares dollar amounts over time
CPI formula
(cost of basket in current year / cost of basket in the base year) x 100

find the Cost, CPI, and Inflation
correct basket is A
why the CPI may overstate inflation
substitution bias (a fixed basket does not capture consumers shifting towards goods whose relative prices fall), new goods (additional choices can raise consumers’ well-being, but that benefit is not fully reflected in a fixed basket), and quality change (improvements raise the value consumers receive but can be difficult to measure completety)
capital-goods prices
included in the GDP because they are a part of investment (machines, factory equipment, or business computers). these are not included in the CPI because that measures what consumers buy.
imported consumer-goods prices
included in the CPI, excluded from the GDP deflator because the GDP deflator cares about what the domestic economy produces.
PCE deflator
nominal consumer spending / real consumer spending
the household survey places each adult into what 3 categories
employed, unemployed, not in the labor force
unemployment rate formula
(unemployed / labor force ) x 100
labor force participation rate formula
(labor force / adult population ) x 100
recessions are periods of
falling income
the unemployment rate measures the fraction of the
labor force that is not working
in US history, deflation
is rare now but has occurred at times in the past
market clearing models
assume that prices are flexible and are best applied to understand the economy in the long run because prices and wages adjust until supply equals demand. this is more realistic over long periods of time because in the short run many prices and wages can be sticky
closed-economy model formula
y= C +I +.G
examples of capital
(K) tools, machines, and structures used in production
labor
the physical and mental effort of workers (L)
if all inputs are up 20%, what would happen in each scenario
output up 20%
output up more than 20%
output up less than 20%
output up 20%: constant returns to scale
output up more than 20%: increasing returns to scale
output up less than 20%: decreasing returns to scale
name the terms in national income section
W
R
P
W/P
R/P
W: nominal wage
R: nominal rental rate
P: price of output
W/P: real wage (measured in units of output)
R/P: real rental rate
profit formula
P x Y - R x K - W x L
benefit of another worker formula
P x MPL
what do you do when P x MPL >W? MPL = W/P?
P x MPL > W : hire more employees
MPL = W/P : stop hiring
marginal product of labor formula
change in output / change in labor

calculate the marginal product of labor for L = 1…10
10, 9 , 8 , 7 , 6, 5, 4, 3, 2, 1

what should the firm do at the employment level of L=3 if W/P = 6?
hire more at 3

what should the firm do at the employment level of L=7 if W/P=6?
hire less at L=7
disposable income formula
Y - T (total income - taxes)
consumption function
C = C(Y-T)
slope of the consumption function
marginal propensity to consume (if I give you 1, how much of it will you use?)
what happens to investment when real interest rates rise
it falls
private savings formula
(Y -T) - C
disposable income - consumption
public saving formula
T - G
tax revenues - government purchases
national savings formula
Y - C - G
Government purchases increase by 100. Output and net taxes are unchanged. What is the change in national saving, ΔS?
-100
0 - 100 = -100
Net taxes increase by 100. Output and government purchases are unchanged. If MPC = 0.8, what is the change in national saving, ΔS?
+80
0.8(100) = 80
Output increases by 100. Net taxes and government purchases are unchanged. If MPC = 0.8, what is the change in national saving, ΔS?
+20
0.8 × 100 = +80
100-80-0 = 20
Employment increases by 10 workers. If MPL = 20 and remains constant over this increase, while net taxes and government purchases are unchanged, what is ΔS when MPC = 0.8?
+40
1)Output is going up by 200 (MPL x L = 20 x 10)
2)Multiply 0.8 x 200 = 160
3)200 – 160 -0 = 40
demand for loanable funds formula
Y - C - G = I
or Y = C+G+I
the fort motor company makes a car in 2020 and sells it to the jones family in 2021. what effect does this have on GDP and consumption
increases consumption in 2021 and GDP in 2020
if nominal GDP and real GDP both rise by 10%, then the GDP deflator
is unchanged

using 2010 as the base year, what is the nominal GDP in 2010
1,000
using 2010 as the base year, what is the nominal GDP in 2018
3,000
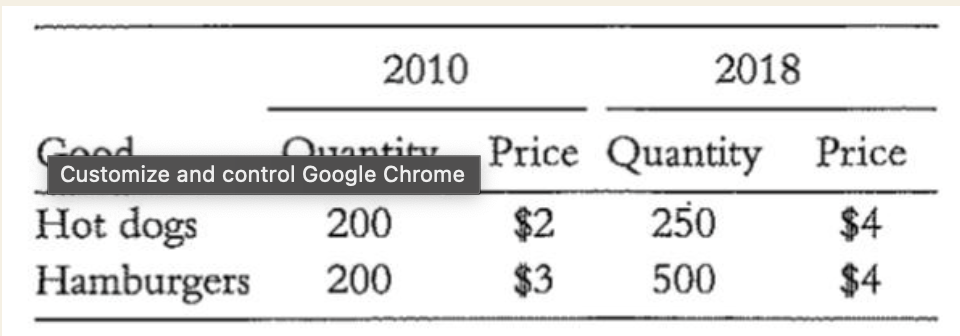
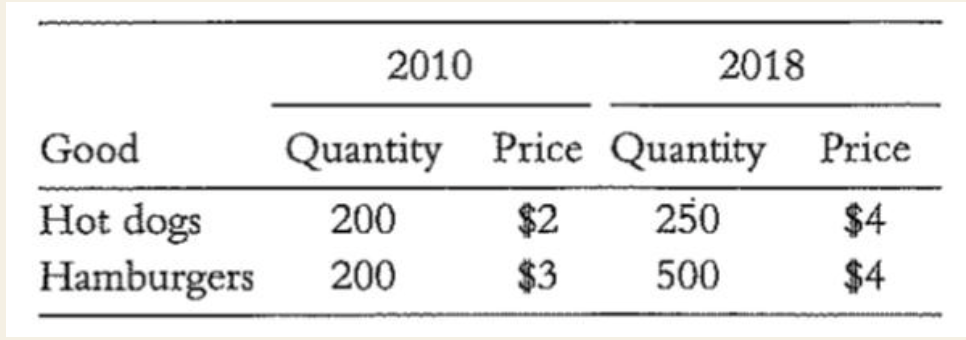
using 2010 as the base year, what is the real GDP in 2010
1,000

using 2010 as the base year, what is the real GDP in 2018
2,000

using 2010 as the base year, what is the GDP deflator in 2018
1.5

using 2010 as the base year, what is the CPI in 2018
1.6
An economy has 100 people divided among the following groups: 25 have full-time jobs, 20 have one part-time job, 5 have two part-time jobs, 10 would like to work and are looking for jobs, 10 would like to work but are so discouraged they have given up looking, 10 are running their own businesses, 10 are retired, and 10 are small children.
Calculate the labor force.
70
An economy has 100 people divided among the following groups: 25 have full-time jobs, 20 have one part-time job, 5 have two part-time jobs, 10 would like to work and are looking for jobs, 10 would like to work but are so discouraged they have given up looking, 10 are running their own businesses, 10 are retired, and 10 are small children.
Calculate the labor force participation rate.
77.8
An economy has 100 people divided among the following groups: 25 have full-time jobs, 20 have one part-time job, 5 have two part-time jobs, 10 would like to work and are looking for jobs, 10 would like to work but are so discouraged they have given up looking, 10 are running their own businesses, 10 are retired, and 10 are small children.
Calculate the number of unemployed people.
10
An economy has 100 people divided among the following groups: 25 have full-time jobs, 20 have one part-time job, 5 have two part-time jobs, 10 would like to work and are looking for jobs, 10 would like to work but are so discouraged they have given up looking, 10 are running their own businesses, 10 are retired, and 10 are small children.
Calculate the unemployment rate.
14.3
A manager of a perfectly competitive firm observes that the marginal product of labor is 5 units per hour, the marginal product of capital is 40 units per machine, the wage is $20 per hour, the rental price of capital is $120 per machine, and the price of output is $5 per unit. To maximize profit, the manager should hire _______ labor and rent _______ capital.
more , more
An economy has the Cobb-Douglas production function Y = 10K(1/3)L(2/3). If the economy's stock of capital doubles, the share of total income paid to the owners of capital will
stay the same
If immigration increases the labor force in an economy with a Cobb-Douglas production function, the wage _______ and the rental price of capital _______ .
decreases, increases
what happens to investment when the real interest rates increases
investment decreases
If national income is $1,200, consumption is $600, taxes are $200, and government purchases are $300, then national saving is
300
if the government decreases spending holding taxes constant, what happens to equilibrium real interest rate and investment?
real interest rate decreases and investment increases
effect of a larger labor force
productivity of capital increases, driving real rental prices up
if an earthquake destroyed a portion of the capital stock, what would be the impact on the real wage and the rental price of capital
the marginal product of the remaining capital increases thus increasing real rental prices. there are now a greater number of workers per unit of capital so MPL declines, declining real wages.
if technological advances improve the production function, what would be the impact on the real wage and real rental prices
they both would increase because they now have higher marginal productivity
high inflation, which doubles the prices of all inputs and outputs does what to real wages and real rental prices
it would not effect either of them, since both input and output costs double wages and rental prices will not be impacted
Suppose the production function in Medieval Europe is Y = K0.5L0.5 , where K is the amount of land and L is the amount of labor. The economy begins with 100 units of land and 100 units of labor. Using a calculator and equations from the chapter, calculate the output this economy produces.
100
Suppose the production function in Medieval Europe is Y = K0.5L0.5 , where K is the amount of land and L is the amount of labor. The economy begins with 100 units of land and 100 units of labor. Using a calculator and equations from the chapter, calculate the equilibrium wage
0.5
Suppose the production function in Medieval Europe is Y = K0.5L0.5 , where K is the amount of land and L is the amount of labor. The economy begins with 100 units of land and 100 units of labor. Using a calculator and equations from the chapter, calculate the rental price of land
0.5
Suppose the production function in Medieval Europe is Y = K0.5L0.5 , where K is the amount of land and L is the amount of labor. The economy begins with 100 units of land and 100 units of labor. Using a calculator and equations from the chapter, calculate the share of output that labor recieves
50%
Suppose the production function in Medieval Europe is Y = K0.5L0.5 , where K is the amount of land and L is the amount of labor. The economy begins with 100 units of land and 100 units of labor. Using a calculator and equations from the chapter, calculate the output if a plague kills half the population
70.70
Suppose the production function in Medieval Europe is Y = K0.5L0.5 , where K is the amount of land and L is the amount of labor. The economy begins with 100 units of land and 100 units of labor. Using a calculator and equations from the chapter, calculate the new wage if a plague kills ½ the population
0.71
Suppose the production function in Medieval Europe is Y = K0.5L0.5 , where K is the amount of land and L is the amount of labor. The economy begins with 100 units of land and 100 units of labor. Using a calculator and equations from the chapter, calculate the new rental price of land if a plague kills ½ the population
0.35
Suppose the production function in Medieval Europe is Y = K0.5L0.5 , where K is the amount of land and L is the amount of labor. The economy begins with 100 units of land and 100 units of labor. Using a calculator and equations from the chapter, calculate the new share of output labor receives if a plague kills ½ the population
50%
the government raises taxes by $100 billion. if the marginal propensity to consume is 0.6, how will this change impact public saving?
increase by 100B
The government raises taxes by $100 billion. If the marginal propensity to consume is 0.6, how will this change impact private saving?
decrease by 40B
The government raises taxes by $100 billion. If the marginal propensity to consume is 0.6, how will this change impact national saving?
increase by 60B
The government raises taxes by $100 billion. If the marginal propensity to consume is 0.6, how will this change impact investment?
increase by 60B
Suppose that an increase in consumer confidence raises consumers' expectations about their future income and thus raises the amount that they want to consume today. This might be interpreted as an upward shift in the consumption function. This shift will _______ investment and _______ the interest rate.
decrease, increase
natural rate of unemployment
the average rate around which actual unemployment fluctuates over the business cycle
unemployment rate formula
u= U/L or (U/U+E) x 100
An economy has 160 million employed people, 8 million unemployed people, and 72 million people not in the labor force. What is the unemployment rate?
4.8%
seperation rate
fraction of employed workers who become unemployed during the period (when someone gets fired or quits). less cyclical (does not move with the business cycle)
job-finding rate
fraction of unemployed workers who find jobs during the period (jumping from employed, to unemployed, back to employed). strongly pro cyclical (goes up when GDP goes up or economy is doing well)
how to find the employment rate with the job finding rate
finding rate x unemployed
how to find the unemployment rate given the seperation rate
seperation rate x employment