Chapter 5: Applying Consumer Theory
1/24
There's no tags or description
Looks like no tags are added yet.
Name | Mastery | Learn | Test | Matching | Spaced |
|---|
No study sessions yet.
25 Terms
What is the information we need to draw a demand curve?
By varying one price and holding other prices and income constant, we determine how the quantity demanded changes as the price changes
How to draw the demand curve given indifference curves and budget constraints
The optimal bundles can be drawn down to correspond with the price-quantity combinations
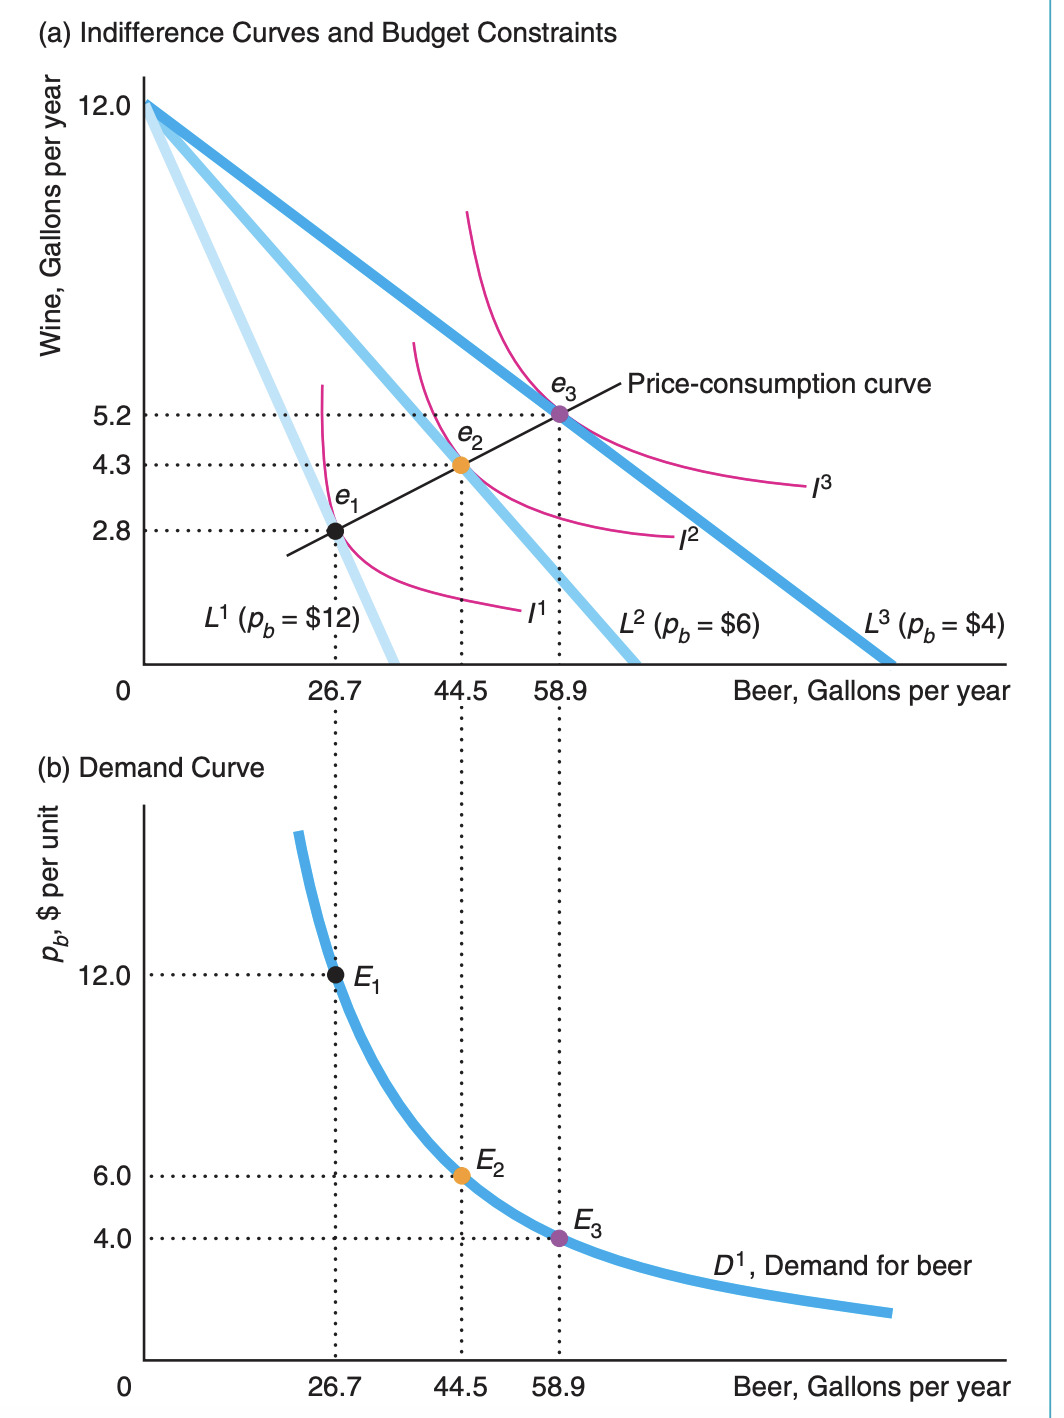
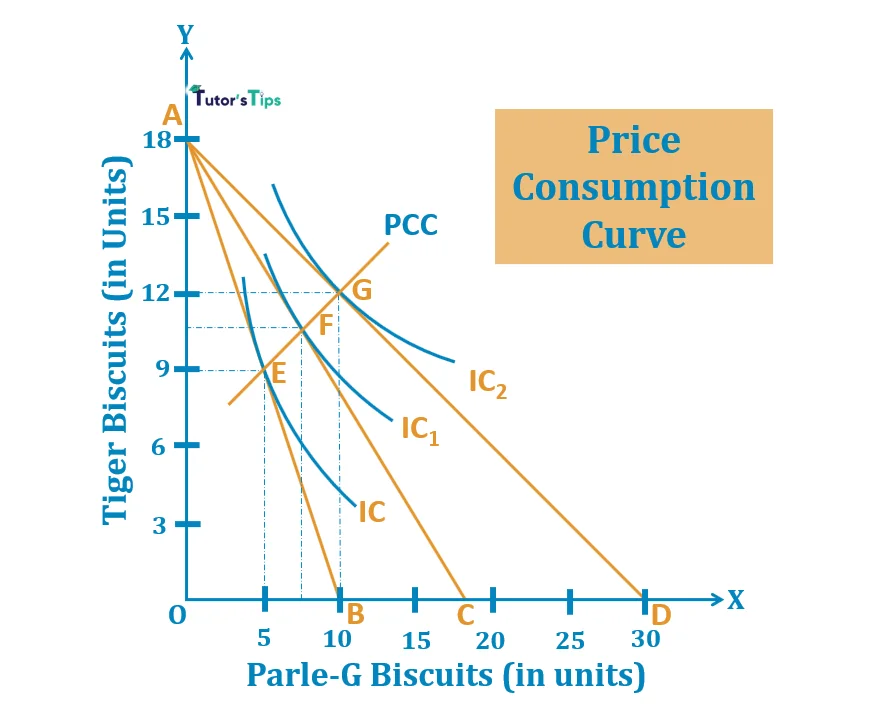
What is the price-consumption curve
the line that goes through the optimal bundles at different prices
An increase in income causes the BC to
shift out
What is the income consumption curve
The income consumption curve shows how a consumer's optimal consumption bundle changes across different income levels
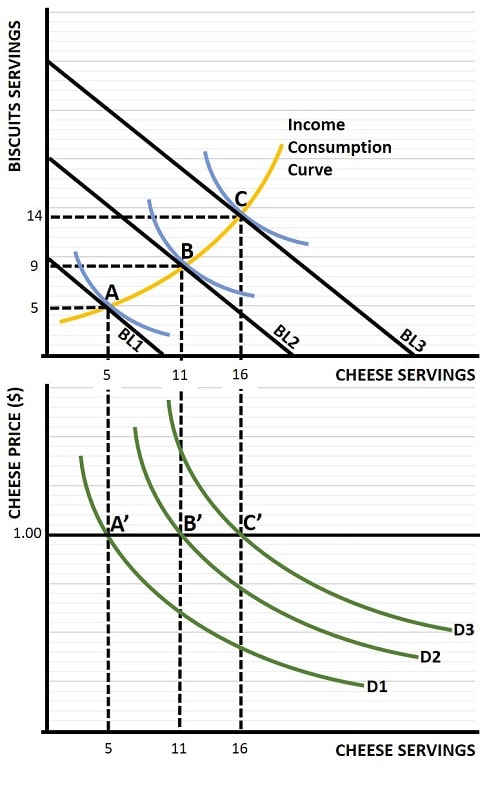
What does the Engel curve represent?
Shows the relationship between income and quantity demanded of a good, holding prices constant
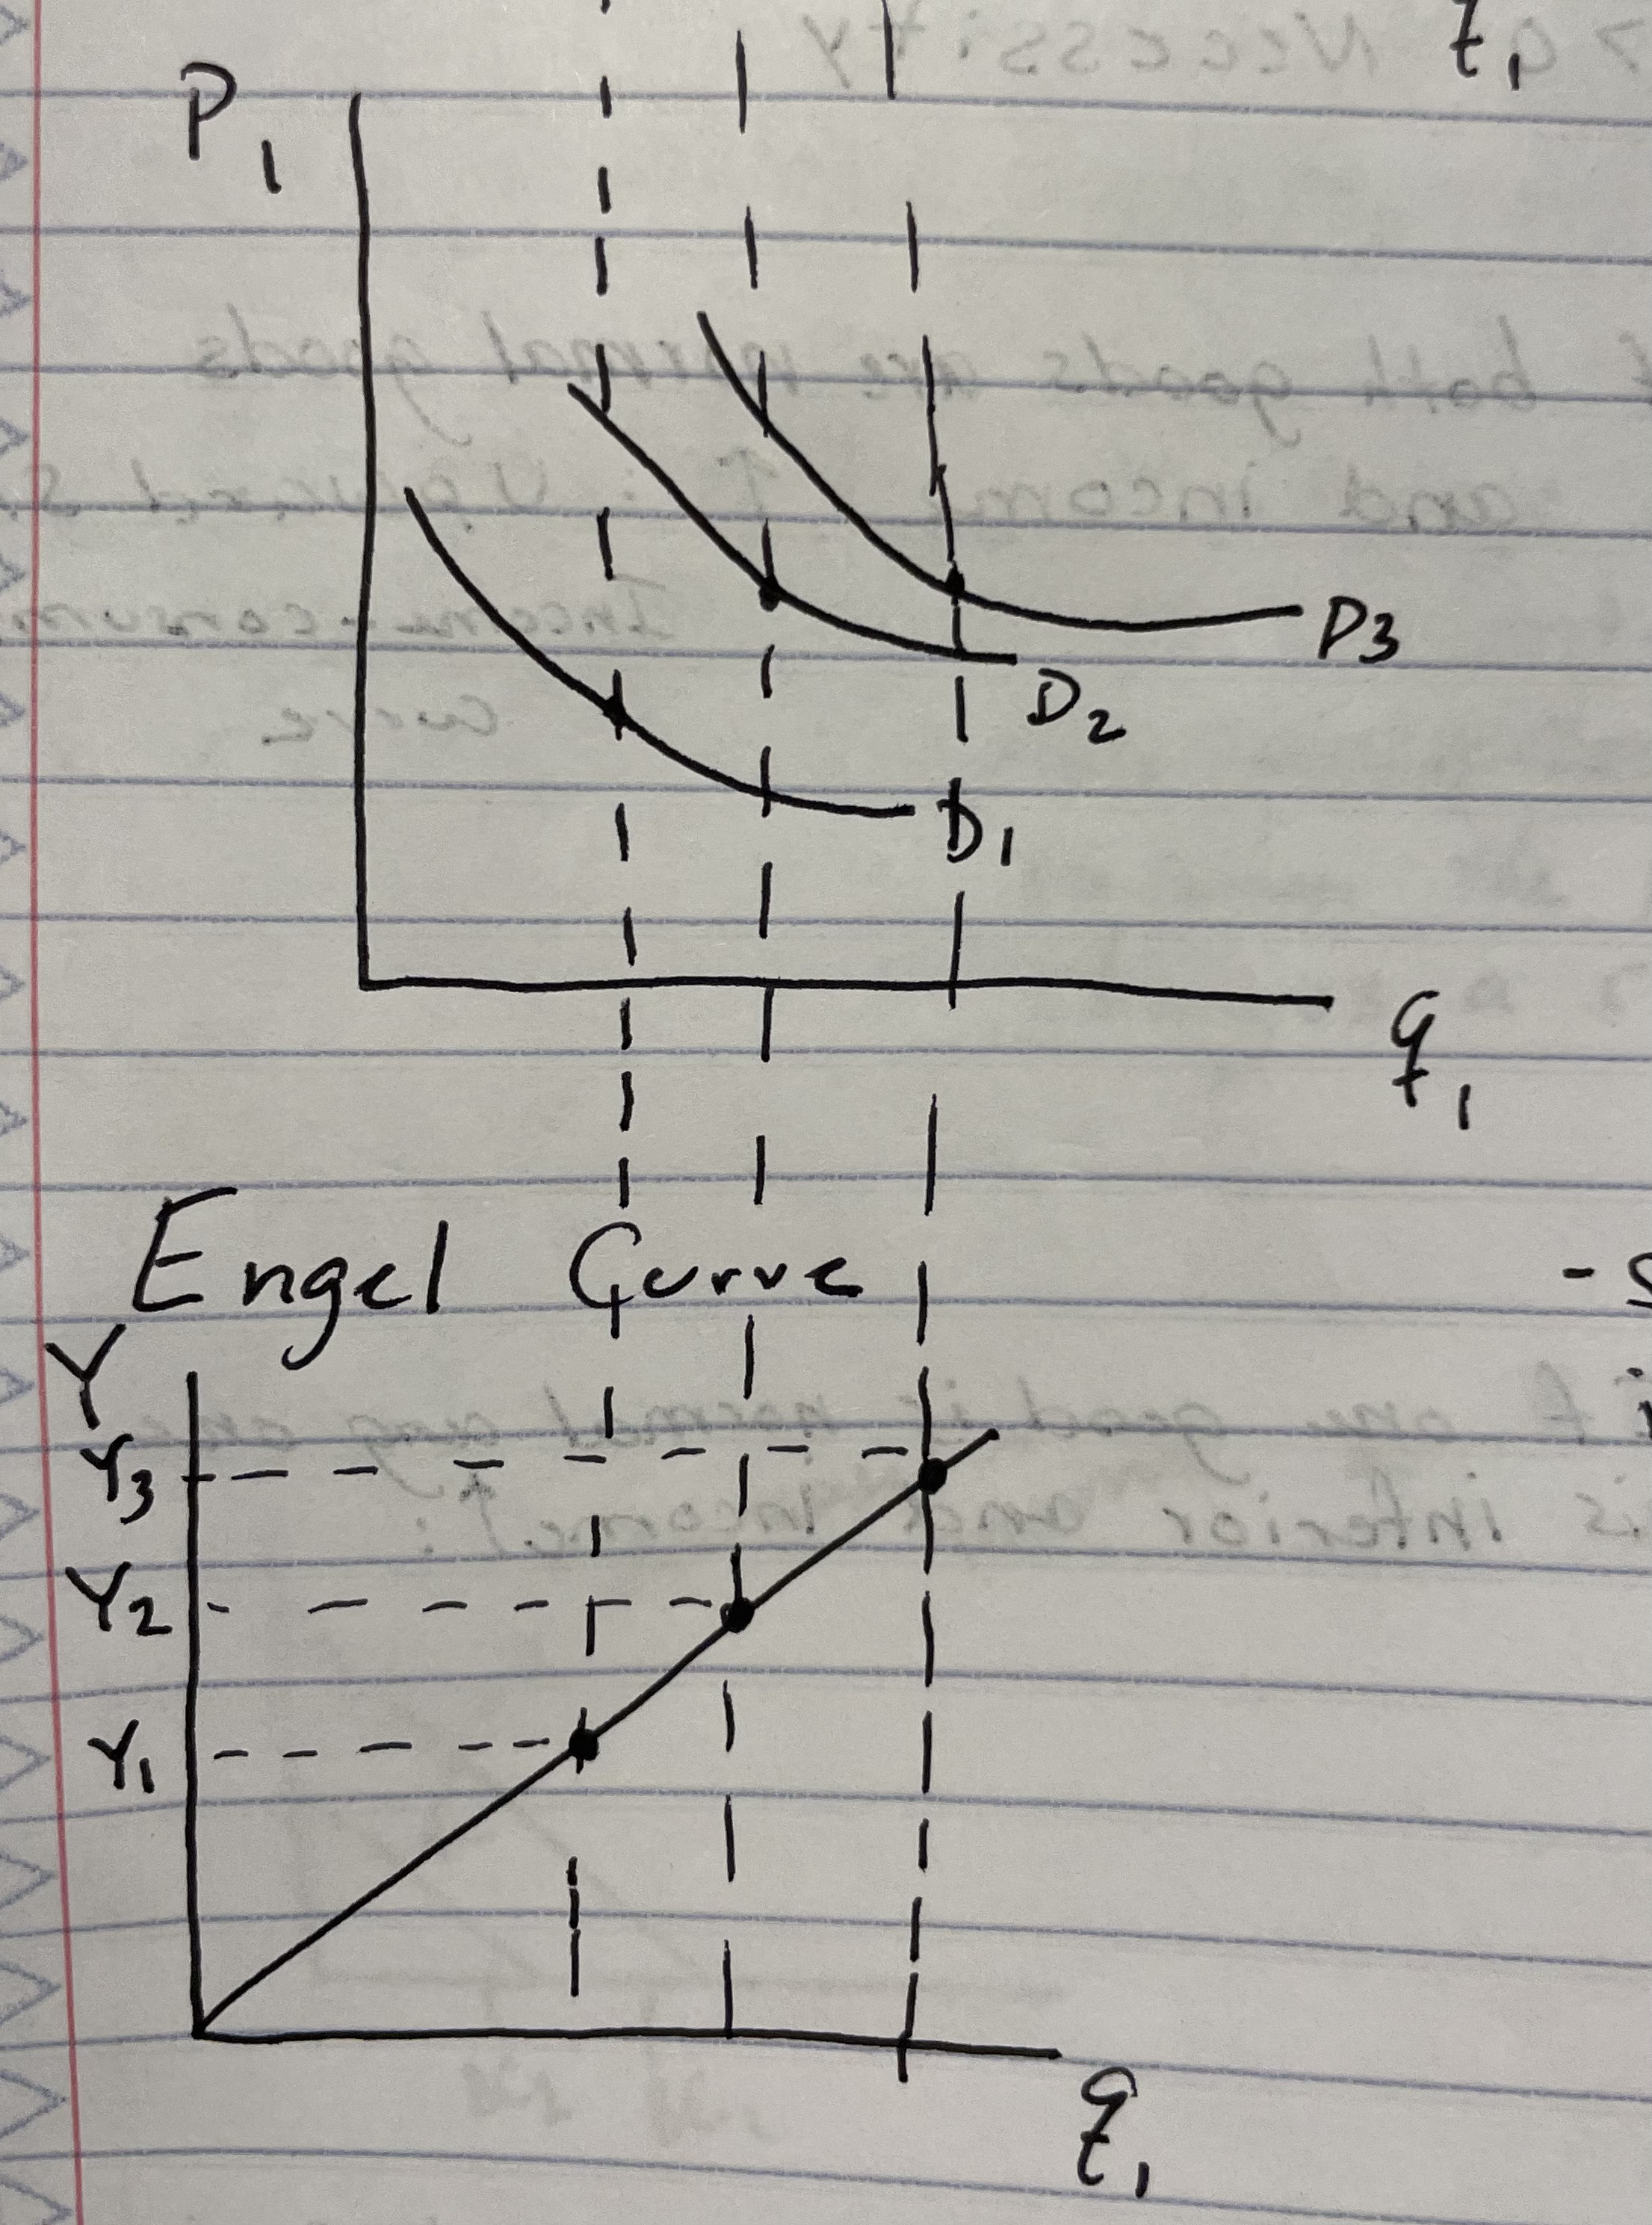
if the Engel curve/ICC is upward-sloping then the good is
a normal good
if the Engel curve/ICC is downward-sloping the good is
an inferior good
What is income elasticity and what does its values represent? ξ
ξ = dQ/dY x Y/Q
ξ > 0 normal good
ξ < 0 inferior good
ξ > 1 luxury good
1 > ξ > 0 Necessity
What tells us the sign of the income elasticity?
The shape of the income-consumption curve for two goods
TRUE or FALSE: It is impossible for both goods to be inferior
TRUE (either both goods are normal or one good is normal and the other is inferior)
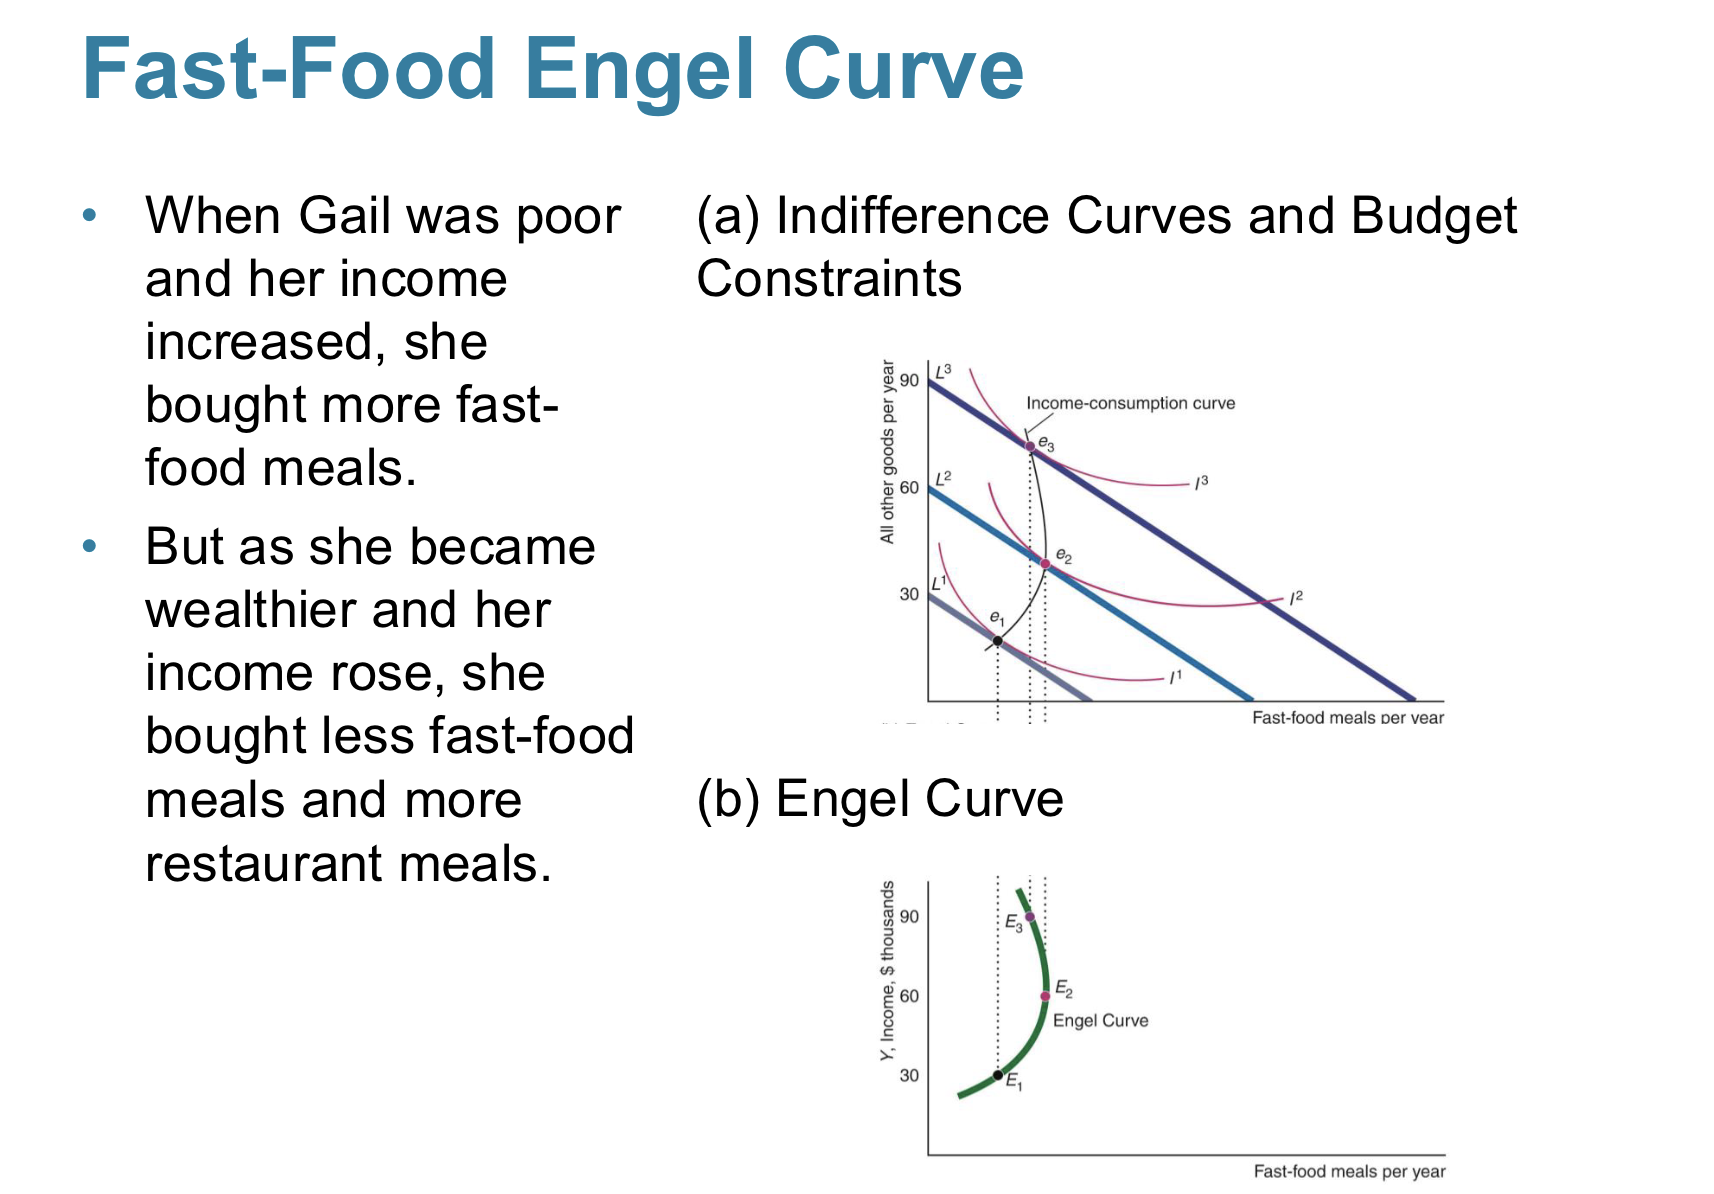
Are there cases where income-consumption curves can be backward bending?
Yes, think of the fast food example
(As a person’s income increases, a good can shift from being a normal good to an inferior good)
Increase in price has two effects:
Substitution effect
Income effect
Substitution effect
change in quantity demanded when the price for a good changes, holding other prices and utility constant.
(consumer substitutes to relatively cheaper goods)
Income effect
Change in quantity demanded due to a change in income, holding prices constant.
(when the price of a good changes, this changes the consumers purchasing power)
When both prices increase/decrease for two goods, how does that affect income?
if both prices on a BC line increase, it acts like a decrease in income (shifting the BC to the left)
if both prices on a BC line decrease, it acts like an increase in income (shifting the BC to the right)
How to calculate total change in Qd
income effect + substitution effect
The substitution effect will ALWAYS be positive for
price decreases
The substitution effect will ALWAYS be negative for
price increases
If a good is normal, the income effect is _____.
positive
If a good is inferior, the income effect is _____.
negative
The substitution effect causes a movement along
an indifference curve
The income effect causes a _____ due to a change in the consumer’s opportunity set.
shift to another indifference curve
True or false: if a good is inferior, the income and substitution effect move in opposite directions.
True
How to tell if a good is a giffen good
when the income effect more than offsets the substitution effect