3.3.4 Normal profits, supernormal profits and losses
1/11
There's no tags or description
Looks like no tags are added yet.
Name | Mastery | Learn | Test | Matching | Spaced | Call with Kai | Chat |
|---|
No analytics yet
Send a link to your students to track their progress
12 Terms
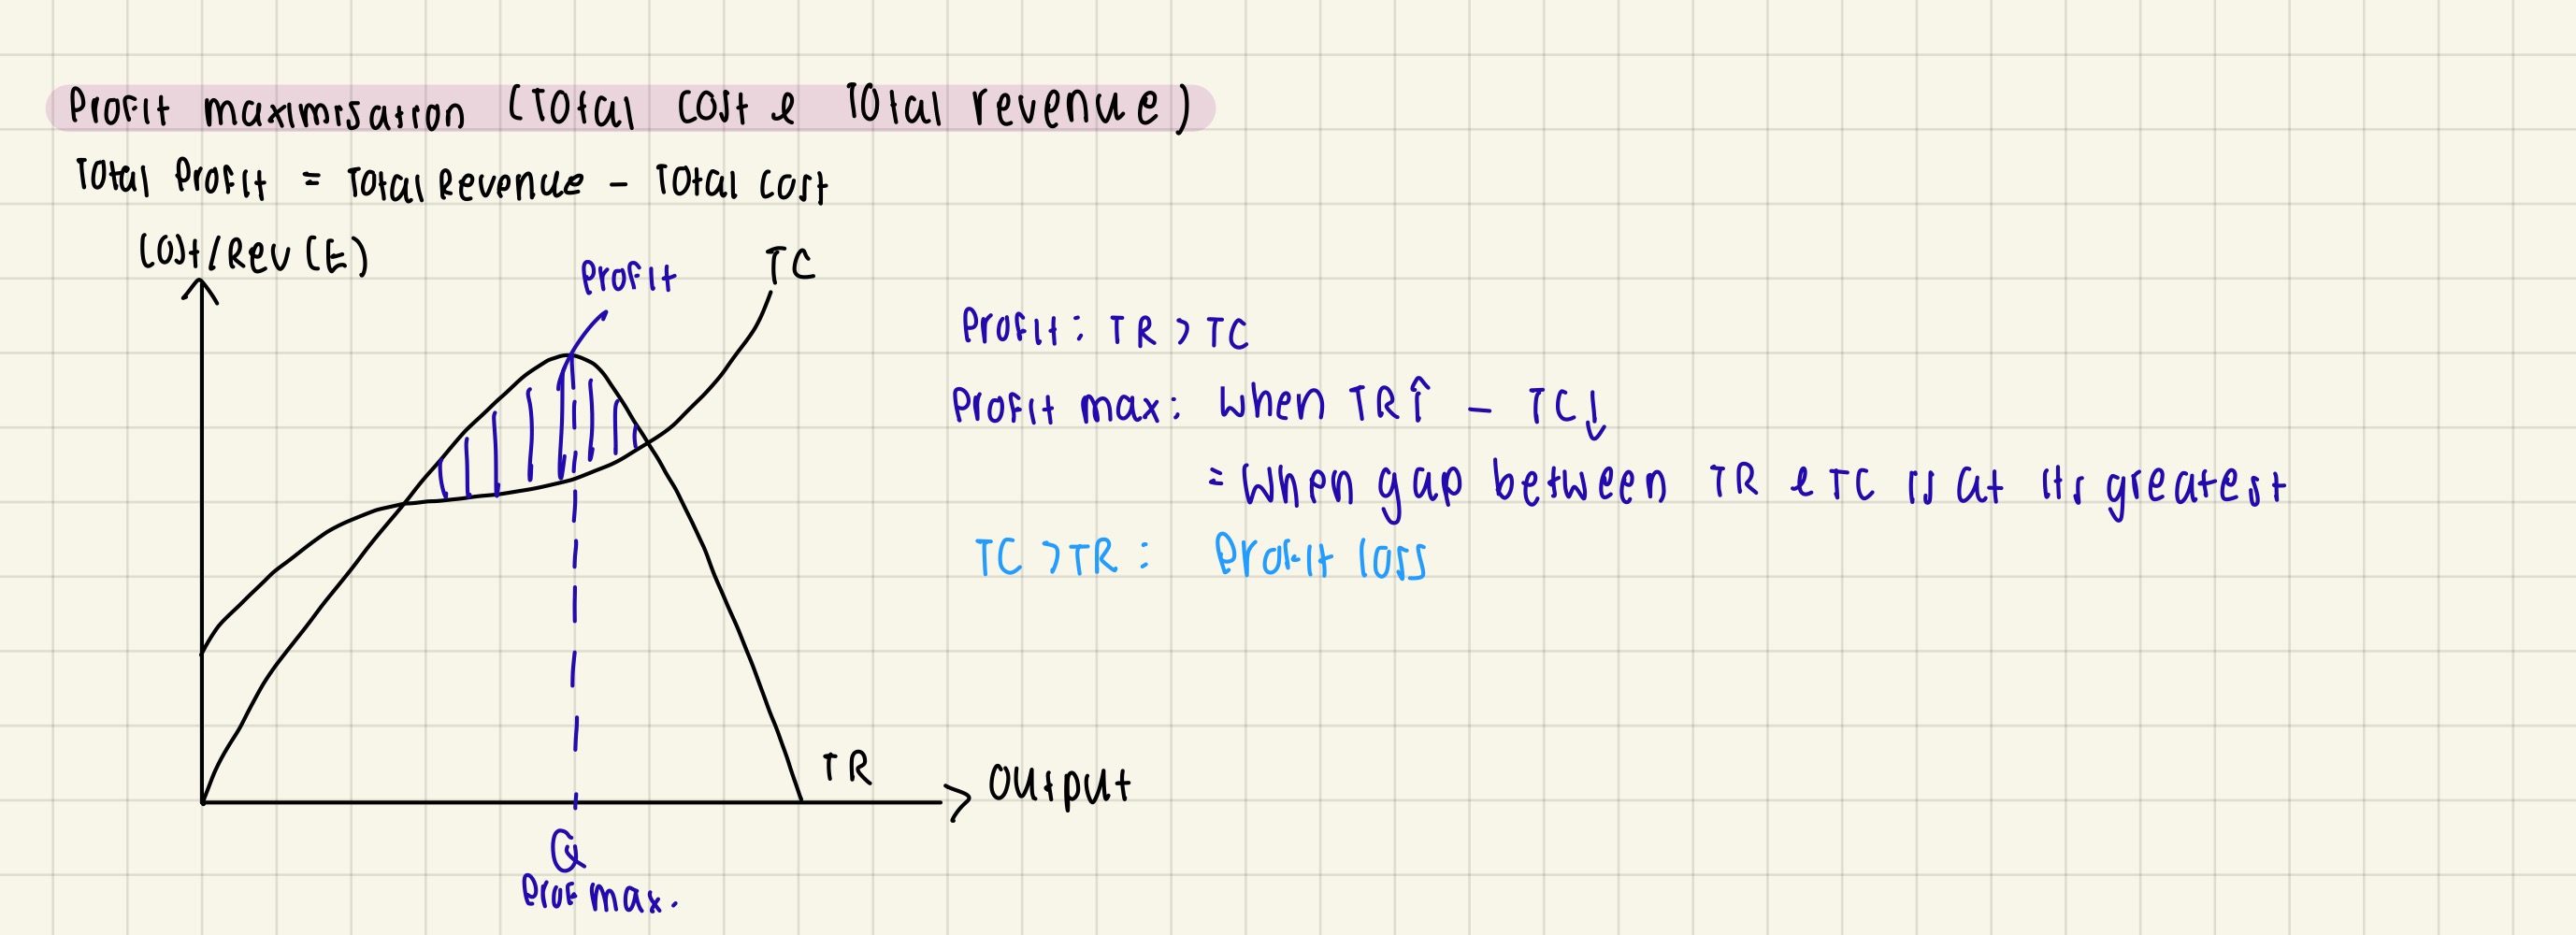
Profit maximisation shown through TC & TR curves
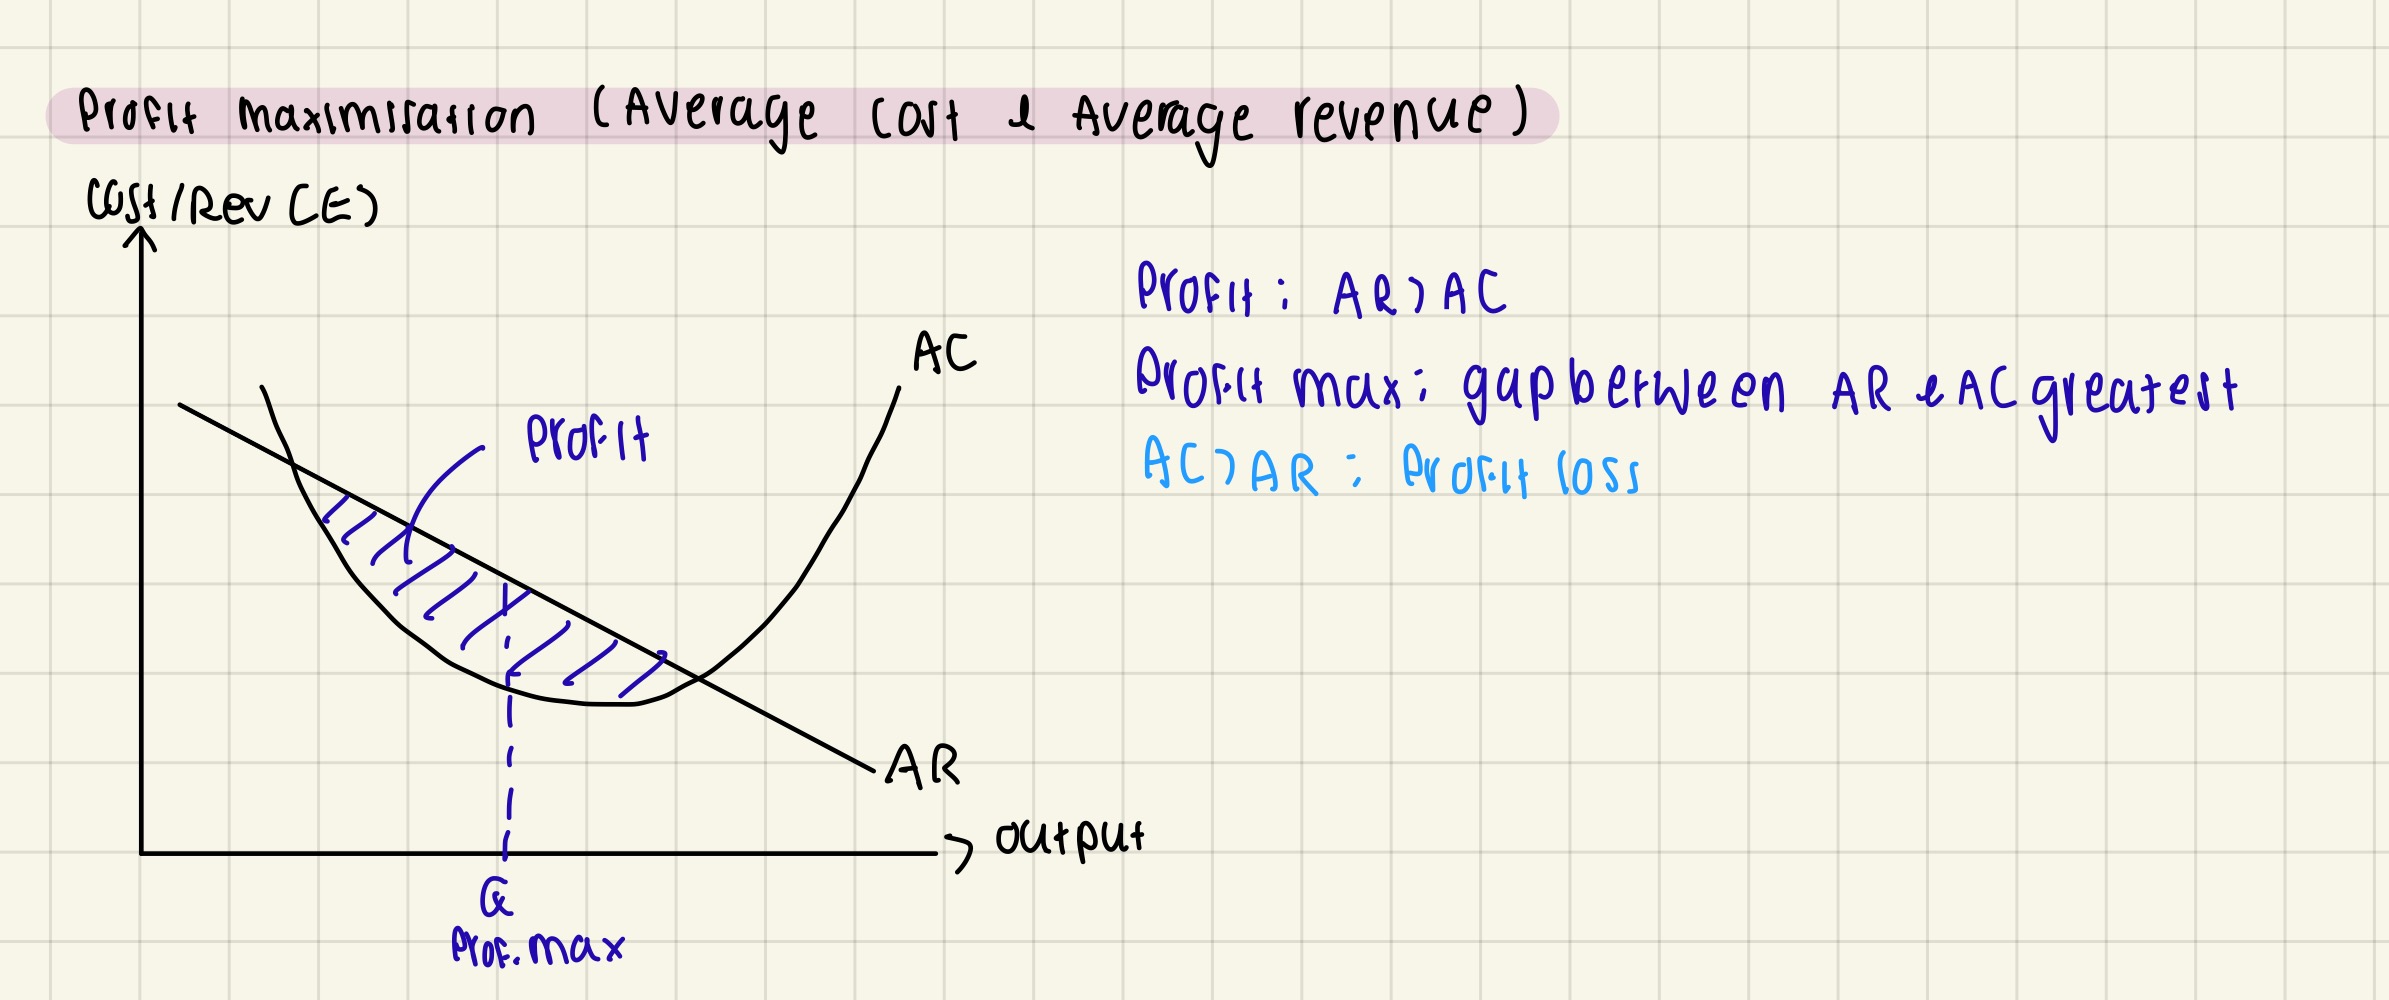
Profit maximisation shown through AC & AR curves
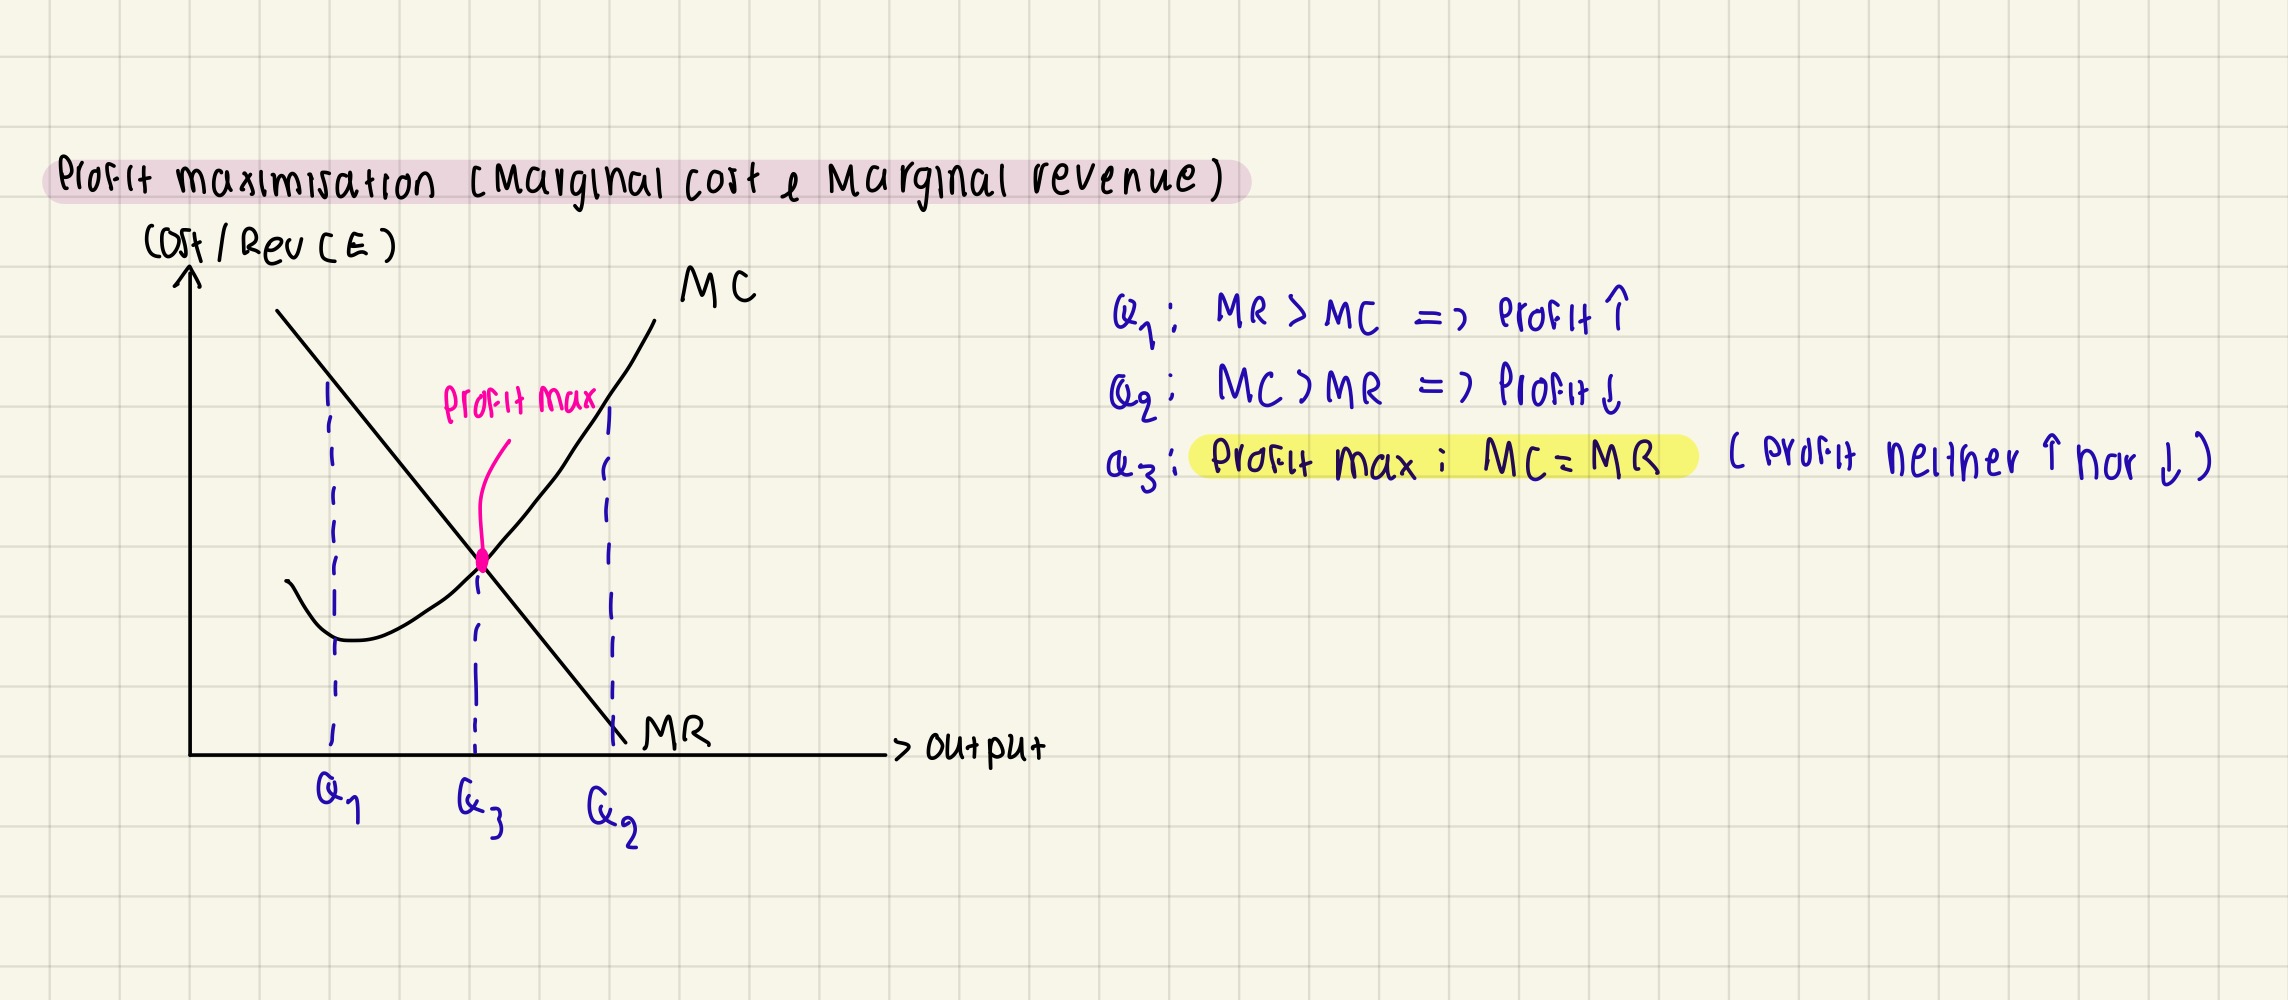
Profit maximisation shown through MC & MR curves
Condition for profit maximisation
Profit is maximised when
Gap between TR & TC is at its greatest
Gap between AR & AC is at its greatest
MC = MR
Normal profit, supernormal profit & losses (the different types of profits can be shown through TC/AC & TR/AR curves)
Normal profit (no gain nor loss)
TR = TC
AR = AC
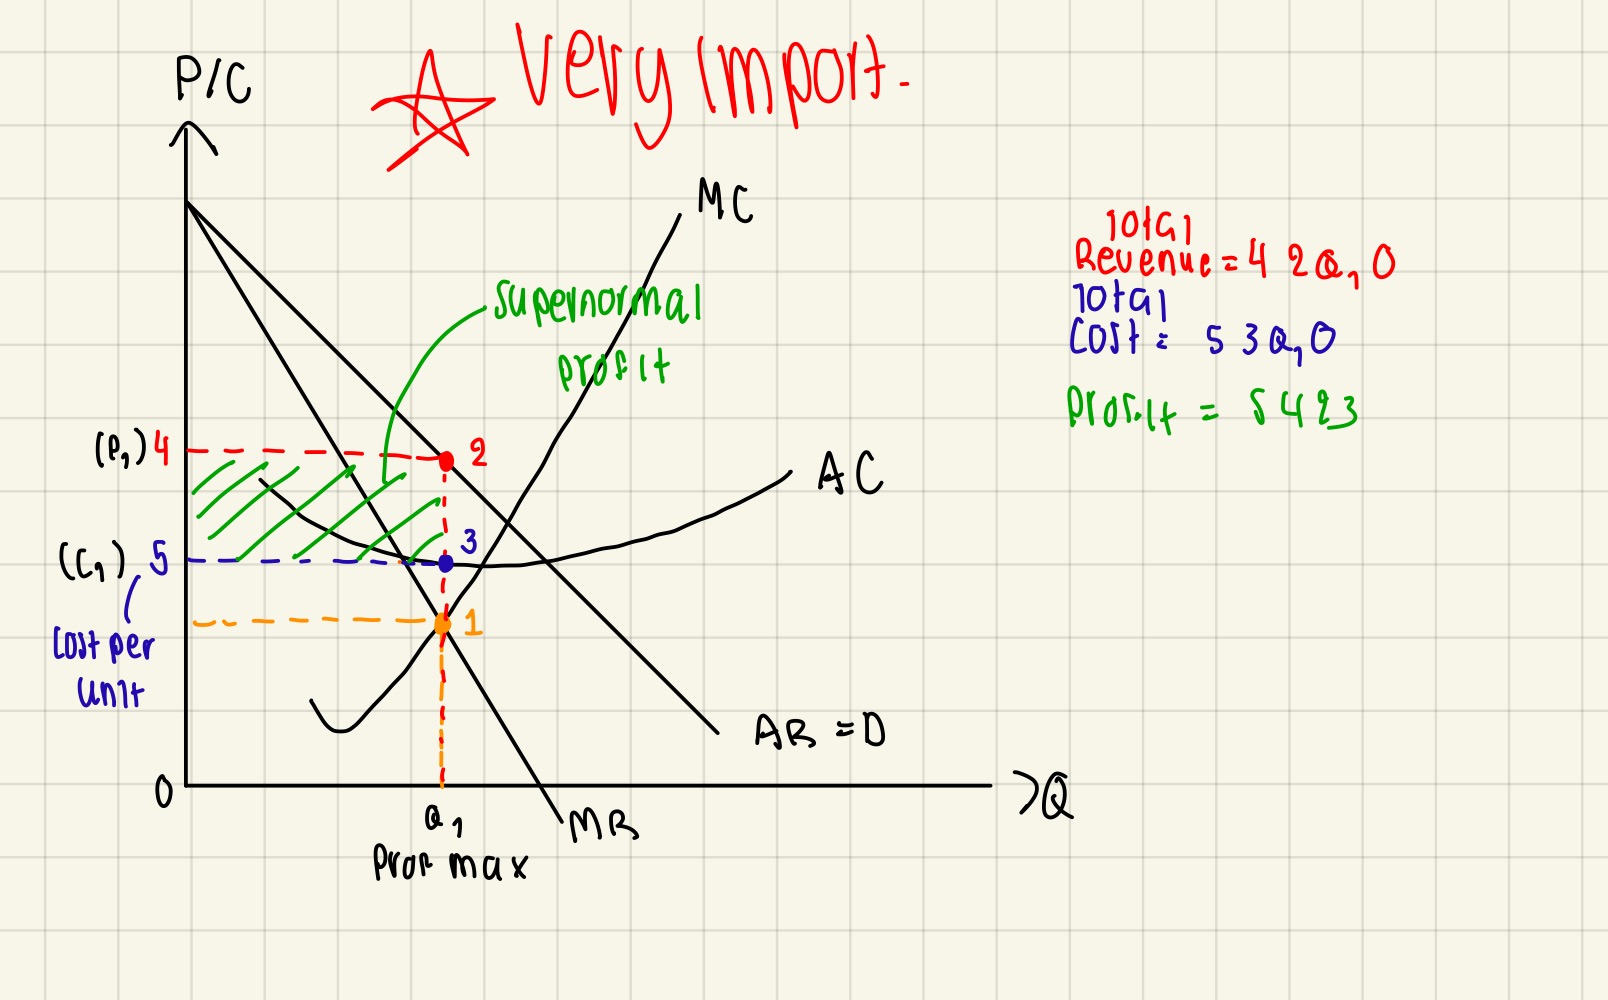
Supernormal profit (more gain than loss - actually have profit)
TR more than TC
AR more than AC
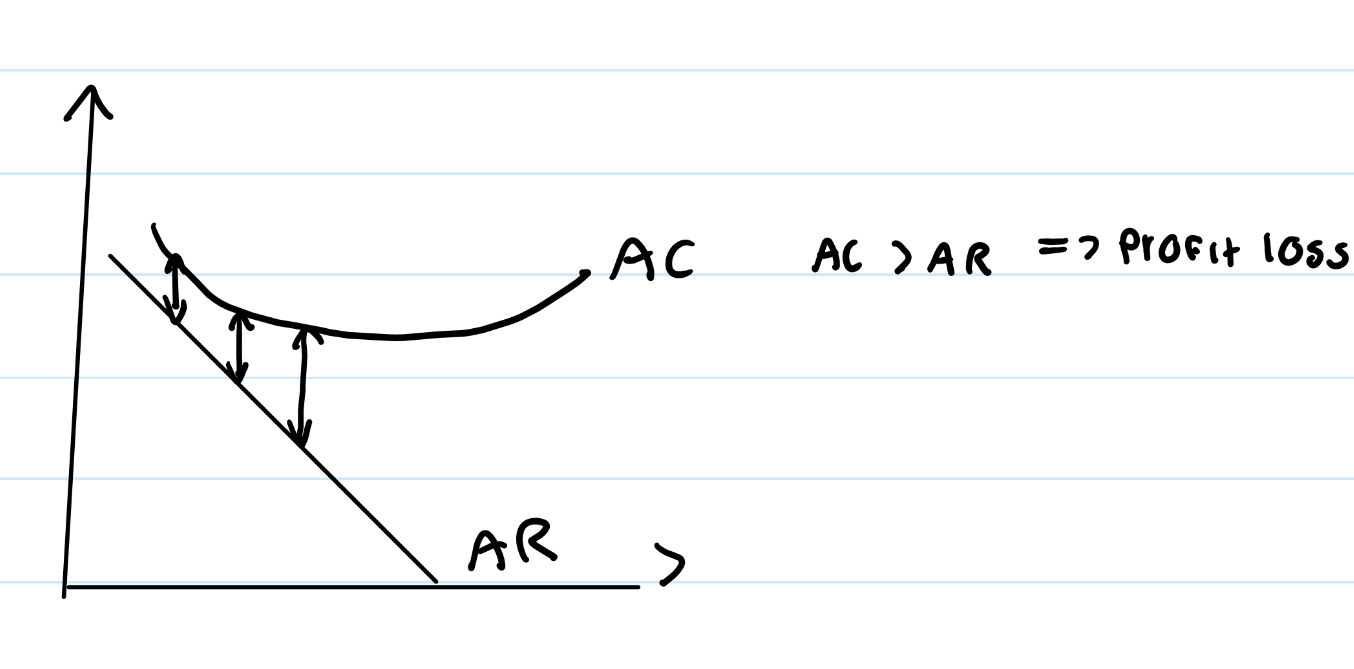
Sub-normal profit (profit loss)
TR less than TC
AR less than AC
Revenue and cost curves combined tgt
Order of drawing:
1) Draw AR = D
2) MR
3) AC
4) MC
Order of labelling:
1) MC = MR
2) Draw down to x-axis for output - label as Q prof max.
3) Draw up to AC - label y-axis as AC
4) Draw up to AR - label y-axis as AR
The effect of changes in fixed costs & variable costs on cost curves
Change in Fixed Cost → AC shift
Change in Variable Cost → AC & MC shifts
Shifts in AR & MR
If new AR (shift) → new MR too as MR is derived from AR
What are the 3 types of variations of cost/revenue graph - look out for these points from the texts when writing essays
1) change in demand/AR
2) change in FC & VC (change in costs)
3) loss in profit (quite rare)
Shift AR curve beneath AC curve
Point of revenue maximisation on the graph
1) Find where MR = 0 (from x-axis)
2) Draw a straight line up to where it meets AR & AC
3) Supernormal profit = AR - AC (same for profit max)
This will then be the value for supernormal profit for revenue maximisation
3 marker + mcq questions COMMON
3 marker:
Cost & Revenue graph (2 marks)
Explain why you are shifting the curve you are shifting (ie. VC changes so MC changes ; FC changes so AC changes but FC doesn’t affect MC so MC doesn’t change) (1 mark)
Therefore, if demand is unchanged, supernormal profit will increase (1 mark)
Any definitions from the question (1 mark)
Always annotate at the side the size of the supernormal profit just in case
Definition for profit max
MC = MR, objective of firm