Biostatistics Ch.14 Naplex 2026
 Call Kai
 Learn
Learn Practice Test
 Spaced Repetition
 Match
Match Flashcards
 Knowt Play
1/81

There's no tags or description
Looks like no tags are added yet.
Name | Mastery | Learn | Test | Matching | Spaced | Call with Kai | Chat |
|---|
No analytics yet
Send a link to your students to track their progress
82 Terms
Before studies of a drug on human subjects can begin, what application is needed with the FDA?
Investigational New Drug (IND)
Outline phase 1 of clinical trials
20-100 healthy volunteers or people with the disease state:
- safety
- dosage
Outline phase 2 of clinical trials
100-300 ppl w/ the disease:
- efficacy
- ADRs
Outline phase 3 of clinical trials
300-3000 ppl w/ disease:
- efficacy compared to other tx/placebo
- ADRs
Outline phase 4 of clinical trials
Post-marketing surveillance after drug is approved:
-long term and real world efficacy and safety is assessed
After phase 3 of clinical trials is complete, what needs to be done before phase 4?
A new drug application (NDA) with the FDA
What is a supplemental new drug application (sNDA)
when a manufacturer makes any change in an approved drug or in its production (eg new indication or dose)
T/F: It's optional for researchers in drug trials to disclose any conflicts of interest such as financial incentives
F
It's required
What is sampling bias
A bias that occurs when the sample is not representative of the whole population.
What is selection bias
refers to bias in how people are chosen to participate; due to lack of randomization or strict study exclusion criteria
What is performance bias
When study groups are not treated equally, such as if the study is not blinded then the tx group may receive a diff lvl of care and attention
What is detection bias?
Biased assessment of outcomes, can be avoided by blinding the researchers
What is attrition bias?
when participants with specific characteristics, such as less severe disease, have a higher drop out rate, skewing results
What is reporting bias?
selective reporting of data
What is publication bias?
Inclination for journals to publish positive outcomes more frequently than negative outcomes
What does continuous data mean
Data in a logical order with values that continuously increase or decrease by the same amt
Name two types of continuous data and describe them
1) Interval data:
has NO meaningful zero
eg) 0 degrees in temperature does not mean "none" degrees
2) Ratio data:
has meaningful zero
eg) A heart rate of zero means no heart is beating
What does discrete/categorical data mean
Data that fits into a limited number of categories
Name two types of discrete/categorical data and describe them
1) Nominal data:
categories are in an arbitrary order
eg) gender, marital status, ethnicity
2) Ordinal data:
categories are ranked in logical order
eg) NYHA class I-IV
Mean, median and mode are all categorized as ...
Measures of central tendency
What is mean
arithmetic average
What is mode
most frequently occurring score
What is median
Middle number when placed in order of lowest to highest
What is range
Difference between highest and lowest values.
What is standard deviation?
Indicates how spread out the data is away from the mean
Data that is highly dispersed has a higher SD = wider histogram value
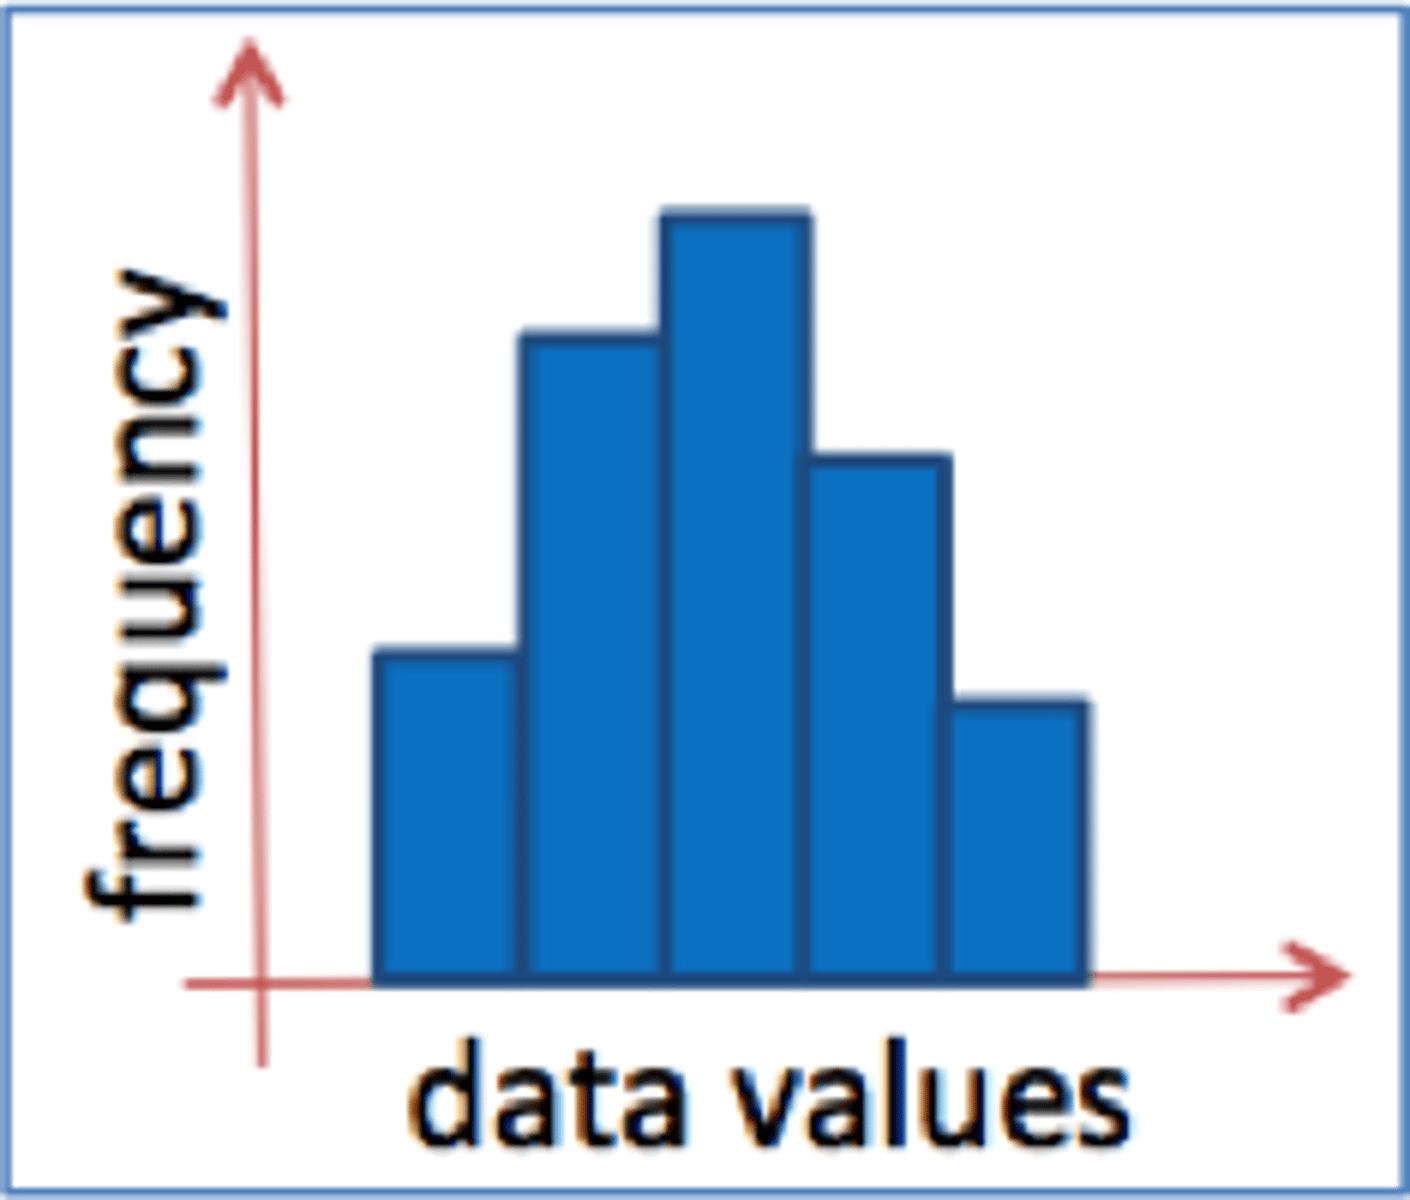
Large sample sets of continuous data tend to form a bell-curve aka ___ or ___
Gaussian; "normal"
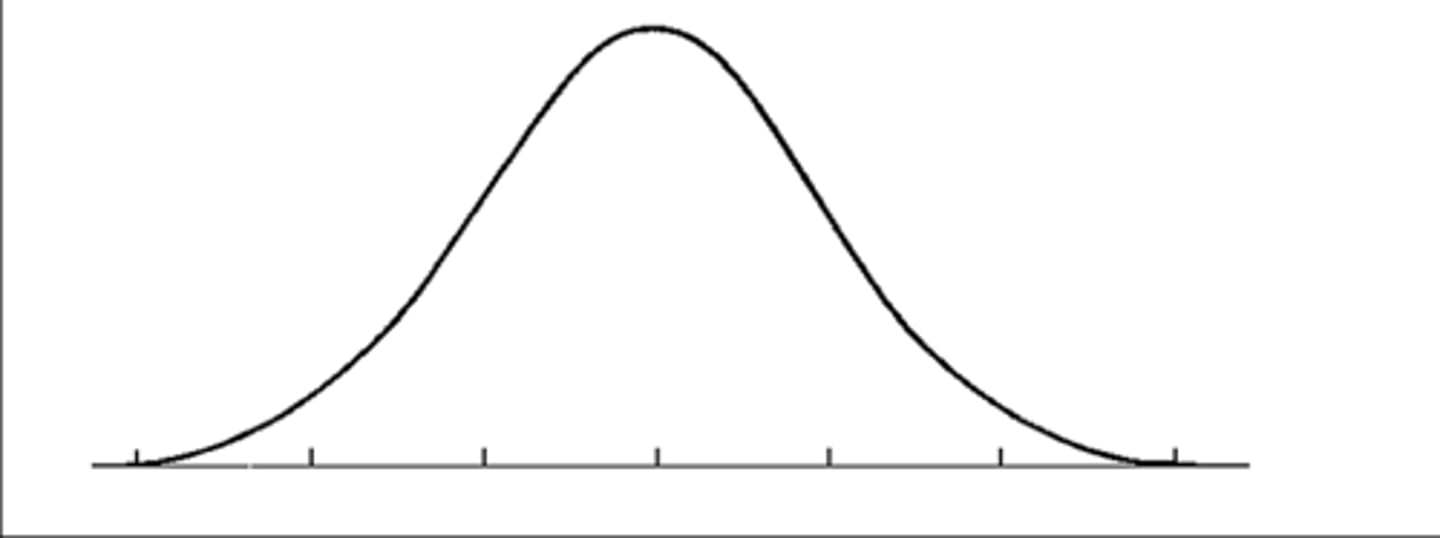
In a Gaussian (normal) distribution, what are the mean, median and mode values?
They are all the same values, at the center point of the curve
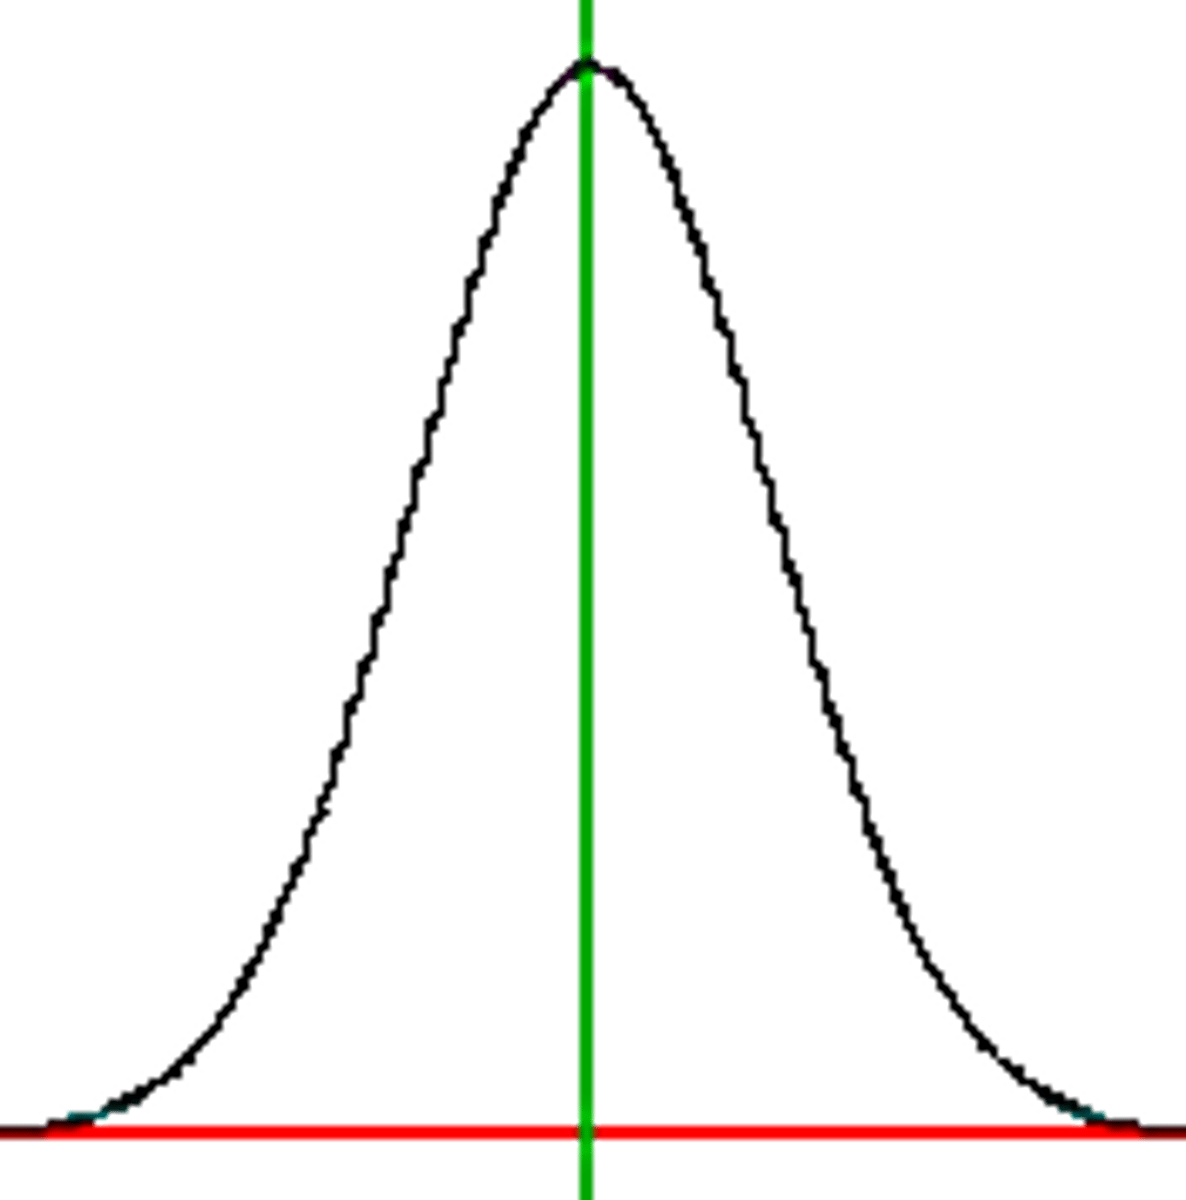
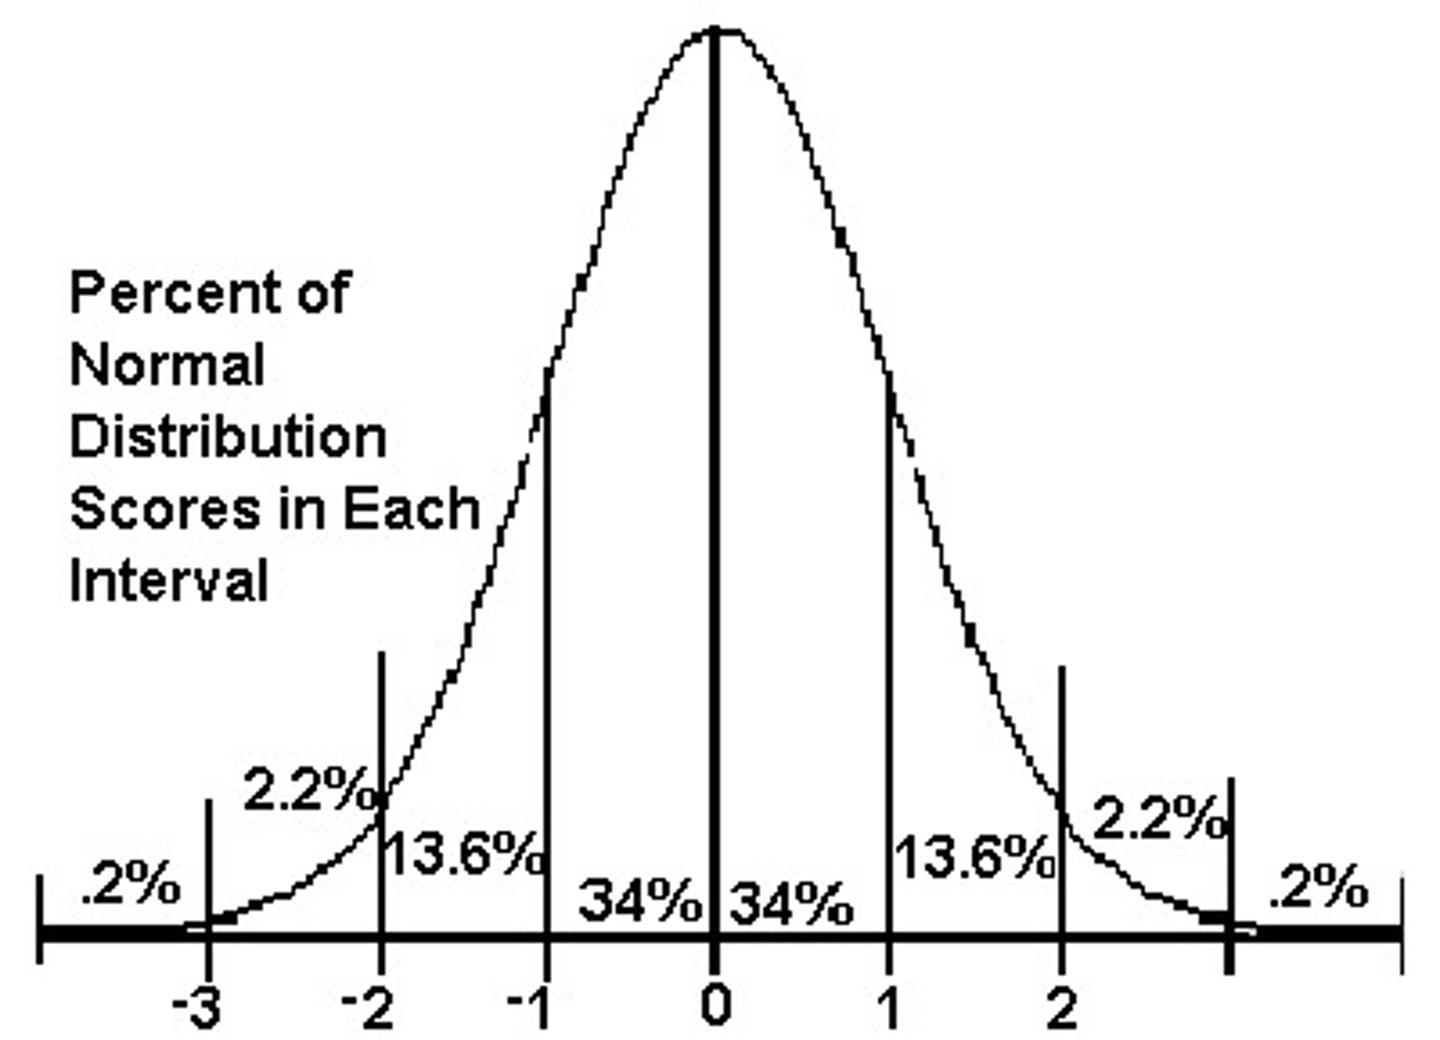
In a Gaussian (normal) distribution, __% of values fall within 1 standard deviation, and __% of values fall within 2 standard deviations
In a Gaussian (normal) distribution,
68% of values fall within 1 standard deviation
95% of values fall within 2 standard deviations
What are two reasons that cause a bell-curve to have skewed distributions?
1) Small sample size/small # of values
2) Outliers in data
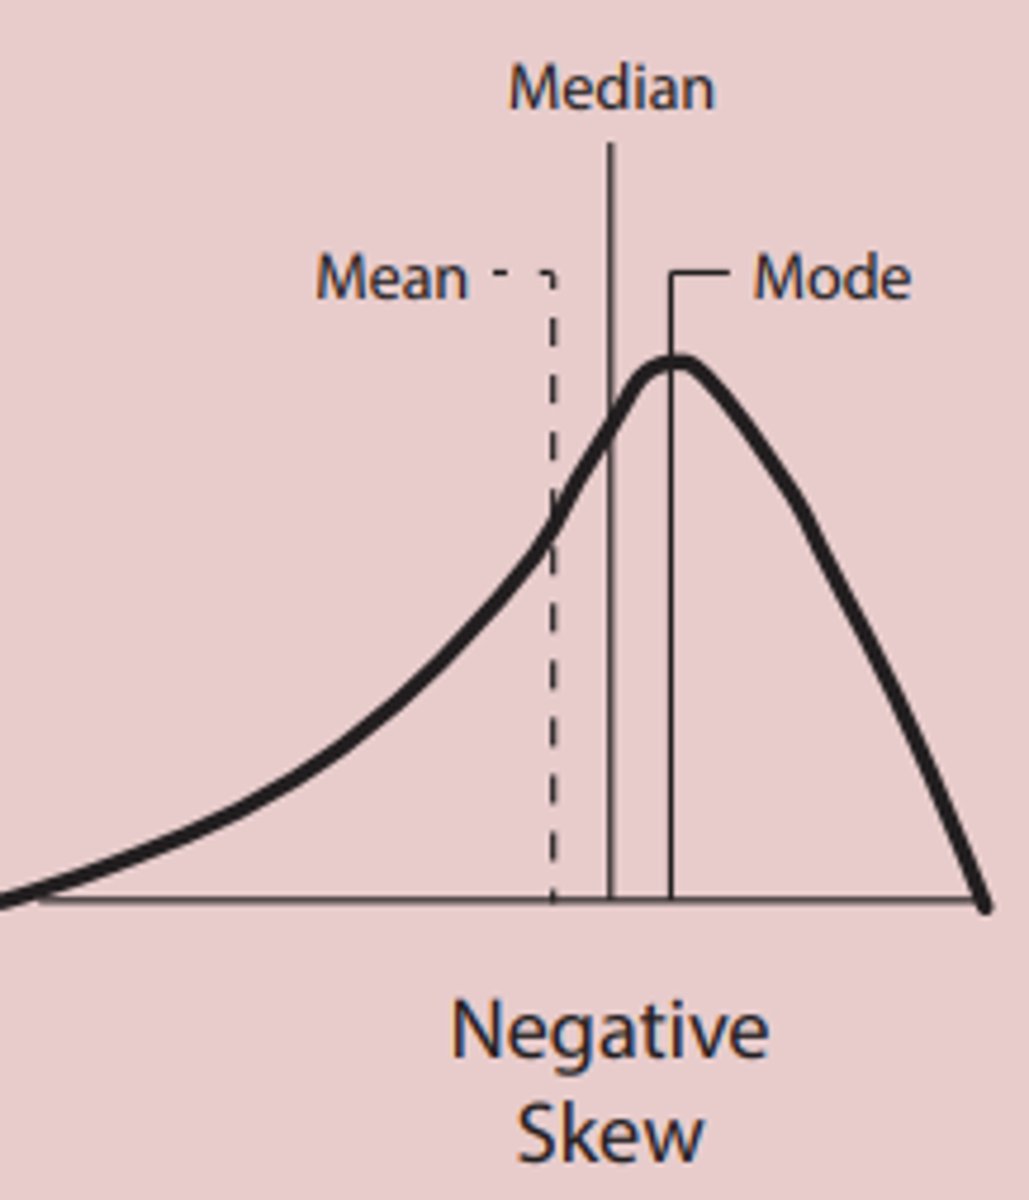
Draw a negative skew
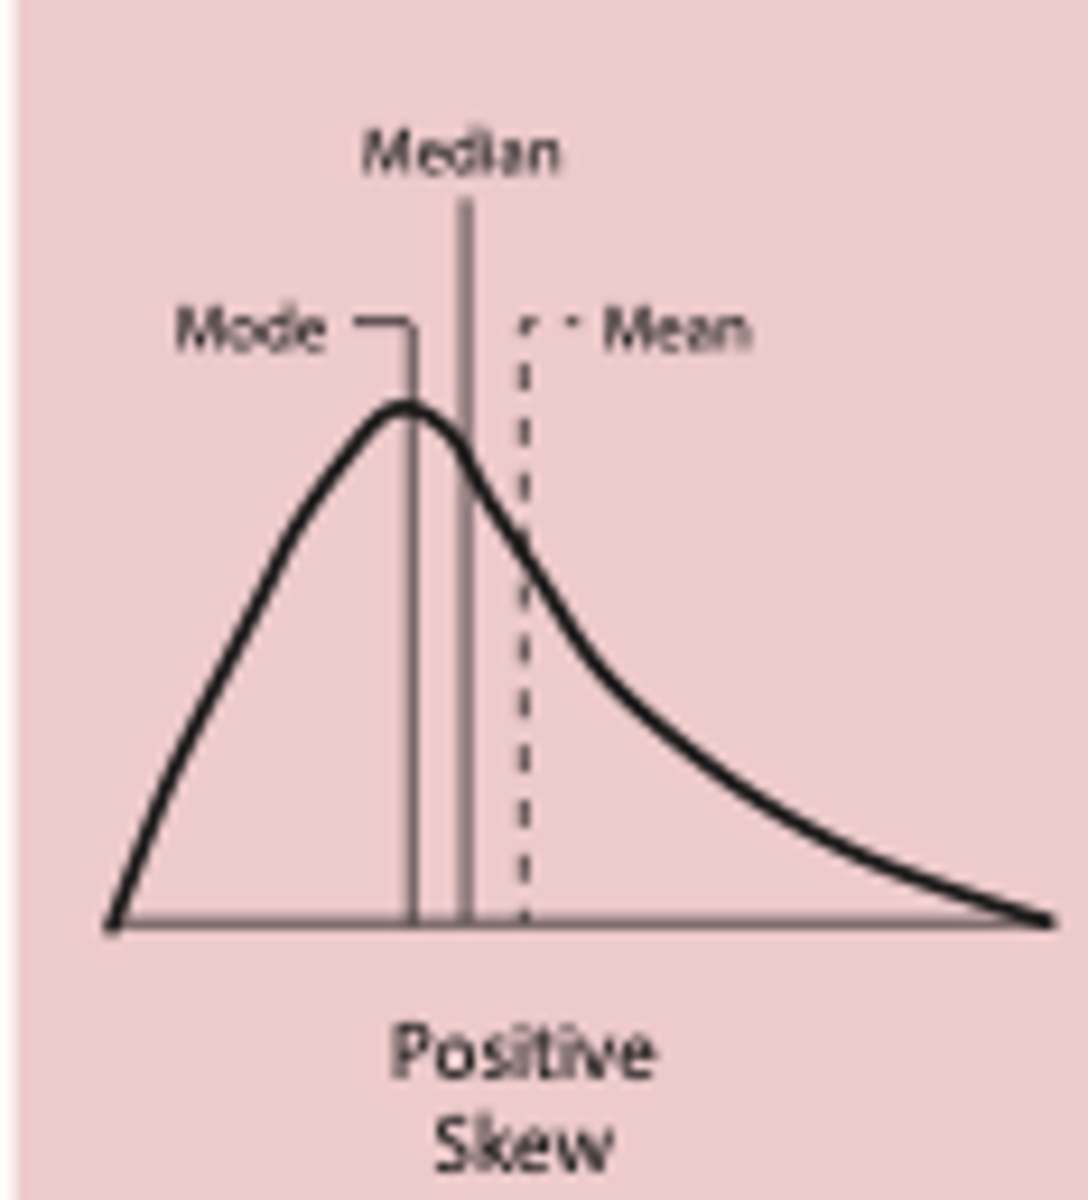
Draw a positive skew
What is a null hypothesis
null means zero
aka no statistically significant difference between two groups.
Researchers want to prove the null hypothesis is not true, reject it.
What is an alternative hypothesis
the alternative to the null hypothesis
Researches want to prove that the alternative hypothesis is true, that there is a statistically significant difference between groups, to accept it.
What is the maximum permissible error margin in a study aka
What is the common % and (decimal) number
alpha (α)
Set at 5% or (0.05); It determines the risk of Type I errors
What is a p-value?
probability that the null hypothesis is true
It's compared with the alpha value.
If alpha is set at 0.05, and the p-value is less than that, then it rejects the null hypothesis, meaning the results are statistically significant
If a p-value is greater than alpha, what does that tell you about the results?
Not statistically significant, fails to reject the null hypothesis
What is a confidence interval?
Another way of expressing statistical significance (p-value)
If alpha is 0.05 then the CI is 95%
If alpha is 0.01 then the CI is 99%
When is a confidence interval statistically significant?
For difference data (means):
Data points should not include 0
For ratio data (relative risk, odds ratio, hazard ratio):
Data points should not include 1
---
way to remember:
1-1 = 0
1/1 = 1
If a p-value is less than alpha, what does that tell you about the results?
Statistically significant, it rejects the null hypothesis
Independent and dependent variables
IV- whats being changed
DV- effect of whats being changed
What is a type-I error
False positive; rejecting the null hypothesis when it is true
How can a type-I error be avoided?
1) Increasing the study power
What is a type-II error
What is another name for type-II error?
False negative; accepting the null hypothesis when it should have been rejected
aka Beta
How can a type-II error be avoided?
1) Large sample size
2) Using a composite endpoint
What is study power?
probability that a test will reject the null hypothesis. Used to avoid type 2 error.
The higher the study power, the smaller the likelihood of error (aka Beta)
Study power = 1 - beta
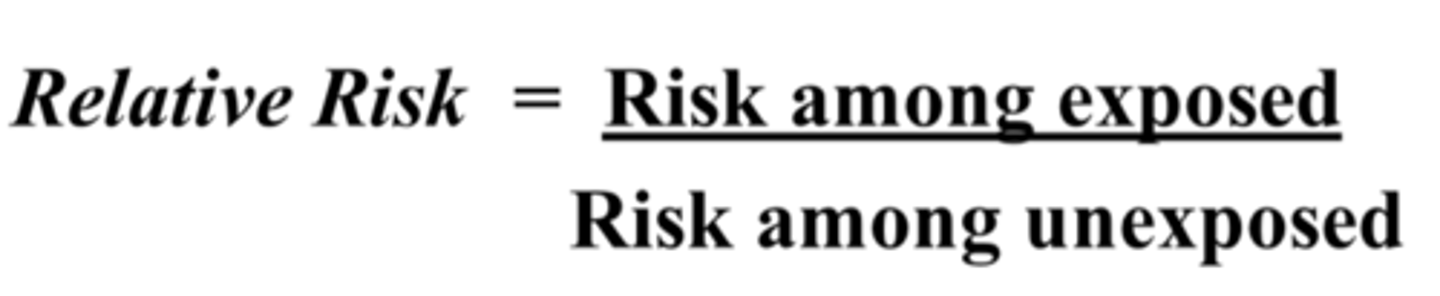
What is relative risk (RR)
ratio of risk in the exposed (tx group) divided by risk in control group
A RR = 1 means ...
A OR or HR = 1 means...
No difference between groups
1/1 = 1
A RR > 1 means ...
---
A OR or HR > 1 means ...
Greater risk of the outcome in the treatment group
---
Higher event rate in the treatment group
A RR < 1 means ...
---
A OR or HR < 1 means ...
Lower risk of the outcome in the treatment group
---
Lower event rate in the treatment group
What is relative risk reduction (RRR)
How much the risk is reduced in the treatment group compared to the control
RRR = 1 - RR*
*must use decimal form of RR
What is absolute risk reduction (ARR)
Reduction in risk and the incidence rate of the outcome
ARR = (% risk in control grp) - (% risk in tx grp)
Answers questions like "How many fewer patients out of 100 treated with abatacept instead of placebo will experience
worsening of disease?"
What is number needed to treat (NNT)
The # of pts who need to be treated for a certain period of time in order for 1 pt to benefit
1/ARR*
*expressed as decimals
NNT answers will always be rounded UP
eg) 8.3 => 9
What is number needed to harm (NNH)
The # of pts who need to be treated for a certain period of time in order for 1 pt to experience harm.
1/ARR*
*expressed as decimals
NNH answers will always be rounded DOWN
eg) 8.3 => 8
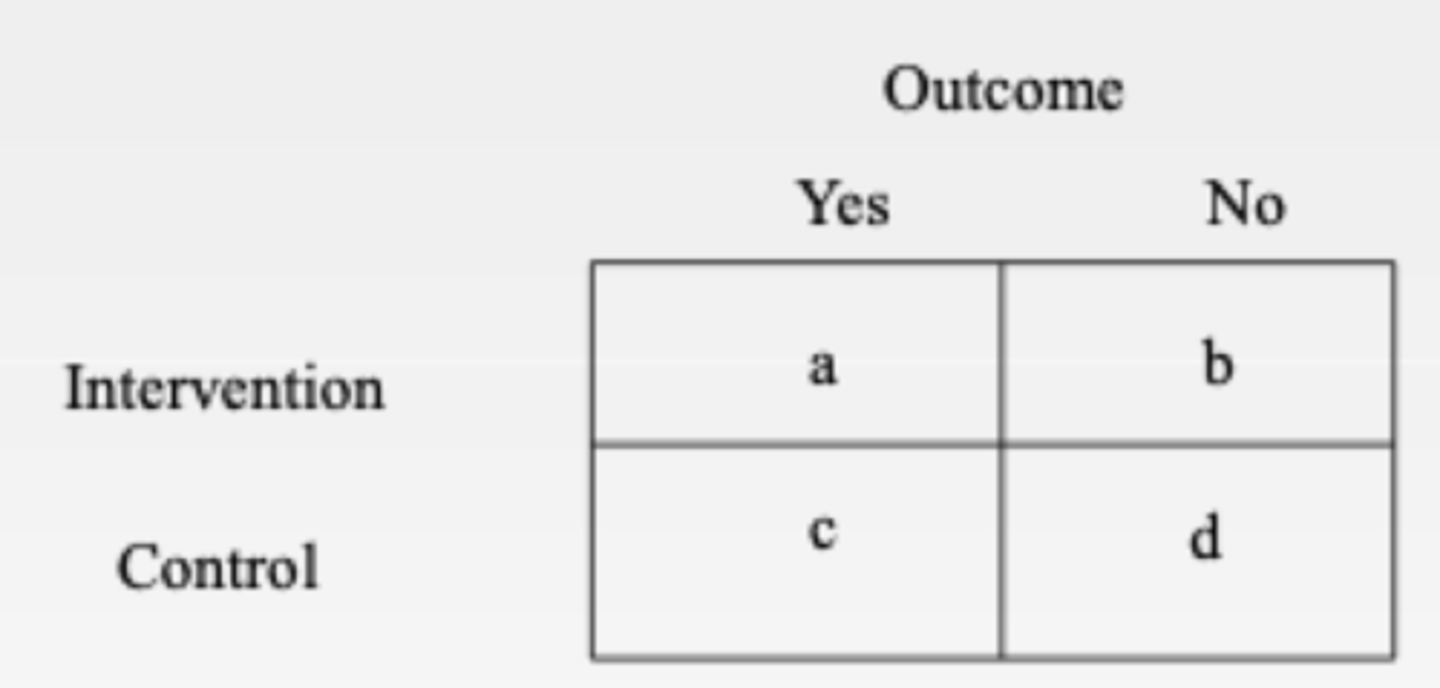
What is odds-ratio (OR)
Used in case-control studies to estimate the risk of unfavorable events
(A) (D) / (B) (C)
For example: There is an OR of 12 for pts that will get pulmonary fibrosis when taking amiodarone compared to placebo. What does this mean?
=> It means pts exposed to amiodarone are 12 times more likely to develop pulmonary fibrosis than
those not exposed.
What are case-control studies
Retrospective look on subjects that have the outcome of interest. Compares pts with and without disease
Use the odds-ratio to compare data
What is hazard-ratio (HR)
In a survival analysis (analysis of death or disease progression), instead of using "risk", a HR is used
It's the rate of an unfavorable event occurring within a short period of time
Rate in tx group/ rate in control group
Similar to relative risk

What is a t-test
A statistical measure used when an endpoint has continuous data and the data is normally distributed
What is a one-sample t-test
When data from a single sample group is compared with known data from the general population
What is a paired t-test
Before and after comparison from a single sample group
What is a student t-test
Used when a study has two independent samples: the treatment and the control groups
What is ANOVA
Analysis of variance
Used for continuous data with 3 or more samples to test for statistical significance
What is chi-square test
Used for nominal or ordinal data to determine statistical significance
Can be done for one sample group or for 2 (treatment and control)
What is Fisher's exact test
Used to determine statistical significance among treatment and control group using nominal or ordinal data
T/F: Correlation of variables equals causation
F
What is regression analysis?
Regression analysis is a widely used procedure in biostatistics to relate an outcome, or dependent, variable (denoted Y) to multiple independent variables (denoted X1, X2, etc), or need to control for many confounding factors
There are three types
1) Linear
2) logistic
3) Cox regression
What is sensitivity
Probability that a patient WITH a disease will have a POSITIVE result.
If a test has 100% sensitivity, it will have a positive result in all patients with the condition
"True-positive"
-----
SeNsitivity Negative→ rules OUT (SNOUT)→ If a highly sensitive test is Negative, you can rule OUT disease
What is specificity
Probability that a patient WITHOUT disease will have a NEGATIVE result
If a test has 100% specificity, it will have a negative result in all patients with the condition
"True-negative"
----
Specificity Positive→ rules IN (SPIN)→ If a highly specific test is Positive, you can rule IN disease
What is intention-to-treat analysis
Analysis of a study including all patients in each treatment group, even if they did not complete the trail according to the study protocol
What is per protocol analysis
Analyzing outcomes only for those who received the full treatment as assigned.
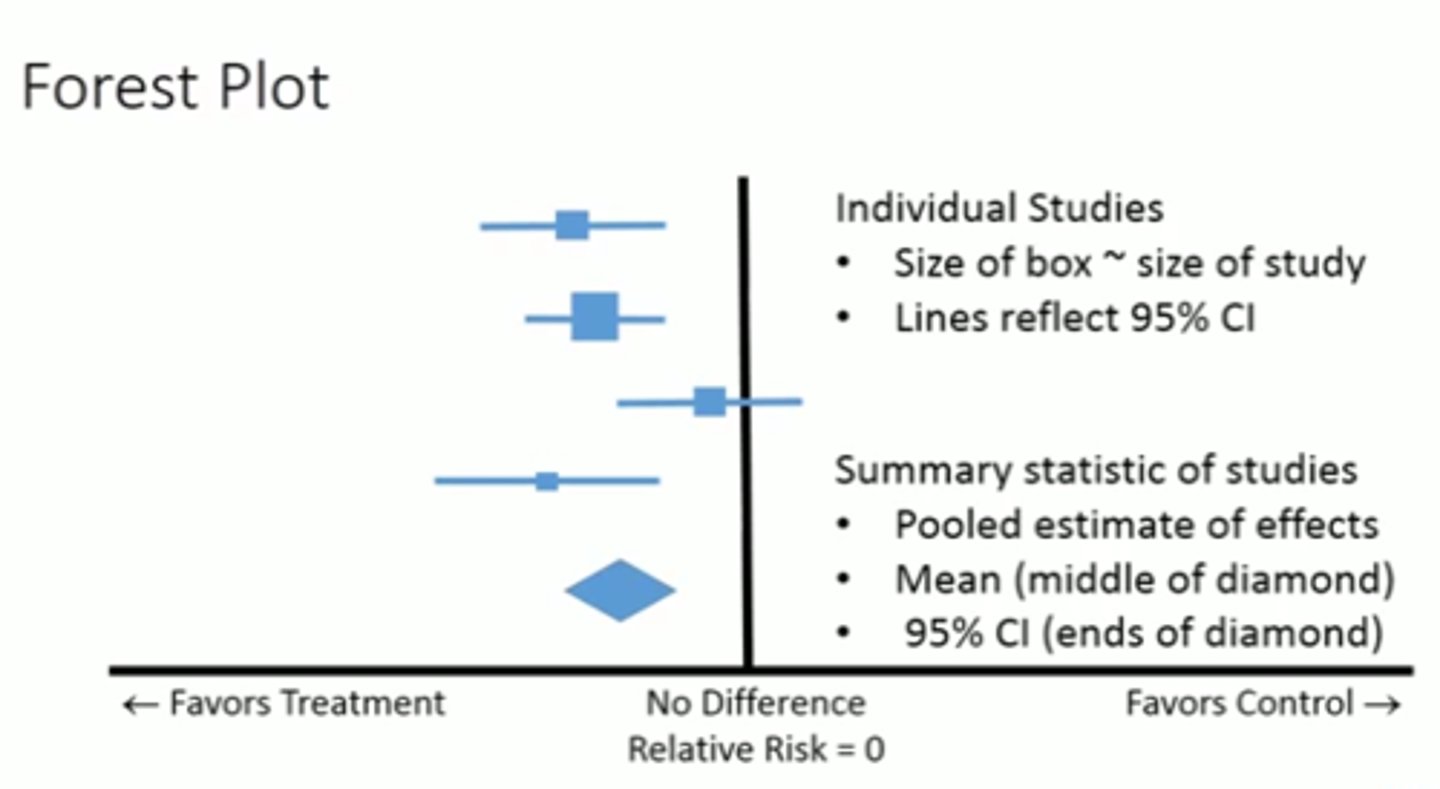
Label the parts of a forest plot:
Boxes
Diamonds
Horizontal lines
Vertical solid lines
Boxes = effect estimate
Diamonds = pooled results from multiple studies
Horizontal lines = length of the confidence interval for that endpoint or study. If it crosses the vertical solid line, the data is NOT statistically significant
Vertical solid lines = no effect. Line is set at 0 for difference data and 1 for ratio data
What is a cohort study
Comparisons of pts with an exposure to those without an exposure, usually prospectively.
Can be influenced by confounders (eg smoking, lipid lvls)
eg) The British Doctors Study: Initiated in 1951, this study followed over 40,000 male doctors and tracked their smoking habits. It was instrumental in establishing the causal link between smoking and lung cancer.
What is single vs double-blinded RCT
What is open label
Single blind: patient is unaware
Double blind: pt and investigator unaware
Open label: all parties know which tx is being given to the pt
What is a parallel RCT
Subjects are randomized to the treatment or control arm for the entire study
What is a crossover RCT
Group 1 gets treatment A first, then treatment B
Group 2 gets treatment B first, then treatment A
What is a factorial RCT
randomized to more than 2 groups to test multiple experimental conditions
What is the ECHO model of pharmacoeconomics?
A theoretical framework used in pharmacoeconomics to comprehensively evaluate the value of pharmaceutical treatments and healthcare services
E: Economic outcomes - direct, indirect and intangible costs of the drug compared to a medical intervention
C: Clinical outcomes - medical events that occur as a result of the tx or intervention
HO: Humanistic Outcomes: consequences of the disease/tx as reported by the pt or caregiver (eq QoL)
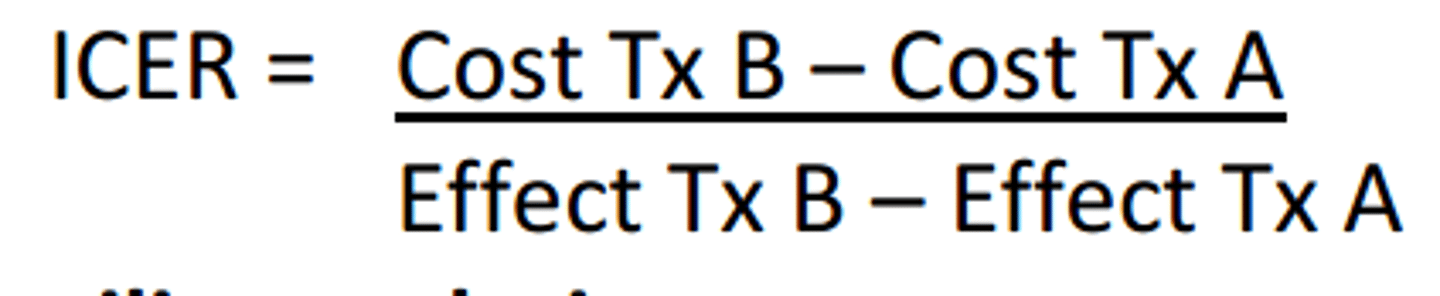
Incremental Cost Effectiveness Ratio (ICER)
Cost-minimization analysis (CMA)
Compares costs of interventions with equivalent outcomes
Cost Measurement Unit = $
Outcome Unit = Equivalent
eg) two drugs have equal efficacy, but one costs more than the other
Cost-benefit analysis (CBA)
Compares benefit and costs of an intervention in terms of monetary units $
Cost-effectiveness analysis (CEA)
Compares the clinical effects of two or more interventions to the respective costs
Units: natural units such mmHg blood pressure, % at tx goal
Pros:
Outcomes are easy to quantify
Cons:
Inability to compare different types of outcomes
Cost-unit analysis (CUA)
A type of cost-effectiveness analysis (CEA) that uses variables such as quality-adjusted life years (QALYs) and disability-adjusted life years (DALYs).
What does it mean if a drug is noninferior to another drug?
Not quite "equal": It doesn't necessarily mean the new drug is better or even exactly as good as the old one. It just means it is NOT WORSE by more than a tiny, predefined, and clinically acceptable limit.