Lectures 11-12: CAPM and APT
1/46
Earn XP
Description and Tags
Name | Mastery | Learn | Test | Matching | Spaced | Call with Kai |
|---|
No analytics yet
Send a link to your students to track their progress
47 Terms
Key questions of Asset Pricing
What is the equilibrium required return, E[R], of a stock?
What is the equilibrium price of a stock?
Which portfolios should investors hold in equilibrium?
Answer: CAPM
Alternatives/Extensions to CAPM
Multifactor pricing models
Arbitrage Pricing Theory
Capital Asset Pricing Model (CAPM)
A model that relates the required rate of return for a security to its risk as measured by beta
Describes the relationship between systematic risk and expected return
Linear relationship between the required return on investment and risk
Predicts the optimal portfolio choices
Used for pricing securities given the risk of the risky assets and the cost of capital
Market Portfolio
The portfolio for which each security is held in proportion to its market value (Market Cap)
*All investors would hold the market portfolio
Equilibrium assumptions
All investors will choose to hold the market portfolio (M), which includes all assets of the security universe.
The proportion of each stock in the portfolio equals the market value (Market Cap) of the stock divided by the total market value of all stocks
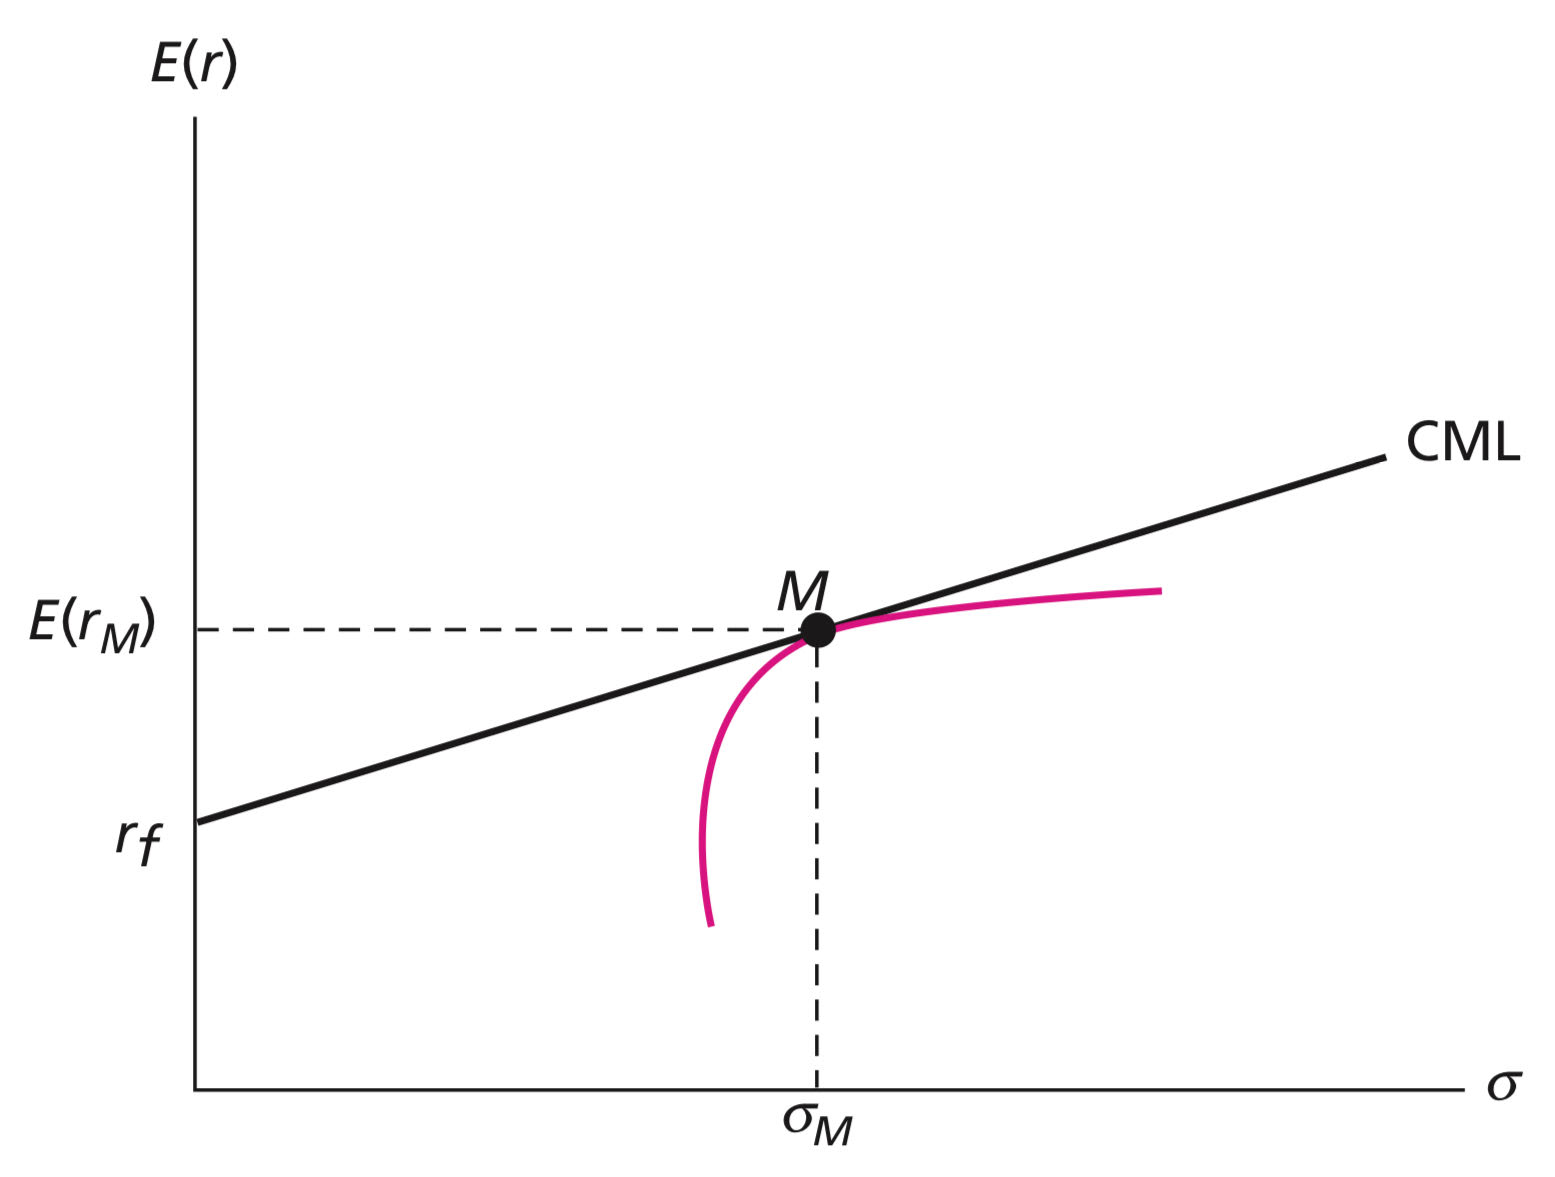
The market portfolio will be on the efficient frontier. Moreover, it will be the optimal risky portfolio, the tangency point of the capital allocation line.
The CML (line from the risk-free rate through M) is the best attainable capital allocation line
All investors hold M as their optimal risky portfolio, differing only in the amount invested in it as compared to investment in the risk-free asset
The risk premium on the market portfolio will be proportional to the variance of the market portfolio and investors’ typical degree of risk aversion:
E[rM] - rf = A*oM²
Where A* is a scale factor representing the degree of risk aversion of the average investor
The risk premium on individual assets will be proportional to the risk premium on the market portfolio (M) and to the beta coefficient of the security on M.
RM is the single factor of the security market
CAPM Assumptions
The market is in competitive equilibrium.
equilibrium is where supply = demand
supply of securities is fixed (short-run)
if demand > supply for a particular security, the excess demand will drive up price and reduce expected return
vice versa for if demand < supply
Competitive Market: investors take prices as given and no investor can manipulate the market, also no monopolist
Investors face the same investment opportunity set in the universe of all assets.
Single-period horizon: everyone buys and holds for the same period of time
All assets are tradable—financial, real estate, human capital
No friction as a result of taxes, bid-ask spread, or borrowing or short-selling constraints
Investors are rational with homogenous expectations—they pick efficient portfolios
Results of using CAPM
Identify the tangency portfolio in equilibrium → Identify investors’ portfolios
Derive equilibrium returns → Prices
In equilibrium, supply equals demand. Therefore, the tangency portfolio must be…
…the portfolio of all existing risky assets, i.e. the market portfolio
The CAL with the steepest Sharpe Ratio is the Capital Market Line
*If all investors hold an identical risky portfolio, this portfolio must be the market portfolio.
The Efficient Frontier and the Capital Market Line
Weight in the Market Portfolio Formula
pi = price of one share of risky security i
ni = number of shares outstanding for risky security i
M = Market Portfolio in which each risky security i has weight

Suppose you own a market portfolio which consists of three assets:
ni | pi | ni * pi | wi | |
|---|---|---|---|---|
A | 10,000 | 5 | 50,000 | 0.5 |
B | 5,000 | 6 | 30,000 | 0,3 |
C | 10,000 | 2 | 20,000 | 0.2 |
What is the total market capitalization?
Total Market Cap = summ[n*p]
(10,000)(5) + (5,000)(6) + (10,000)(2) = $100,000
Since beta measures how a security responds to market forces, what is the beta of the market?
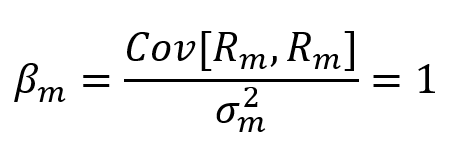

Implications of Bm = 1
The risk premium for individual securities is proportional to their beta
Diversified investors only need to be compensated to bearing non-diversifiable risk
The contribution of non-diversifiable risk of a single security to a diversified portfolio is measured its beta
Security Market Line (SML) Formula
*to find the expected return for an individual security

Use the SML formula to find the expected return of an individual security and determine the price.
Assume the risk-free rate is 3% and the market risk premium is 6%
Assume the Beta of General Motors is 1.269
What is the expected return?
E[rGM] = rf + B(E[rM] - rf)
0.03 + 1.269(0.06) = 10.614%
Use the SML formula to find the expected return of an individual security and determine the price.
Assume the risk-free rate is 3% and the market risk premium is 6%
Assume the Beta of General Motors is 1.269
If you expect GM’s share price to be $50 in one year and also expect that the company will pay a $2 dividend, what should the current fair price be (assuming CAPM holds true)?
Starting Period Value: $50
Ending Period Value: $52
E[rGM] = (End - Beg) / Beg = 10.614%
Beg = $52/1.10614 = $41.01
The stock is undervalued.
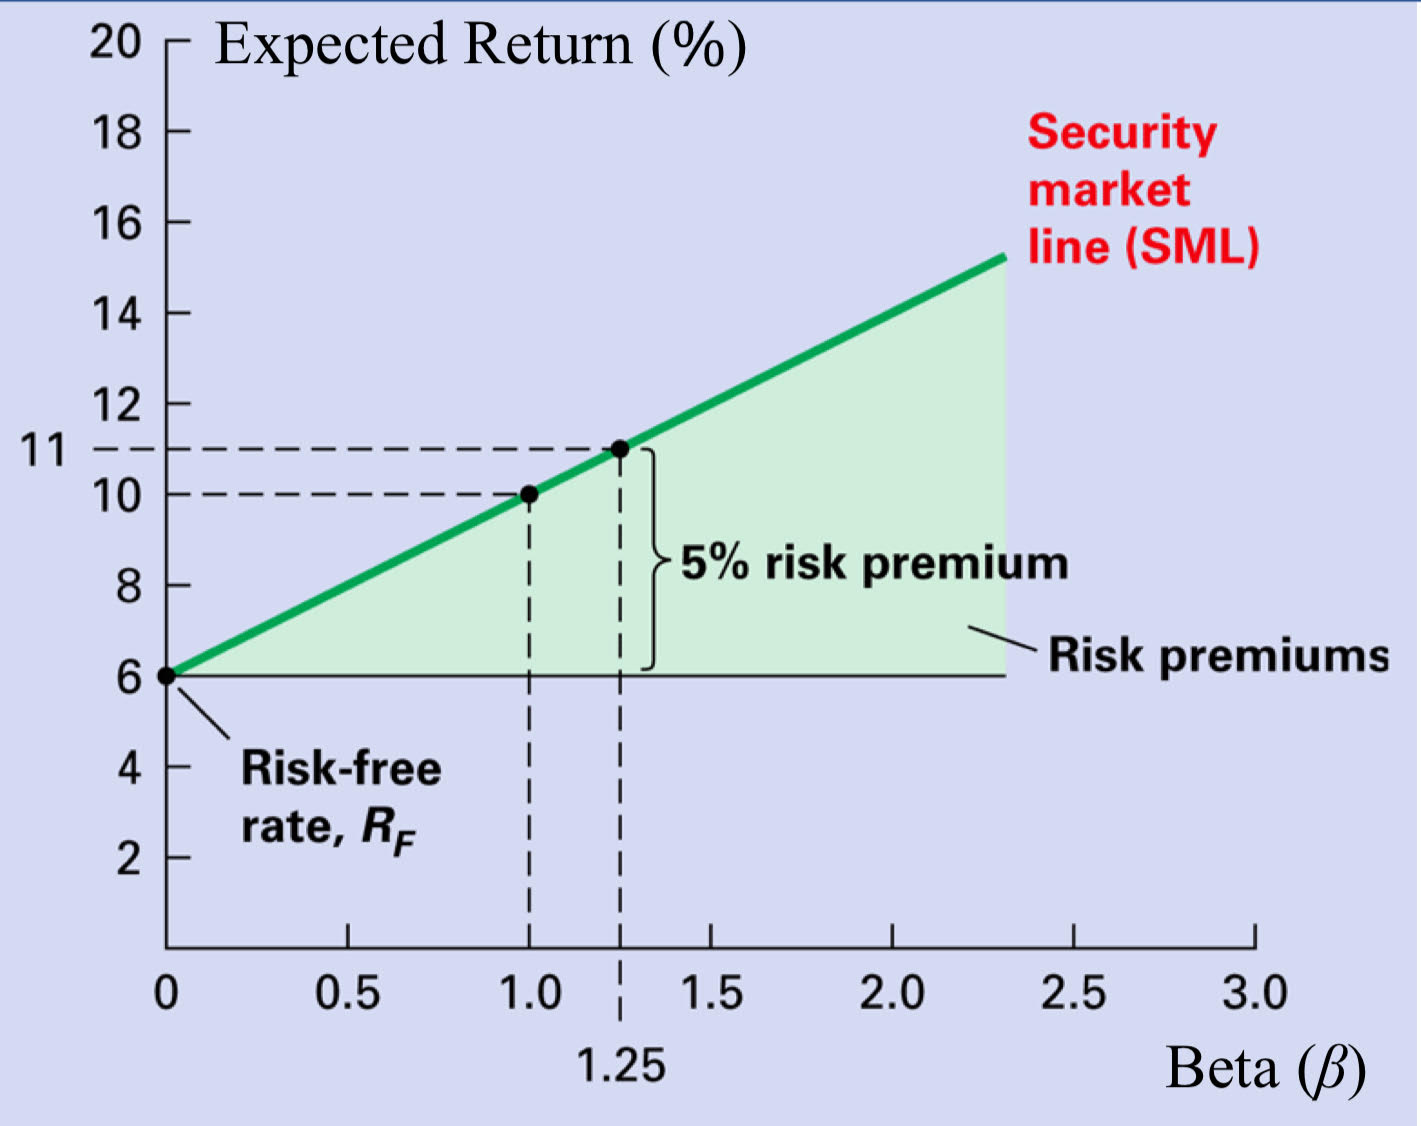
Security Market Line
graphical depiction of the CAPM where Beta measures the security’s sensitivity to market movements
Security Market Line vs. Alpha
If CAPM holds, then expected returns should lie directly on the SML
If a security has a higher expected return than predicted through its B then it is underpriced and plots above the SML (positive alpha)
If a security has a lower expected return than predicted through its B then it is overpriced and plots below the SML (negative alpha)
Some fund managers try to buy positive-alpha stocks and sell negative-alpha stocks
Beta (B)
Beta for the overall market is equal to 1
B > 0 → stock moves in the same direction as the market
B < 0 → stock moves in the opposite direction of the market
Most stocks have 0.5 < B < 1.75
Stocks with low betas are less volatile, such as Walmart
Stocks with high betas are volatile, such as tech firms
Betas are based on historical data and frequency, so different time-series data will yield different betas
Efficient Frontier and the Betas
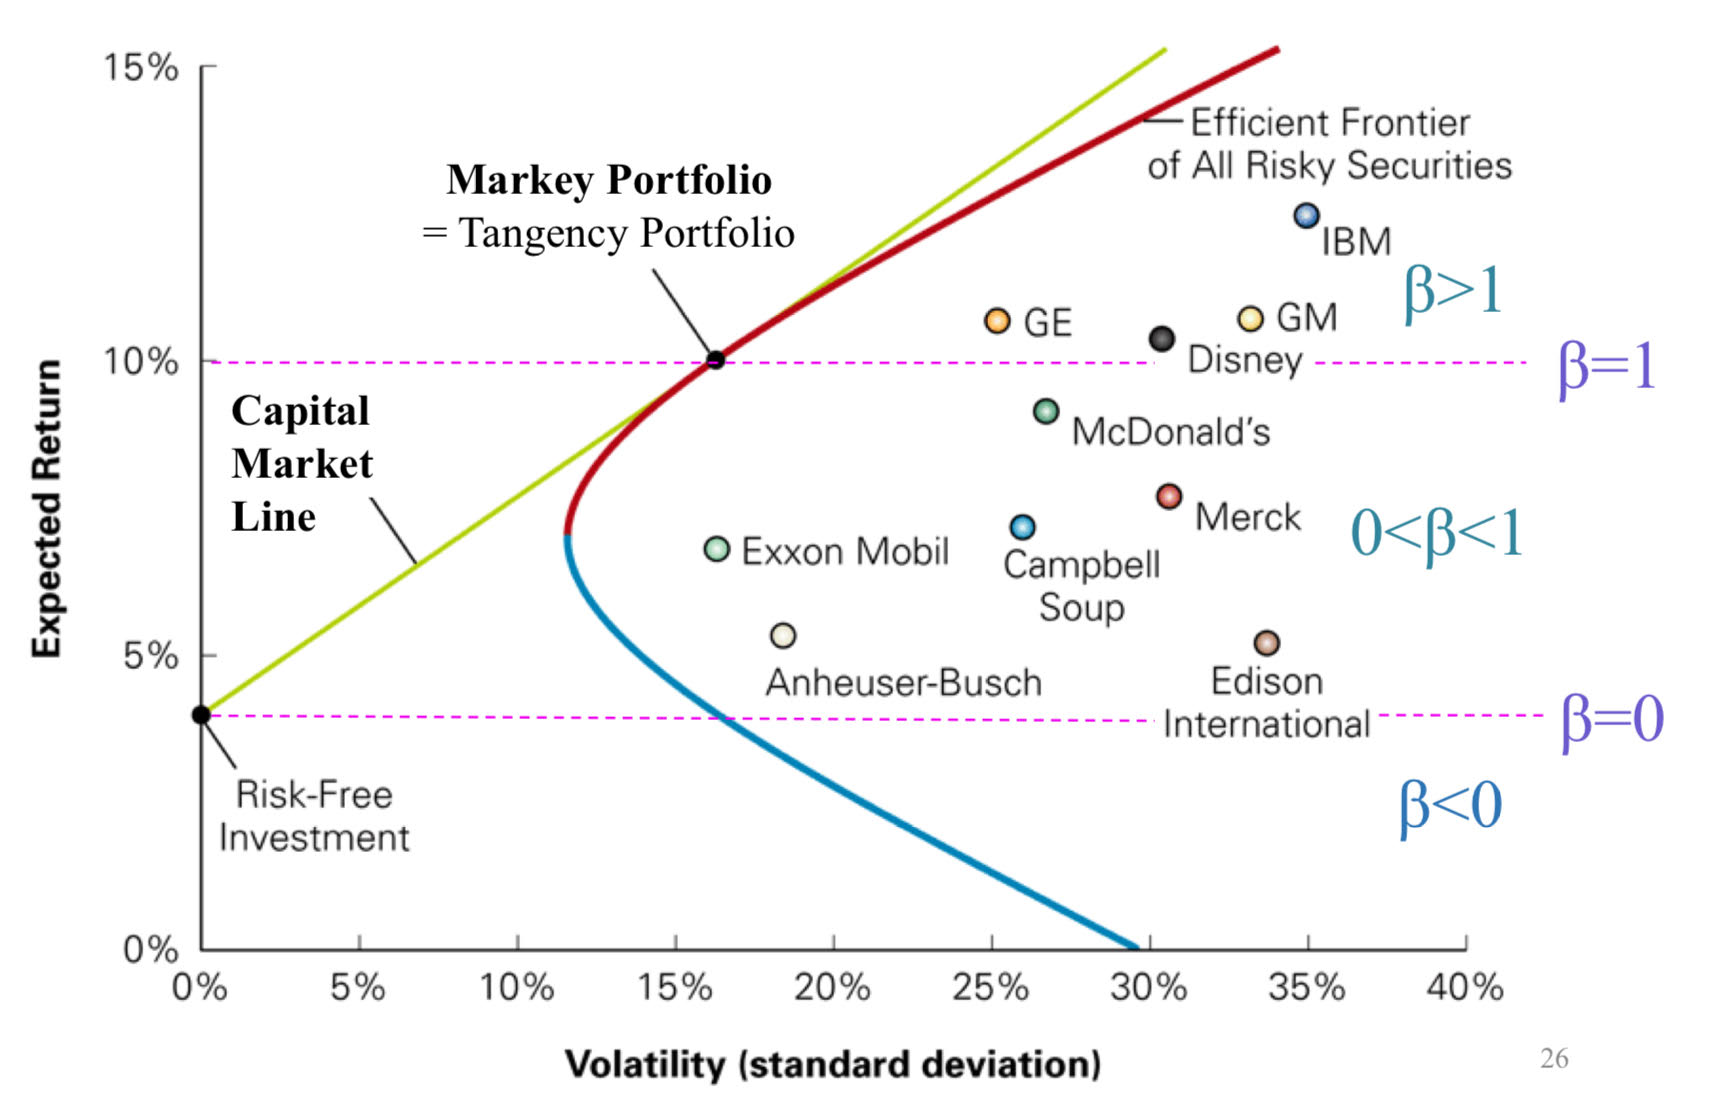
CML vs. SML
CML | SML | |
|---|---|---|
Risk measured by (y-axis) | standard deviation | beta, to find risk contribution to M |
Graphs… | efficient portfolios | efficient and inefficient portfolios |
Includes/Excludes | Eliminates diversifiable risk for portfolios | Includes all portfolios that lie on or below the CLM, their contribution to M’s risk |
Firm-Specific Risk | Irrelevant | Irrelevant |
Applications of the CAPM
Portfolio choice
Shows what a “fair” security return is
Provides a benchmark for security analysis
Required return used in capital budgeting
Calculate the expected return of the following stocks according to CAPM
rf = 1
E[rm] = 6%
Stock | Beta | CAPM E[r] | Analyst E[r] |
|---|---|---|---|
AAPL | 1.23 | 7.15% | 10.50% |
BAC | 2.31 | 12.55% | 12.55% |
XOM | 0.52 | 3.60% | 3.60% |
PFE | 0.67 | 4.35% | 2.00% |
E[rs] = rf + Bs(E[rm] - rf)
Analyst Forecast vs CAPM
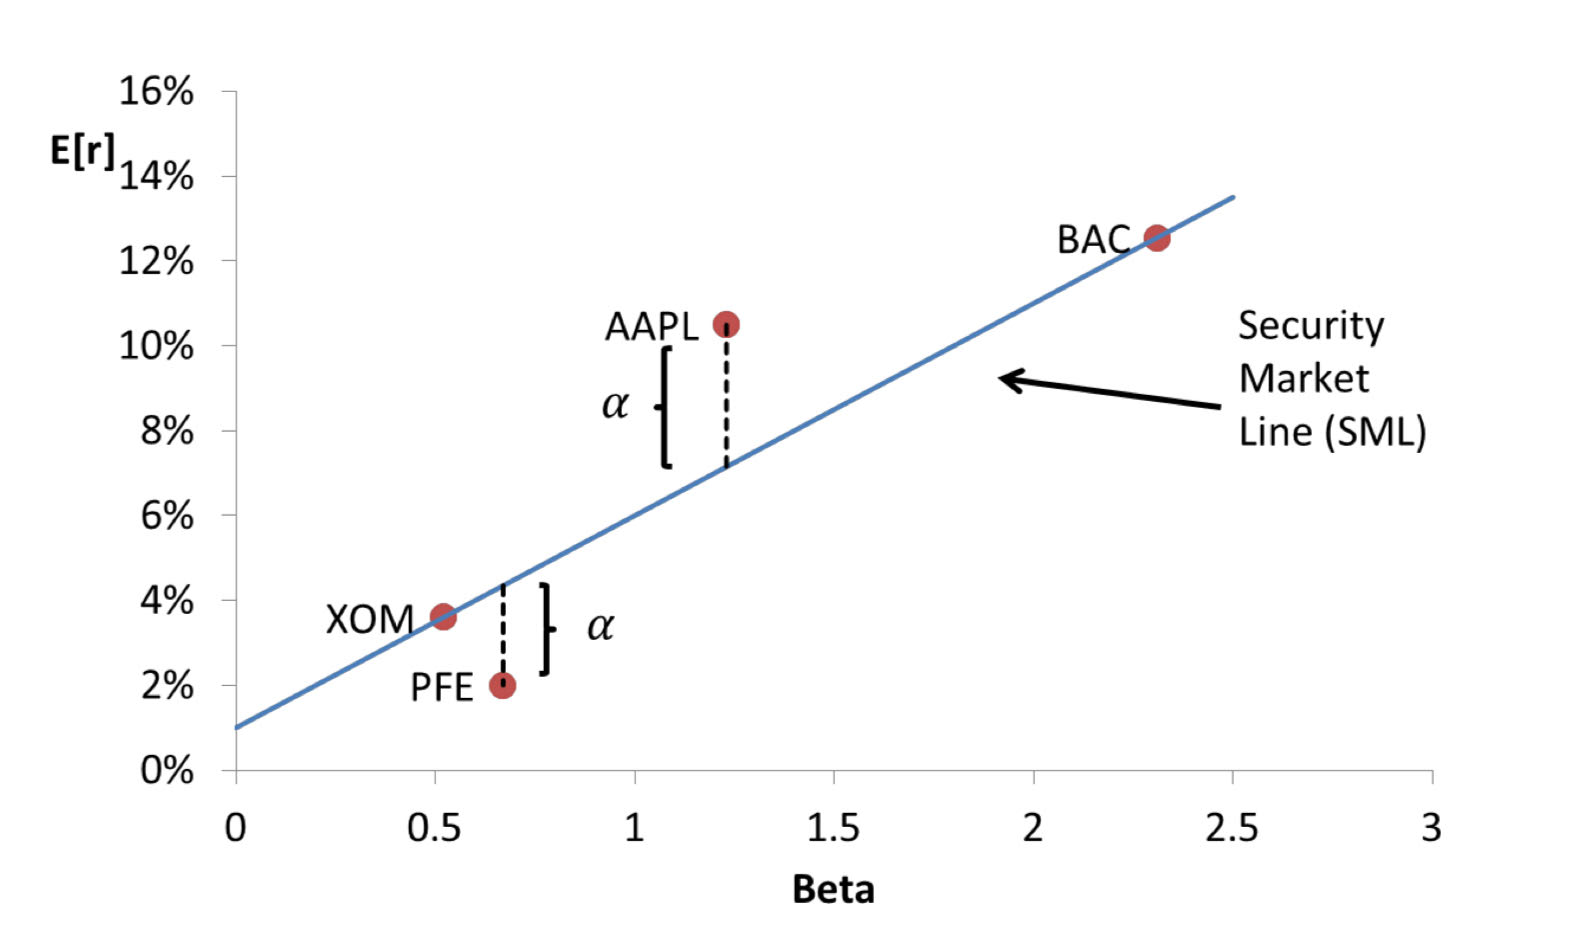
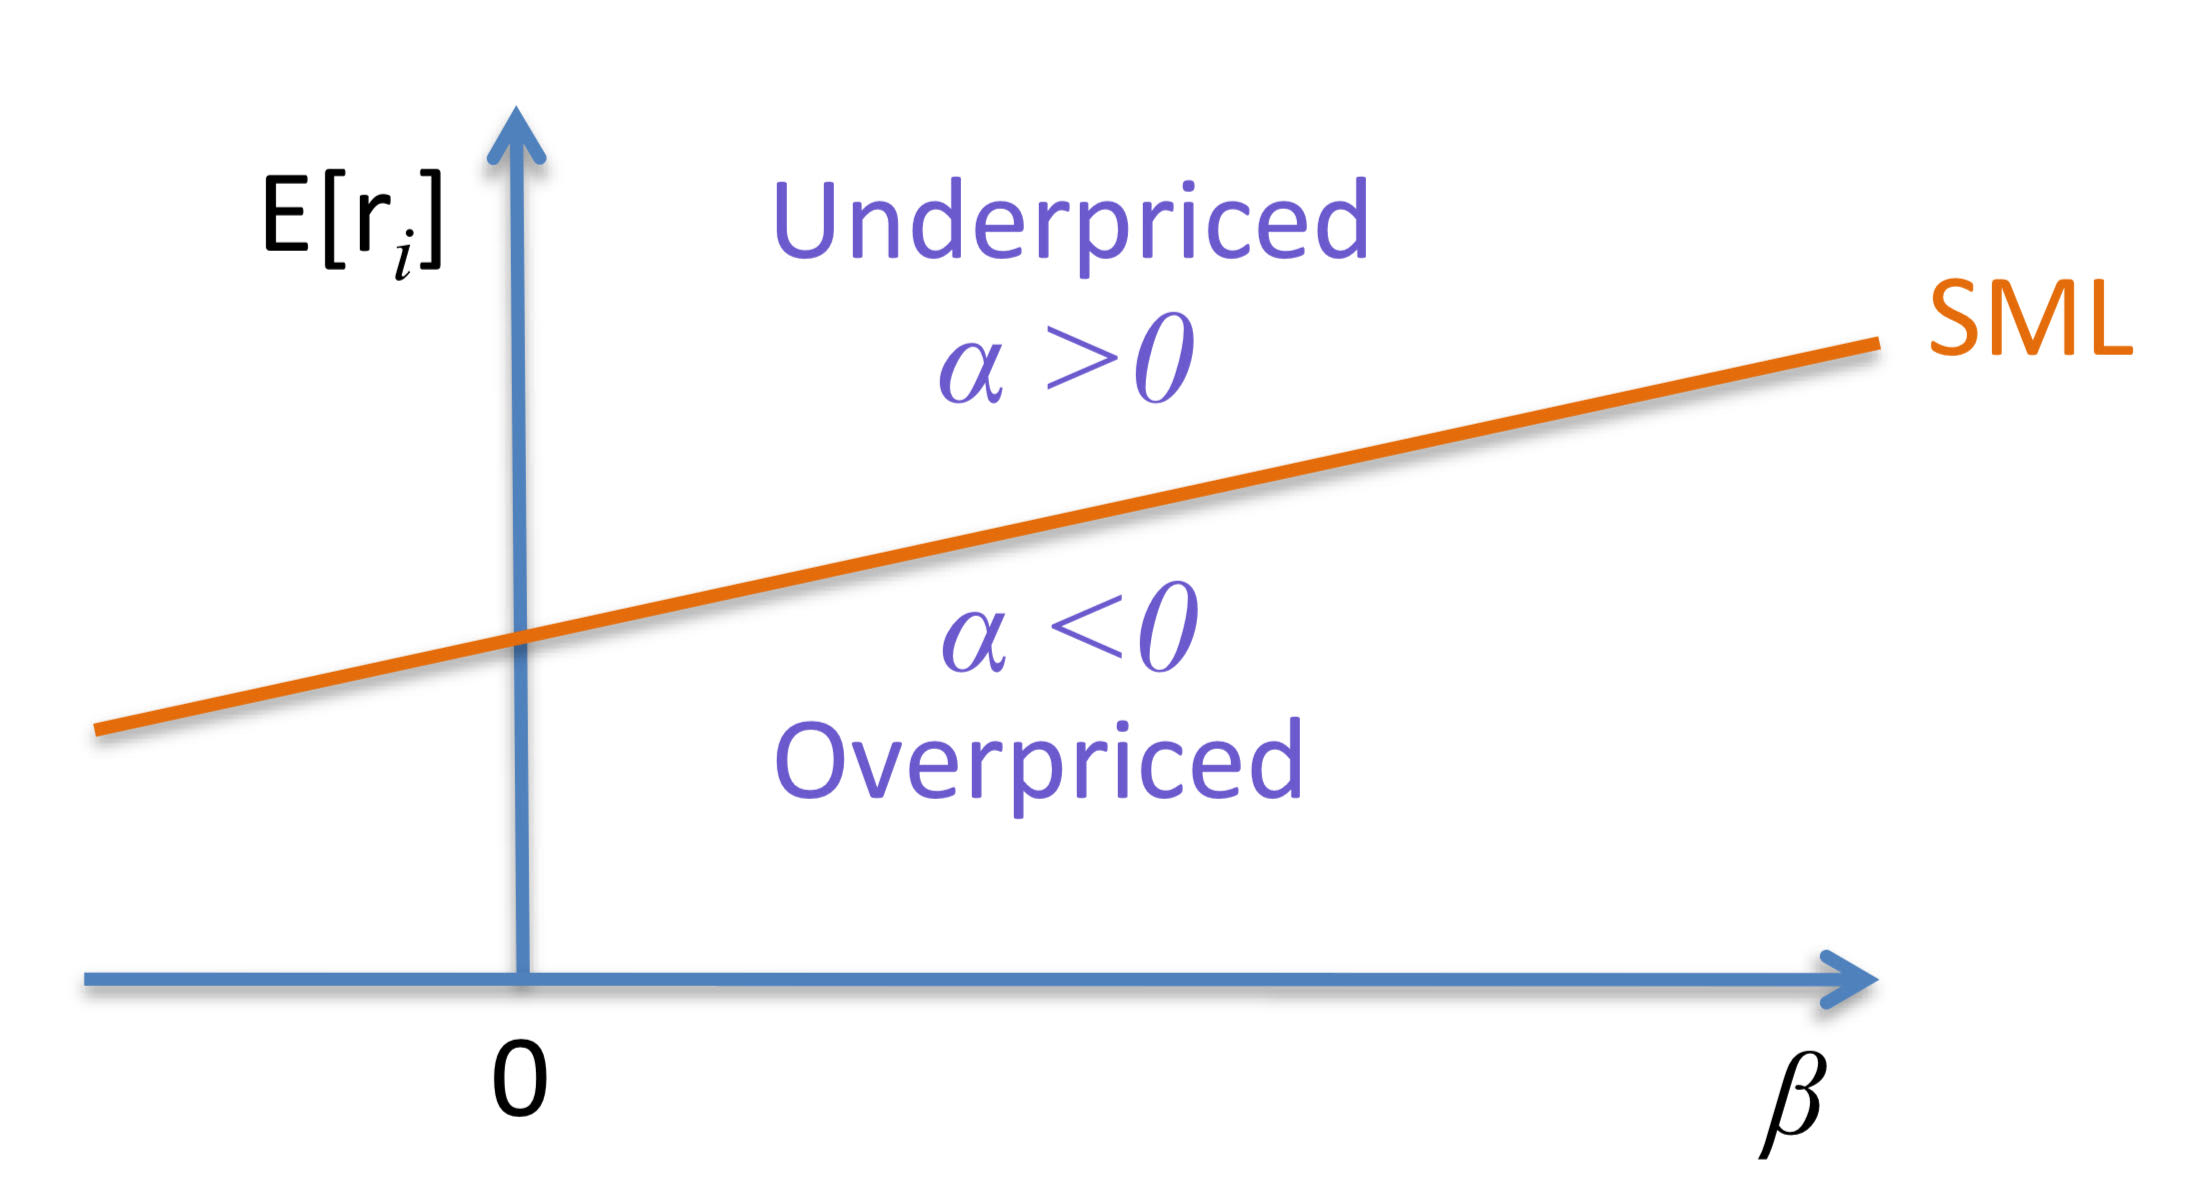
Assets (above/below) the SML are underpriced relative to the CAPM.
above
…because the assets’ too highly expected return means the price is too low compared to the fair CAPM value
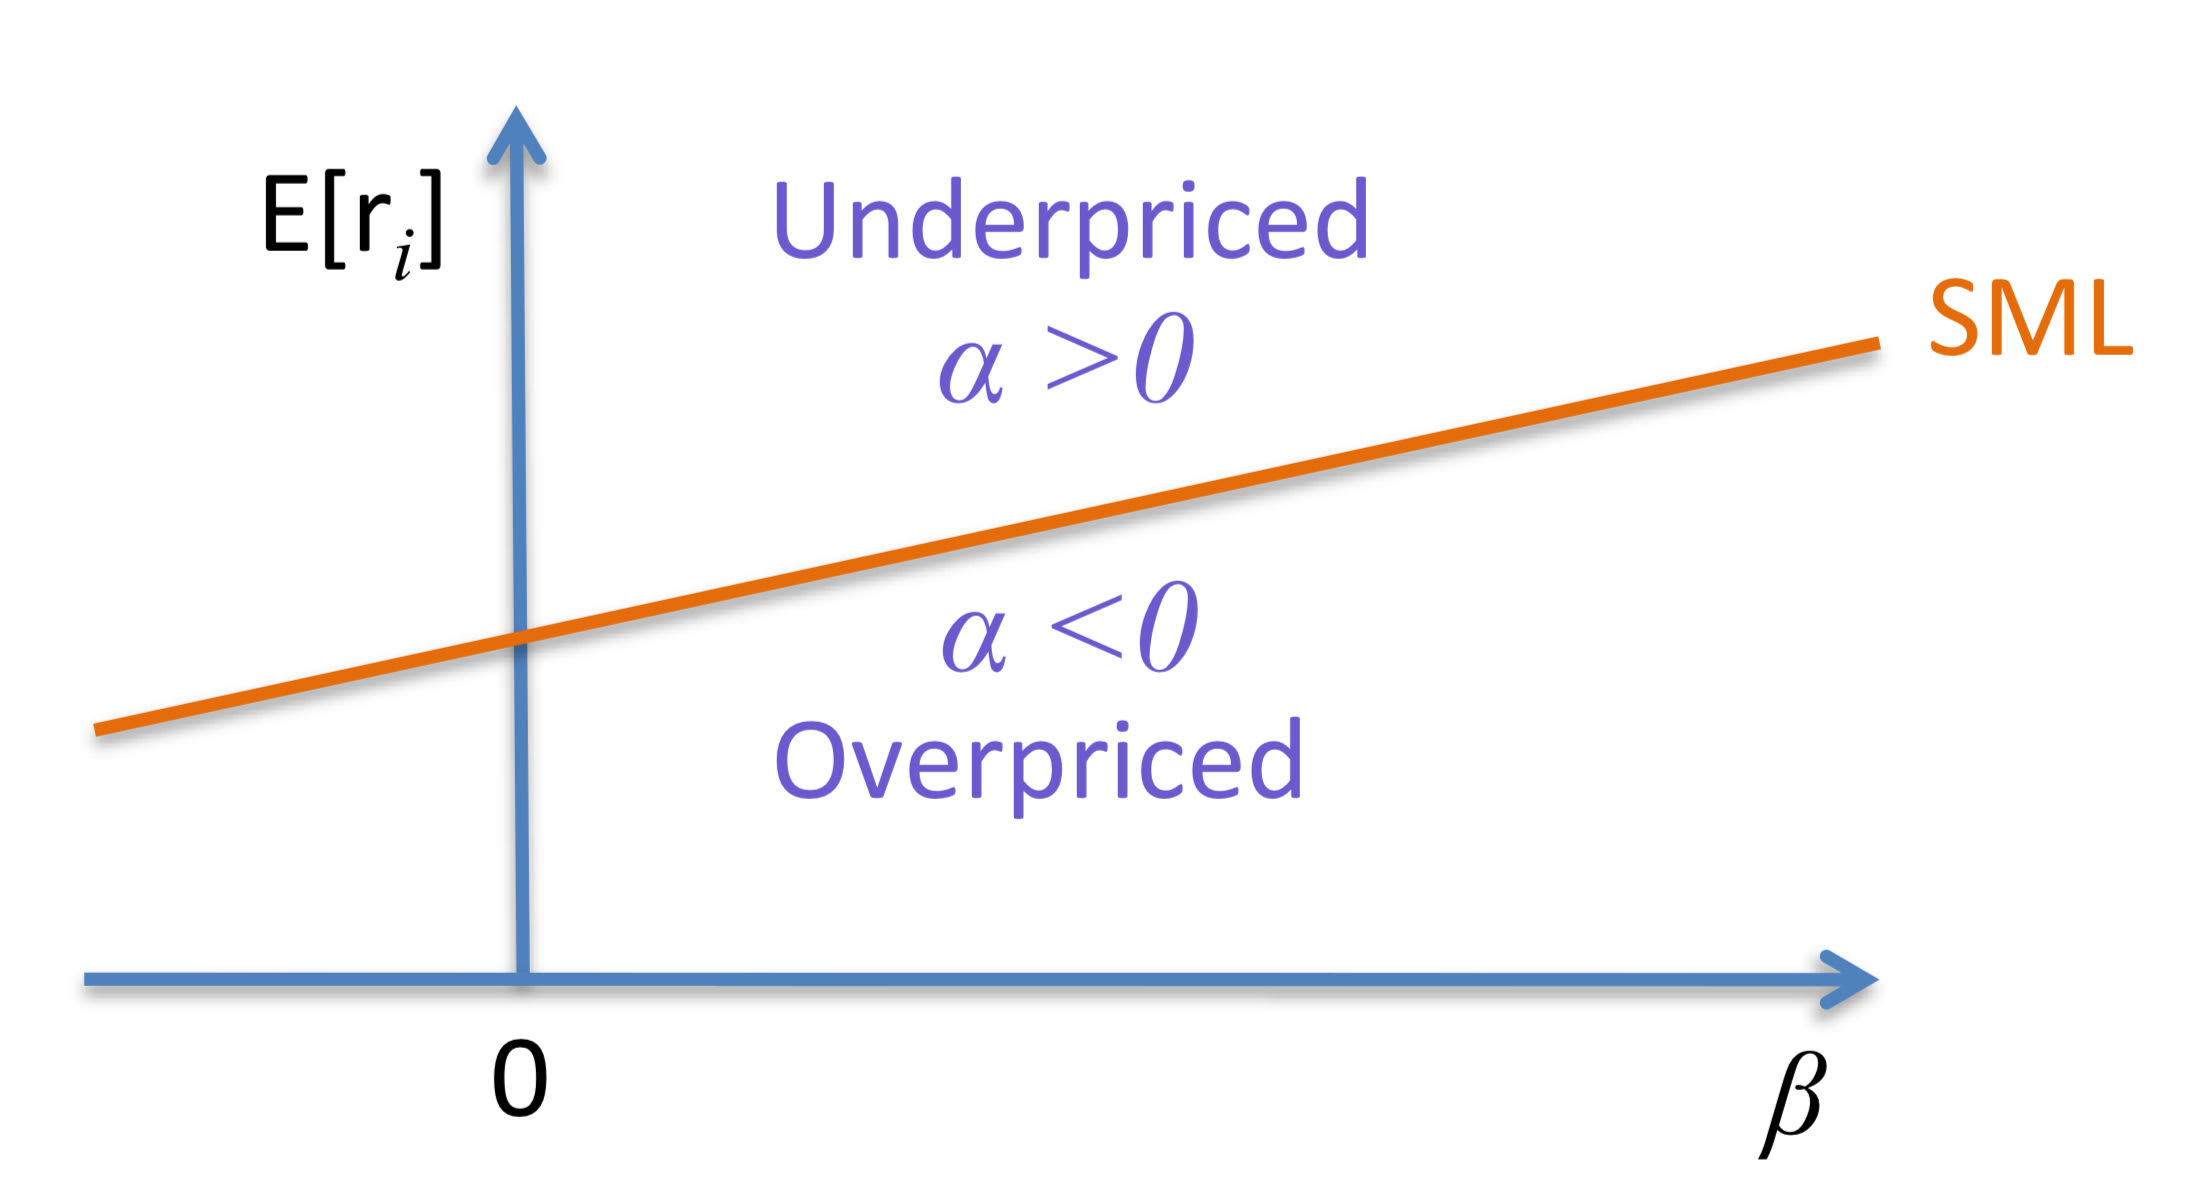
Assets (above/below) the SML are overpriced relative to the CAPM
below
…because the assets’ too lowly expected return means the price is too high compared to the fair CAPM value
Active Management in stock selection
An active strategy tries to beat the market by stock picking, timing, or other methods
BUT, CAPM implies that:
Security analysis is not necessary
Every investor should just buy a mix of the risk-free security and the market portfolio (passive strategy)
Grossman-Stiglitz Paradox: How can the market be efficient if everyone uses a passive strategy?
Capital Budgeting Steps
*Objective: increase the firm’s value
Calculate NPV
Use CAPM to calculate discount rate
The NPV of trading a security in a normal market is…
…0
NPV(buy security) = PV(all cash flows paid by the security) - Price(security) =0
NPV(sell security) = Price(security) - PV(all cash flows paid by the security) = 0
Given rf = 4%, E[rM] = 12%, and the cash flows below, which project should you choose:
Project A (B = 1.75)
Project B (B = 0.5)
Time | Cash Flow ($) |
|---|---|
0 | -1000 |
1 | 0 |
2 | 0 |
3 | 300 |
4 | 600 |
5 | 900 |
Calculate the NPV of A using the E[rA]
E[rA] = 0.04 + 1.75(0.12 - 0.04) = 0.18
NPV = -1000 + (300/1.183) + (600/1.184) + (900/1.185) = -$114
Calculate the NPV of B using the E[rB]
E[rB] = 0.04 + 0.5(0.12 - 0.04) = 0.08
NPV = -1000 + (300/1.083) + (600/1.084) + (900/1.085) = $292
Therefore, the better choice is Project B
What is the beta of the Market Portfolio? Why?

The risk-free rate is 6% and the expected return on the market is 18%. What is the expected return on a stock with a beta of 1.3?
E[rs] = 0.06 + 1.3(0.18 - 0.06) = 21.6%
Suppose Silverado Springs, Inc. is considering a new spring-water bottling plant. The business plan forecasts an IRR of 14% on the investment.
Research shows the beta of similar products is 1.3. If the risk-free rate is 4% and the market risk premium is estimated at 8%, what is the hurdle rate for the project? Should the project be undertaken?
*A hurdle rate is the minimum rate of return required on a project or investment.
E[rP] = 0.04 + 1.3(0.08) = 14.4%
14.4 > 14
The project should not be undertaken.
The expected return on the market is 18%. The expected return on a stock with a beta of 1.2 is 20%. What is the risk-free rate?
0.20 = rf + 1.2(0.18 - rf)
rf = 8%
A given security has correlation with the market of 0.4 and standard deviation of returns of 13%. The standard deviation of the market returns is 8%. What is the security’s beta?
B = Cov[Ri, Rm] / om² where Cov[Ri, Rm] = pi,moiom
(0.4×0.13×0.08)/(0.08²) = 0.65
Summary of CAPM
The CAPM follows from equilibrium conditions in a frictionless mean-variance economy with rational investors.
Everyone should hold a mix of the market portfolio and the risk-free asset (a portfolio on the CML)
The expected return on a stock is a linear function of its beta (stocks should be on the SML)
Applications of the CAPM
Portfolio choice
Shows what a “fair” security return is
Provides a benchmark for security analysis
Required return use in capital budgeting
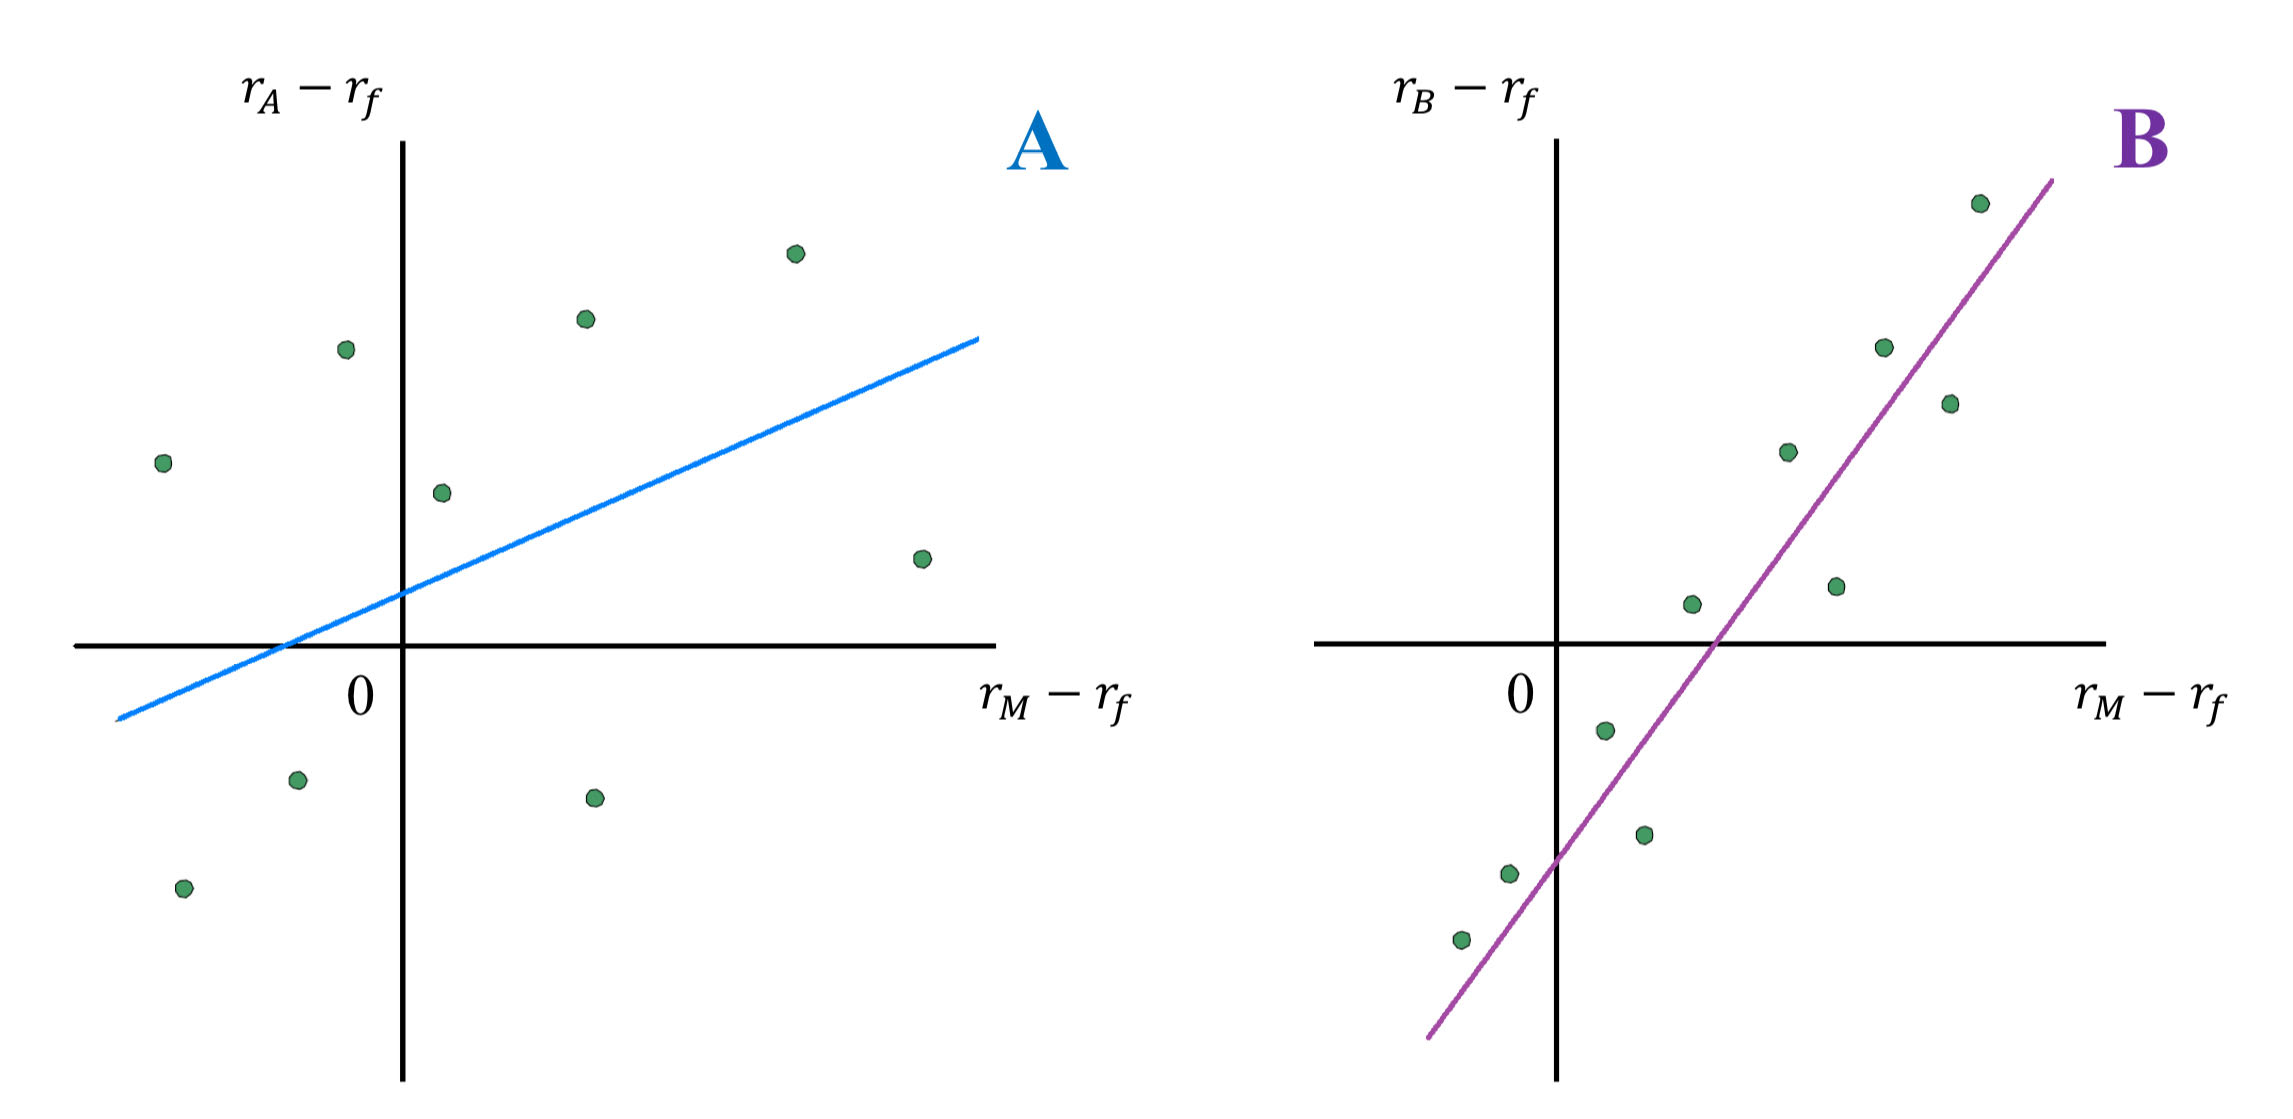
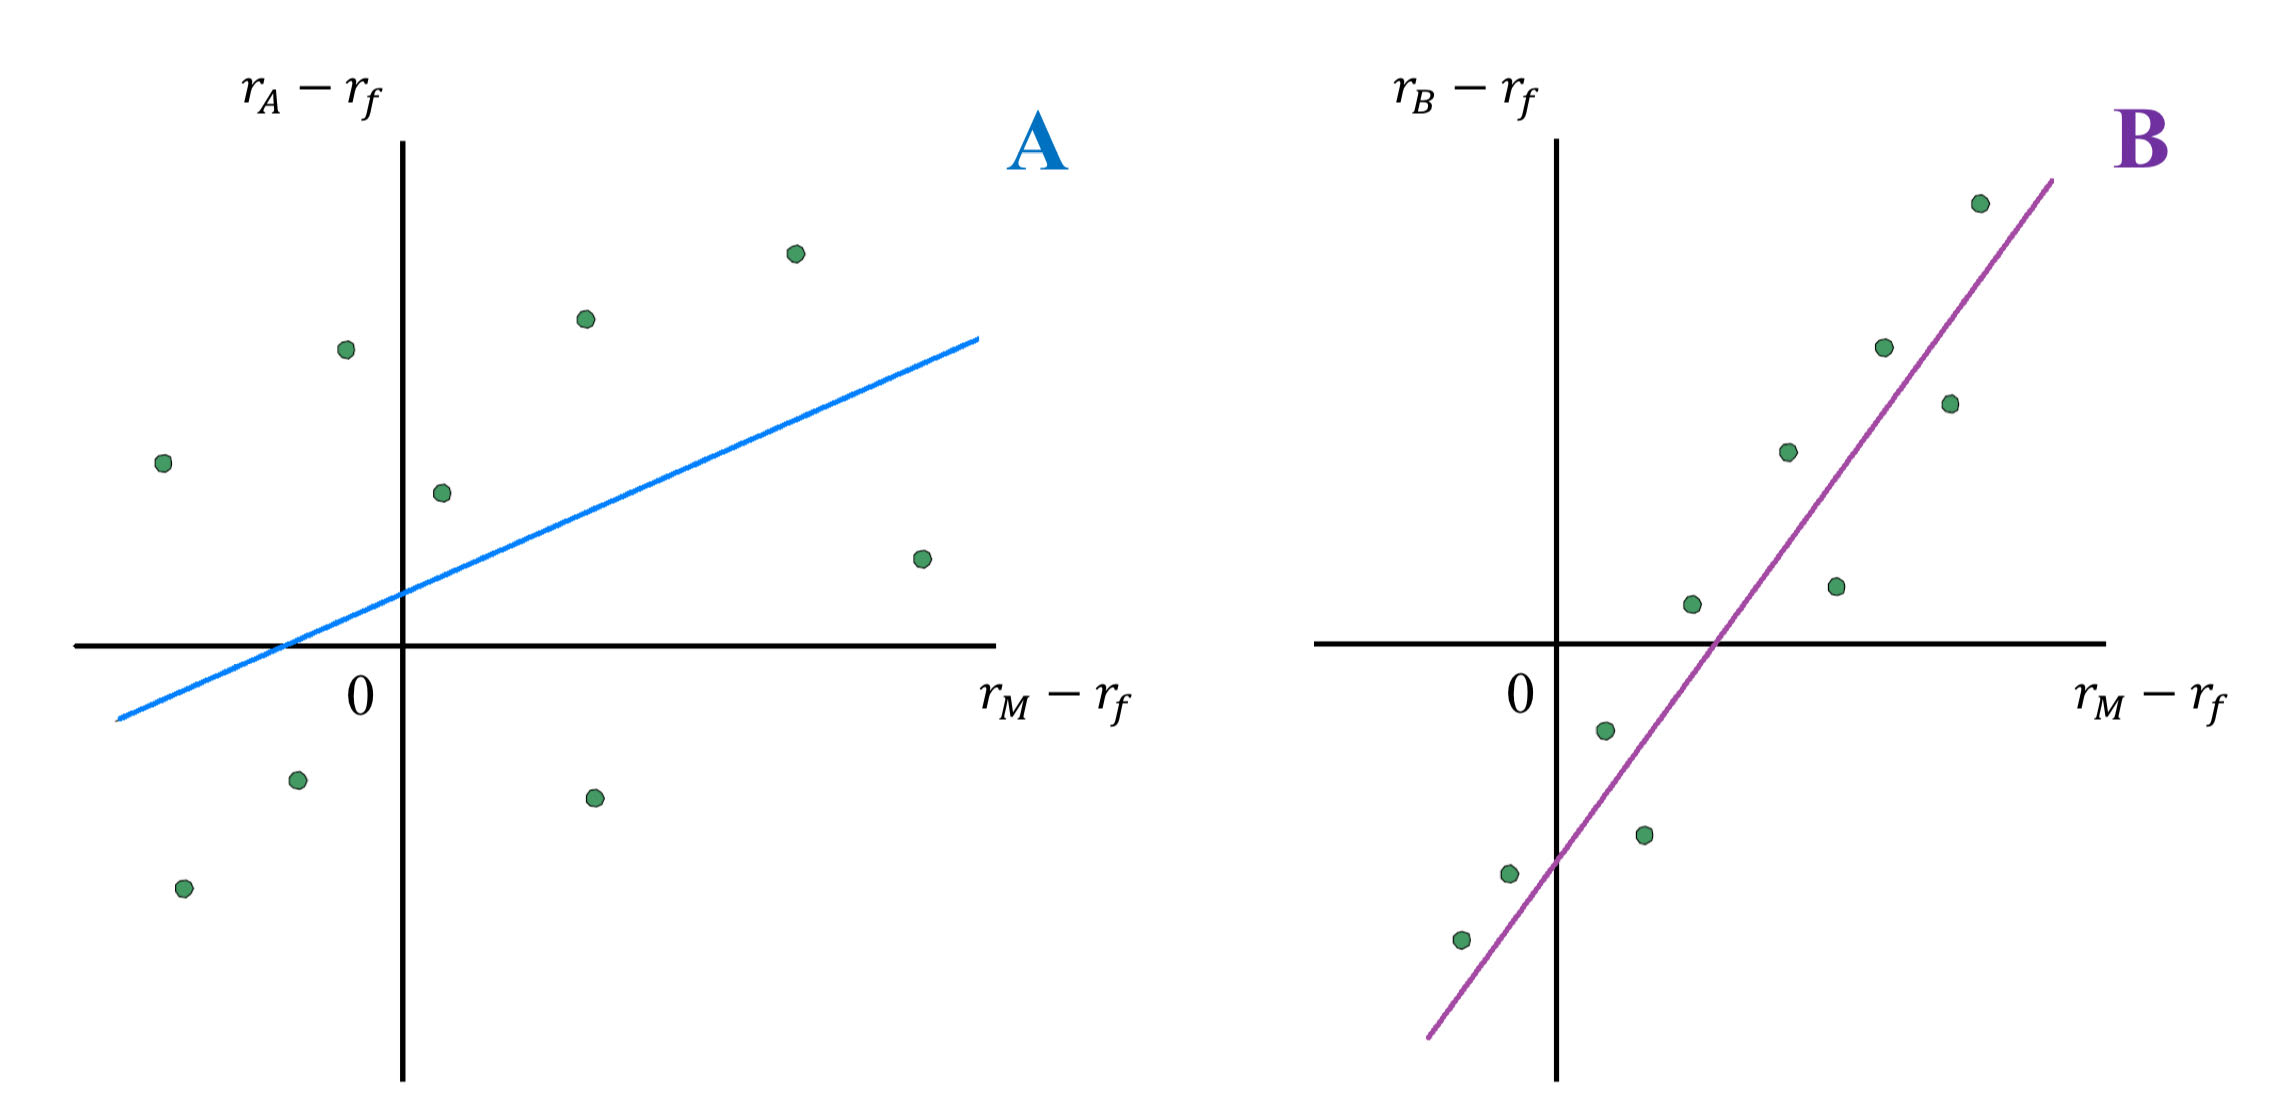
Consider these Security Characteristic Lines:
Which stock has higher systematic risk?
Stock B has higher systematic (or market) risk. The SCL for Stock B is steeper; hence Stock B’s systematic risk is greater.
*Beta is the slope of the SCL, which measures systematic risk.
Consider these Security Characteristic Lines:
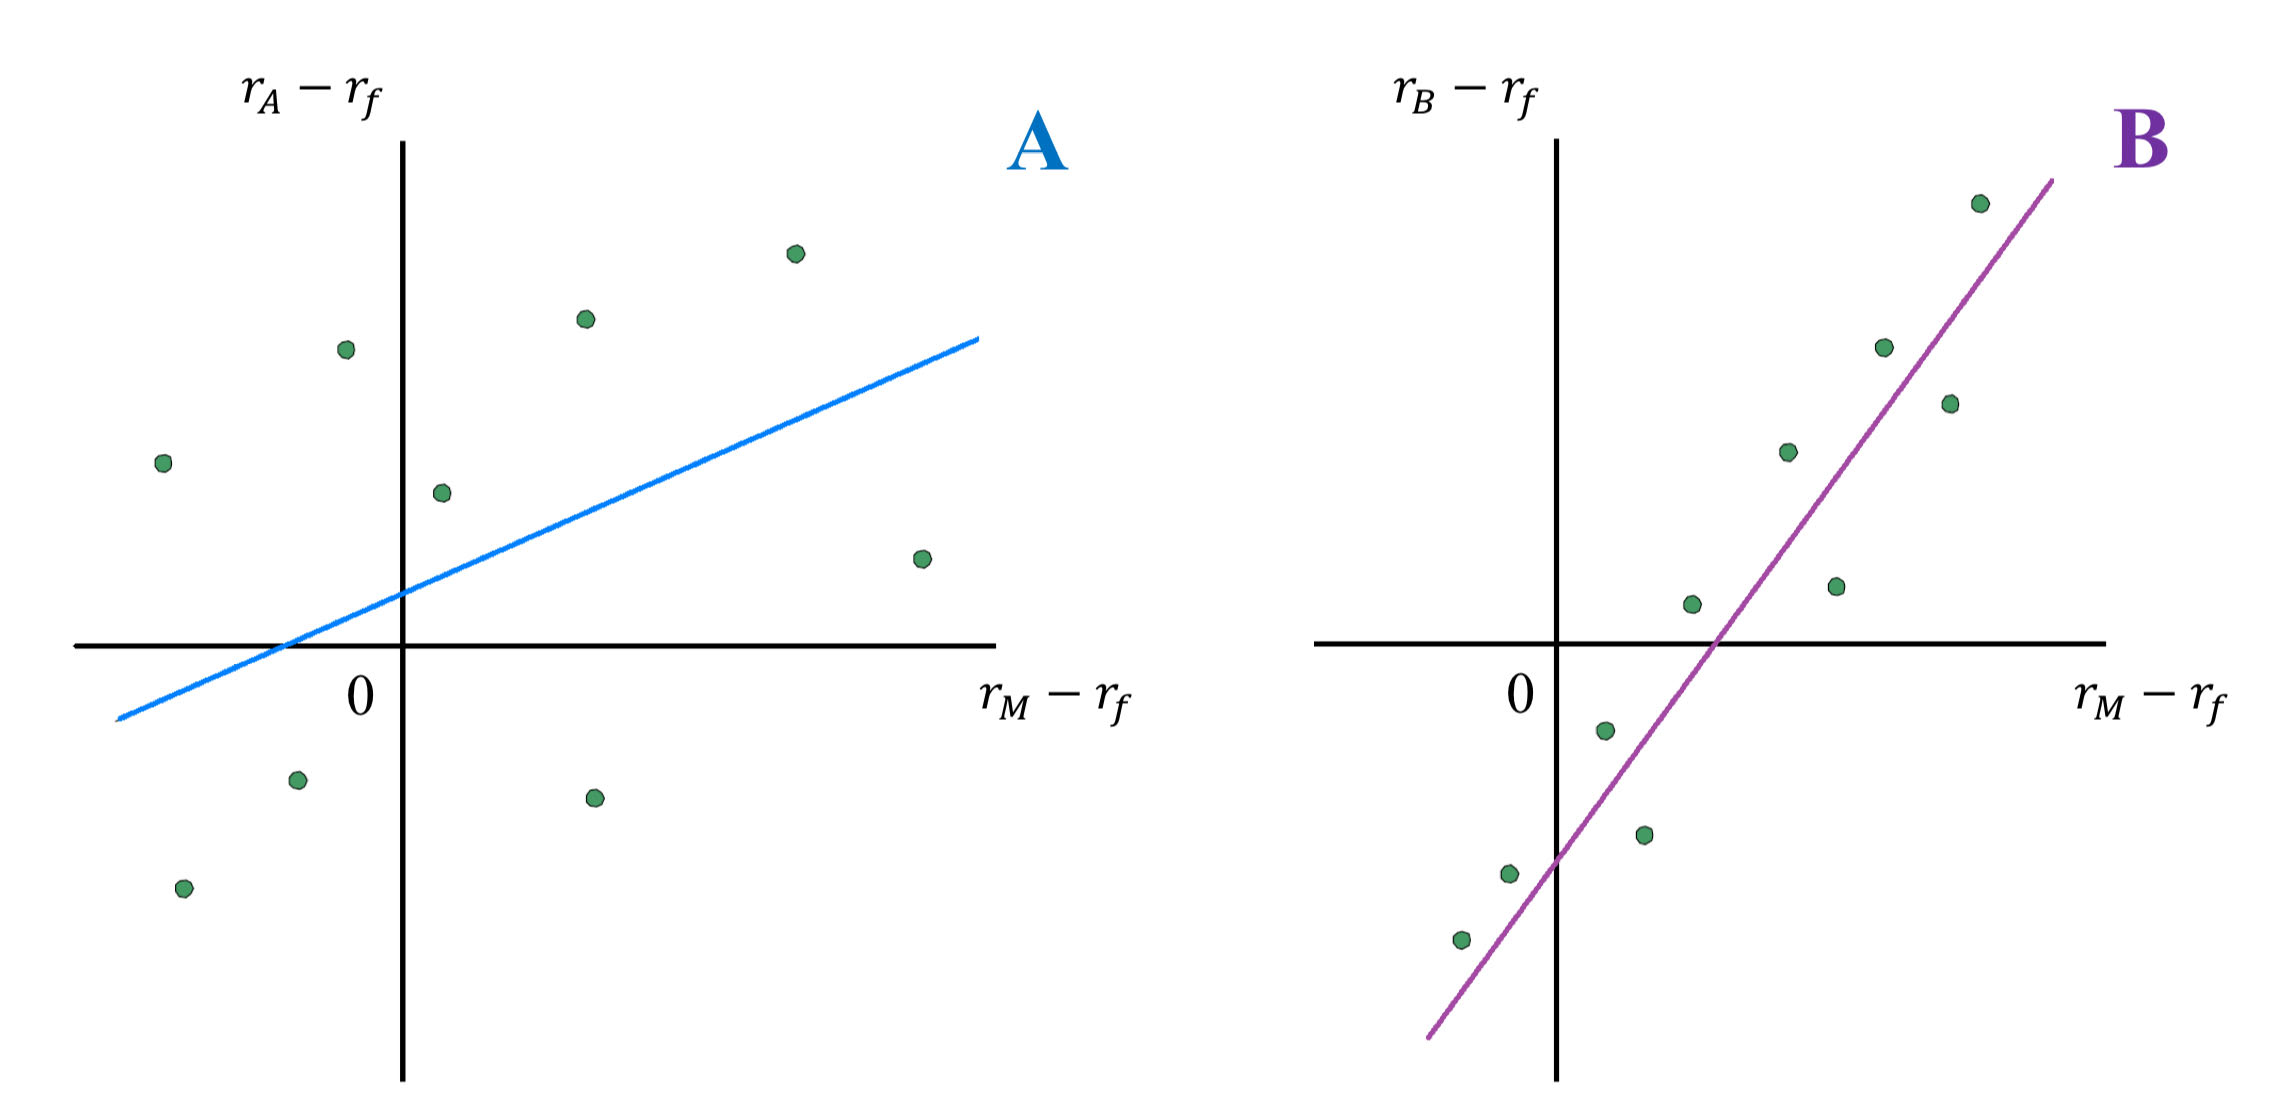
Which stock has higher firm-specific risk?
Stock A has higher firm-specific risk because the deviations of the observations from the SCL are larger for Stock A than for Stock B.
*Deviations are measured by the vertical distance of each observation from the SCL.
Consider these Security Characteristic Lines:
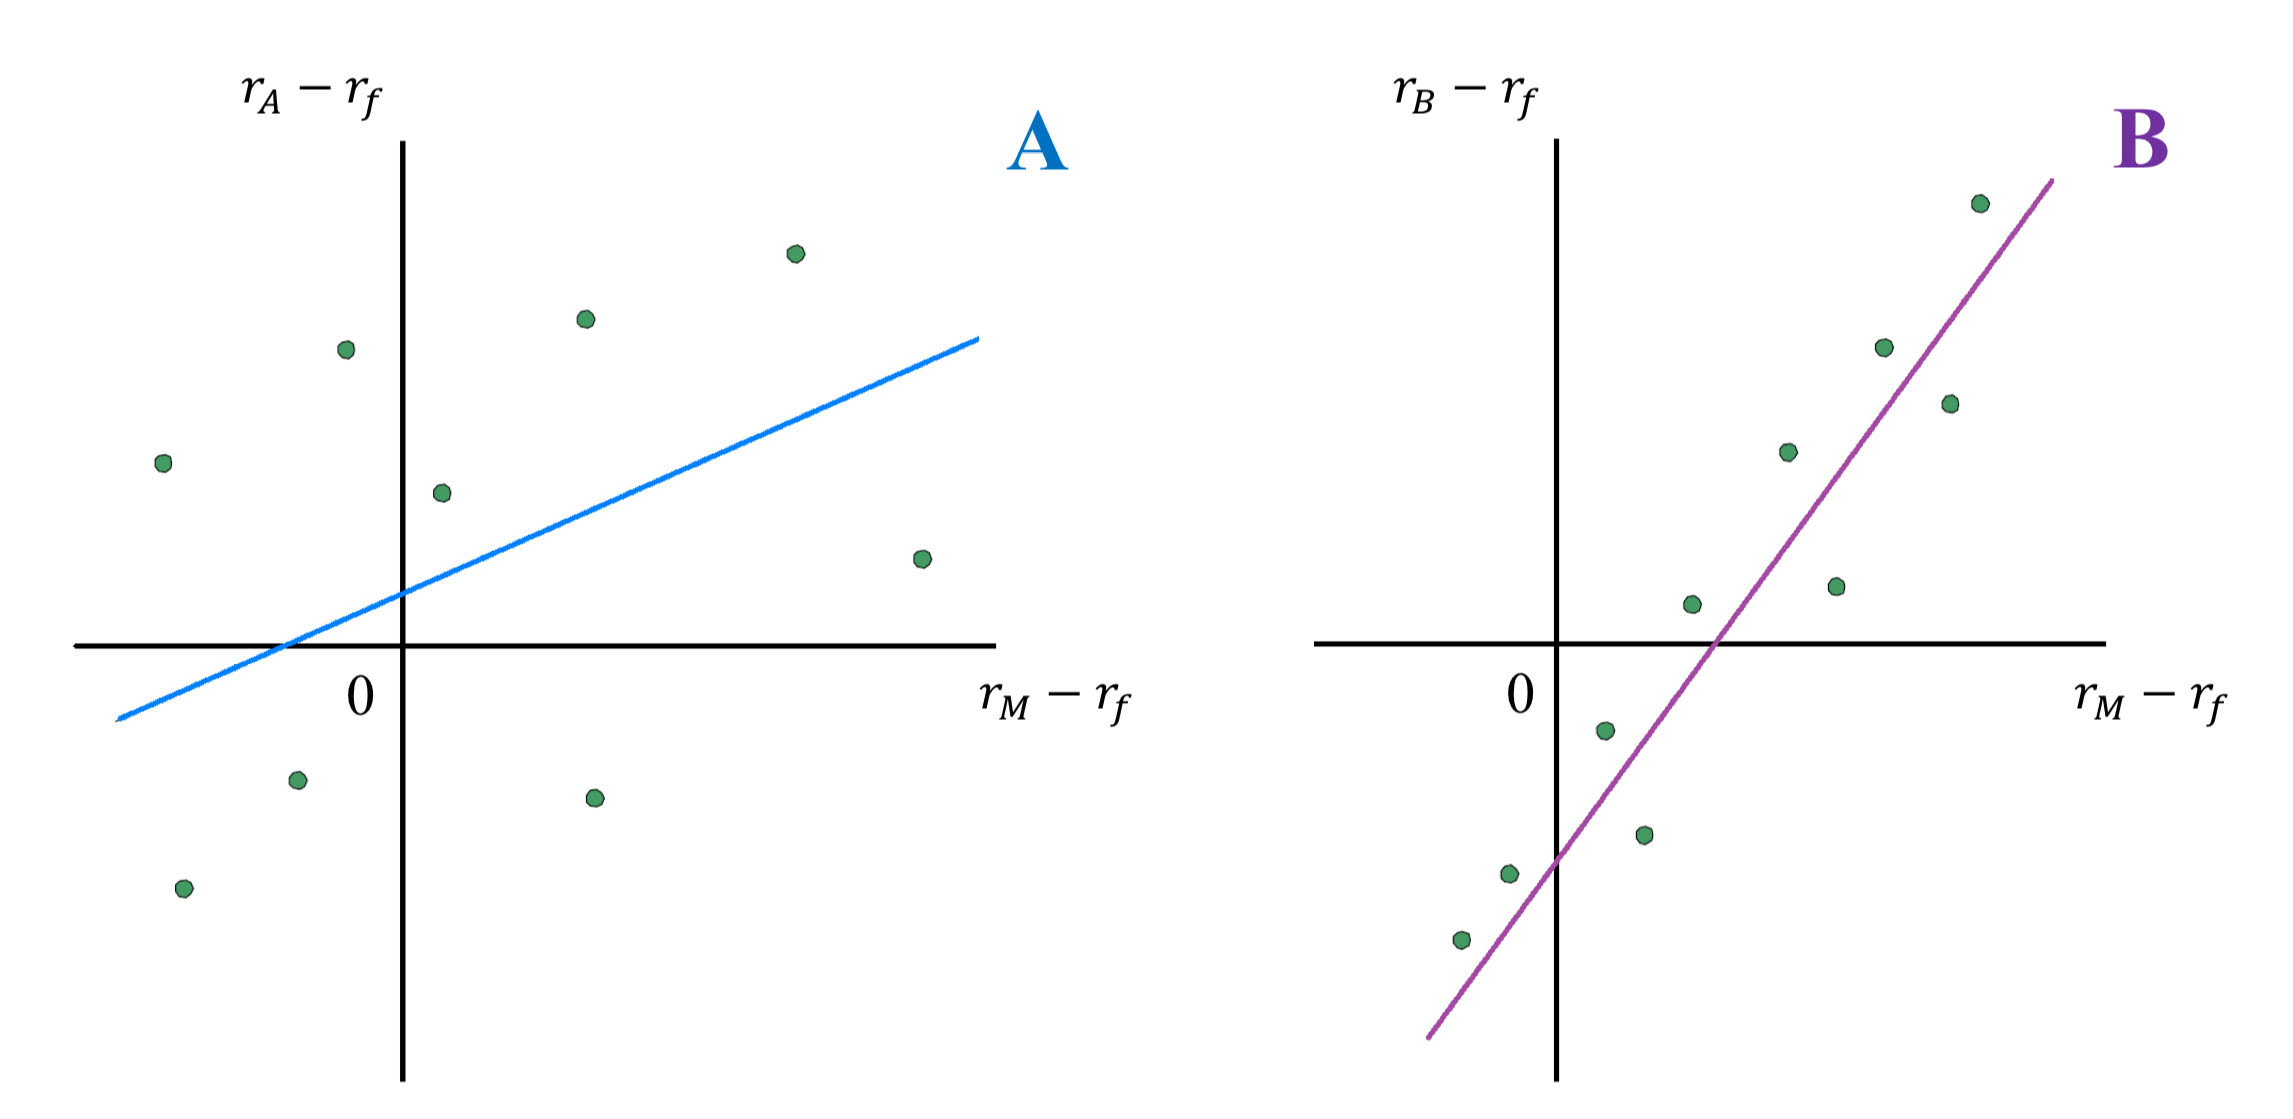
Which stock has higher alpha?
Stock A has a small positive alpha whereas Stock B has a negative alpha; hence, Stock A’s alpha is larger.
*Alpha is the intercept of the SCL with the expected return axis.
Consider these Security Characteristic Lines:
Which stock has higher correlation with the market?
Stock B’s correlation with the market is higher.
*The correlation coefficient is simply the square root of R²
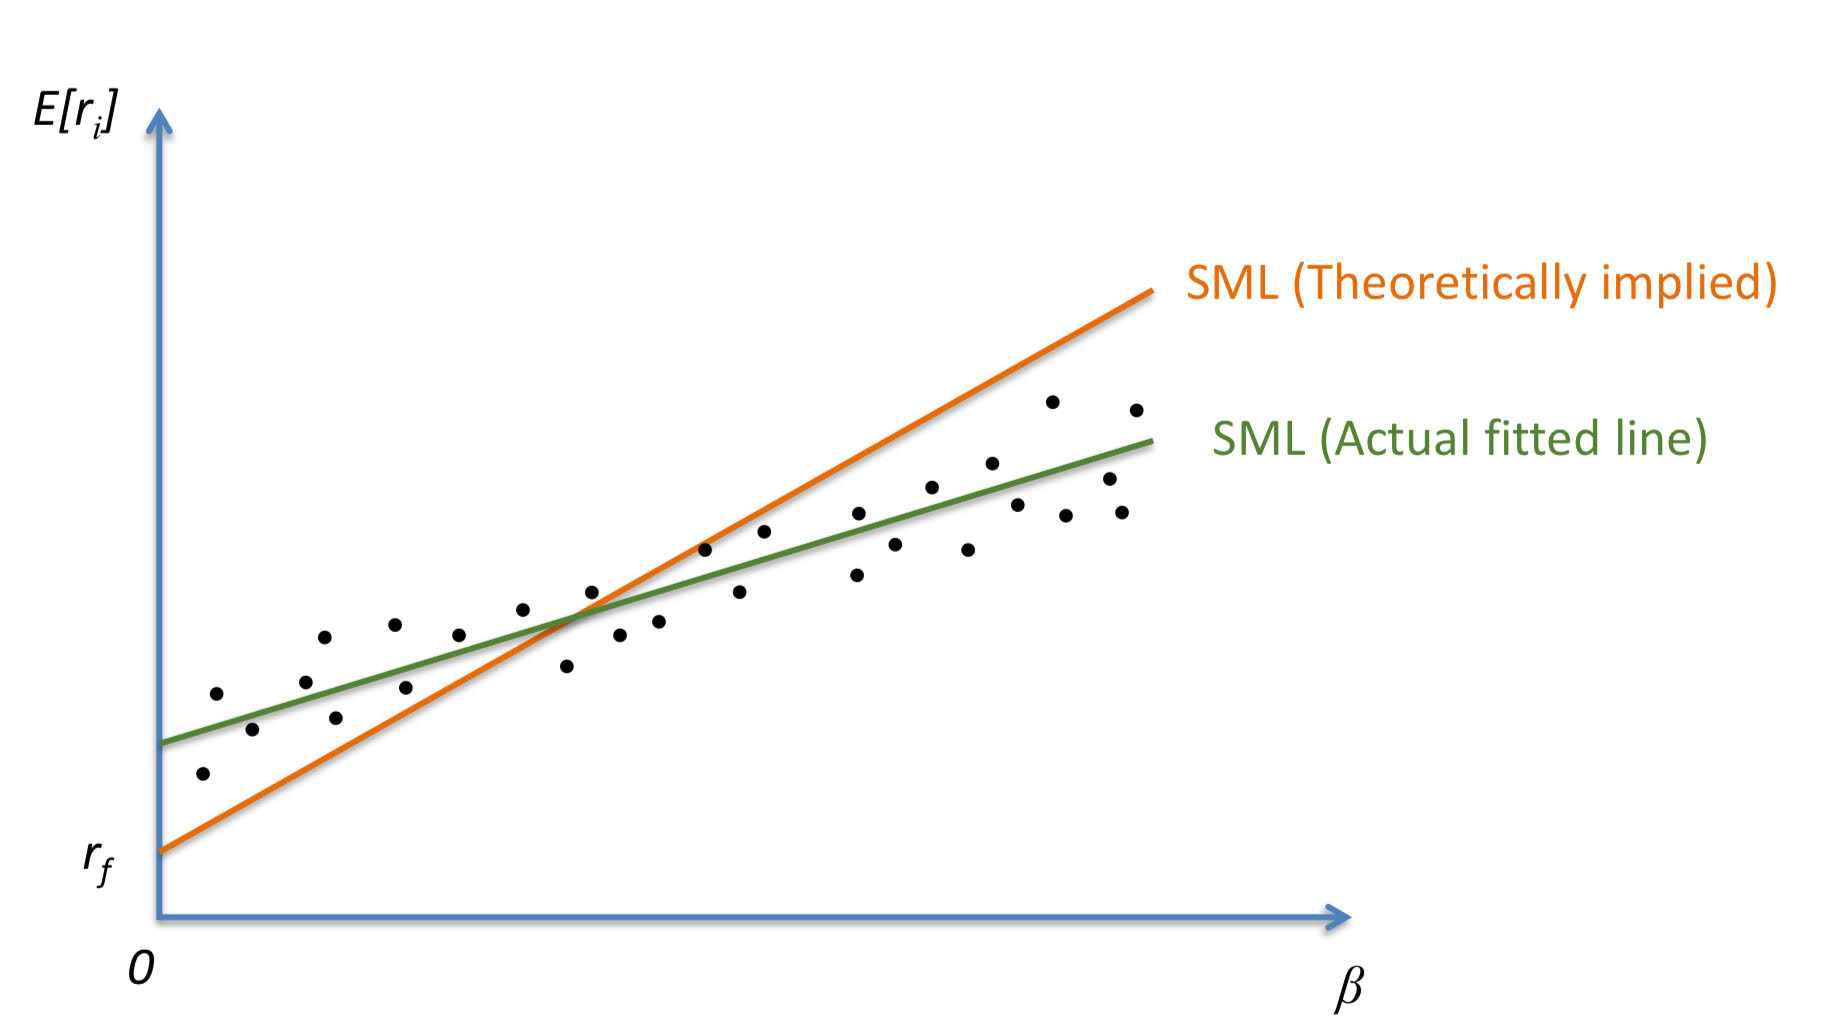
How can we test CAPM?
CAPM predicts that alpha = 0
CAPM predicts higher returns for stock with higher beta
Problems with testing CAPM
The theoretical market portfolio is unavailable
Only realized returns can be tested since expected returns are unobserved
What is the appropriate market risk premium? What is the appropriate beta?
Findings of CAPM Tests
Risk-reward relationship
High beta portfolios have higher average returns, but the reward for beta-risk is less than CAPM’s projection
Too many cases where alpha does not equal 0
When alpha > 0, the stock is outperforming the market
When alpha < 0, the stock is underperforming the market
a > 0 | a < 0 |
|---|---|
low beta | high beta |
high b/m (value) | low b/m (value) |
small firm | large firm |
*b/m = book-to-market value
Pros and Cons of CAPM
PROS:
Returns are positively related to Beta
Returns are not related to firm-specific risk
There is no reward for bearing firm-specific risk, only non-diversifiable risk is rewarded
CONS:
Risk-reward relationship is not as strong as predicted
Other factors such as size and B/M have explanatory power in predicted returns
alpha is never 0 in reality
Investment Criteria according to CAPM
Diversify - no reward for bearing firm-specific risk
Invest more heavily in low beta stocks
Invest in small firm stocks (market cap)
Invest in high value (B/M) stocks
Assume CAPM holds and consider the following:
Portfolio A has an expected return of 15% and beta of 2.0
Portfolio B has an expected return of 10% and a beta of 0.8
What is the expected return on a portfolio with B = 0.4?
If you only have access to portfolios A and B, how can you create a portfolio with B = 0.4?
Plug values in for Portfolios A and B:
E[rs] = rf + B(E[rm] - rf)
For stock A:
0.15 = rf + (2.0)(E[rm] - rf)
For stock B:
0.10 = rf + (0.8)(E[rm] - rf)
Solve for one of the variables:
rf = 6.7%
E[rm] = 10.84%
Plug in to find the E[rP] for B = 0.4:
E[rP] = 0.067 + 0.4(0.1084 - 0.067) = 8.33%
Assume CAPM holds and that rf = 5%, E[rm] = 15%, om = 20%
Assume that for APPL shares E[rA] = 16.5%, oA = 40%, and Corr[rA,rm] = 0.49
Is APPL fairly priced? Buy or don’t buy?
Calculate the Beta:
(0.49 × 0.40 × 0.20) / (0.20²) = 0.98
Plug values into Expected Return formula:
E[rA] = 0.05 + 0.98(0.15 - 0.05) = 14.8%
Calculate the Alpha:
16.5 - 14.8 = 1.7
APPL is not fairly priced since 14.8 < 16.5
The alpha is also positive at 1.7
Therefore, the stock is underpriced and you should buy it.