Business 212: Business Statistics Ch 10. Confidence Intervals
1/103
There's no tags or description
Looks like no tags are added yet.
Name | Mastery | Learn | Test | Matching | Spaced | Call with Kai |
|---|
No analytics yet
Send a link to your students to track their progress
104 Terms
estimation
the tool that is used in mathematics to make inferences about populations from data
point estimation
interval estimation
sample
a part of a population used to describe the whole group
statistic
the characteristics of a sample used to infer information about the population
point estimation
a type of estimation that uses a single value, a sample statistic, to infer information about the population
population
all members of a specified group
parameter
the characteristics used to describe a population
interval estimation
the range of numbers in which a population parameter lies considering margin of error
How does a population differ from a sample?
A population is all of the members of a specified group, while a sample is all of the members of an unspecified group.
A population is all of the members of a specified group, while a sample is only some of them.
A sample is all of the members of a specified group, while a population is only some of them.
A sample is all of the members of a specified group, while a population is all of the members of an unspecified group.
A population is all of the members of a specified group, while a sample is only some of them.
What is a type of estimation that uses a single value, a sample statistic, to infer information about the population?
Point estimation
Interval estimation
Parameter
Population
Point estimation
What is the range of numbers in which a population parameter lies considering margin of error?
Sample
Population
Interval estimation
Point estimation
Interval estimation
What is the tool used in mathematics to make inferences about populations from data?
Intervals
Statistic
Sample
Estimation
Estimation
What are the characteristics used to describe a population?
Interval estimation
Parameters
Point estimation
Sample
Parameters
confidence interval
the point estimate +/ - the margin of error
point estimate
the value of a sample statistic, which is used as an estimate of a population parameter
margin of error
the number added to or subtracted from the point estimate
A statistician is trying to figure out the sample size needed for an estimation of mu, but they don't know the population standard deviation. What should they do?
They should use a preliminary sample to figure out n and use that instead of sigma.
They should guess the required sample size.
They should use a preliminary sample to figure out E and use that instead of sigma.
They should use a preliminary sample to figure out s and use that instead of sigma.
They should use a preliminary sample to figure out s and use that instead of sigma.
The sample size is denoted by:
s
mu
E
n
n
The sample mean is denoted by:
sigma
E
x-bar
y-bar
x-bar
The number added to or subtracted from the point estimate is known as the:
Margin of error
Mu
Sigma
Confidence level
Margin of error
The _____ is the value of a sample statistic, which is used as an estimate of a population parameter.
point estimate
confidence level
margin of error
sigma
point estimate
standard deviation
the variability of individual observations around the mean
popular standard deviation
σ
population mean
μ (mu)
confidence interval
a range of values that expresses the uncertainty associated with a parameter, like the population mean
Case I
the population standard deviation is known
the sample size is small (n < 30)
the population is normally distributed
use normal distribution
Case II
the population standard deviation is known
the sample size is large (n ≥ 30)
use normal distribution
Case III
the population standard deviation is known
the sample size is small (n < 30)
the population is not normally distributed or we don’t know its distribution
nonparametric methods
margin of error (E)
E = zσx̄
the quantity we subtract or add to x̄ to obtain a confidence interval for μ
A baker is trying to determine how to price one of their loaves of bread. They take a sample of 25 comparable loaves at other bakeries, and find that they have a mean price of $3.25. If the population standard deviation for loaves of bread in this city is $1, and the population is normally distributed, then what's a 90% confidence interval for the mean of the price of all similar loaves of bread in this city?
$2.92 to $3.58
$2.25 to $4.25
$2.90 to $3.60
$3.05 to $3.45
$2.92 to $3.58
What is the term for the variability of individual observations around their mean?
Standard deviation
Population mean
Standard error
Sample mean
Standard deviation
The population mean is denoted by which of the following symbols?
Kappa (κ)
Mu (μ)
Beta (β)
Sigma (Σ)
Mu (μ)
The quantity that we subtract or add to x-bar (x̄) to obtain a confidence interval for mu (μ) is known as which of the following?
Standard error
Population mean
Margin of error
Standard deviation
Margin of error
A sample is considered to be small under which of the following circumstances?
It's less than 60 but greater than 30.
It's less than 30.
It's greater than 60 but less than 100.
It's greater than 30.
It's less than 30.
standard deviation
the variability of individual observations around their mean
s = sample standard deviation
μ = population mean
t distribution (student’s t distribution)
a kind of symmetric, bell-shaped distribution curve that has a lower height but a wider spread than the standard normal distribution curve
degrees of freedom (df)
n-1
n = sample size
The t distribution is also known as which of the following?
Standard normal distribution
Normal distribution
Teacher's t distribution
Student's t distribution
Student's t distribution
What is the margin of error if a sample size of 200 with an x-bar of 125 has a standard deviation of 12 and a t-value of 2.064?
Express your answer as the mean ± margin of error.
200 ± 1.75
125 ± 0.12
125 ± 1.75
200 ± 0.12
125 ± 1.75
When a population is normally distributed and sigma is unknown, we calculate the margin of error as which of the following?
C = t*s_x-bar
E = t*s_x-bar
E = t*s_mu-bar
E = sigma*s_x-bar
E = t*s_x-bar
If the sample size is 100, how many degrees of freedom are there?
101
100
50
99
99
The sample's mean is denoted by which symbol?
Mu
x-bar
Sigma
E
x-bar
degrees of freedom
represent how many values involved in a calculation have the freedom to vary
df = N - 1
N
the number of values in the data set or the sample size
mean
average
standard deviation
a statistical value used to determine how far apart the data in a sample (or a population) are
sample
part of the population
What is a statistical value used to determine how far apart the data in a sample (or a population) are?
degrees of freedom
sample
standard deviation
statistics
standard deviation
For N = 9, what are the degrees of freedom?
1
9
8
0
8
What is a formula for degrees of freedom?
df = N + 1
df = N - 1
N = df -1
df = N
df = N - 1
Which is the best definition for degrees of freedom?
how many values involved in our calculations do not vary
a number that can help us compare triangles
how many values involved in a calculation have the freedom to vary
a mathematical equation used to figure triangle measurements
how many values involved in a calculation have the freedom to vary
If we are computing standard deviation, when do we use n-1 degrees of freedom?
Both of these answers are correct
When dealing with a population
None of these answers are correct
When dealing with a sample
When dealing with a sample
proportion
decimal form of a percentage
100% = 1.000
50% = 0.500
p-hat
used to refer to the proportion of a sample of the population
sampling error
difference between the sample and population that results from not having access to the entire population
_____ are used because the population in its entirety is inaccessible and would require polling too many people.
point estimate
proportion
p-hat
sample proportions
sample proportions
All of the following are important things to consider while sampling from a population EXCEPT:
Making sure your sample represents the population.
Making sure your sample is randomly selected.
Making sure your sample proportion matches the population proportion
Making sure that n times p-hat and n times 1-p-hat are at least 5.
Making sure your sample proportion matches the population proportion
Which of the following situations would give us the best estimate of a population proportion?
Sample size 100, sample proportion 0.40
Sample size 110, sample proportion 0.38
Sample size 150, sample proportion 0.34
Sample size 120, sample proportion 0.58
Sample size 150, sample proportion 0.34
About how big a sample size would we need if we wanted a margin of error of no more than 4% (.04)?
625
25
100
250
625
If Mr. Smith polls 240 people and finds that 112 will vote for Bill Jones, which of the following is true?
The sample proportion is 112
The population proportion is .467
The population proportion is 112
The sample proportion is .467
The sample proportion is .467
confidence interval
the point estimate +/ - the margin of error
point estimate
the value of a sample statistic, which is used as an estimate of a population parameter
population proportion
p
sample proportion
p̂
margin of error (E)
add and subtract from p̂
the number added to or subtracted from the point estimate
In the formula for the confidence interval, why do we add and subtract z * s_p-hat from p-hat?
Because z * s_p-hat represents the margin of error.
Because z * s_p-hat represents the degree of confidence.
Because p-hat represents the degree of confidence.
Because p-hat represents the margin of error.
Because z * s_p-hat represents the margin of error.
In a survey of 200 people, there was a 65% chance that a participant had been to Europe. Based on this information, what's a good estimate of the standard deviation?
3.4
0.0011
0.11
0.034
0.034
What do p and p-hat denote, respectively?
The population proportion and the sample proportion.
The population and the sample.
The sample and the population.
The sample proportion and the population proportion.
The population proportion and the sample proportion.
Which of the following statements BEST explains why one might utilize the confidence interval?
You want to quantify your confidence in a conclusion derived from a sample.
You want to quantify your confidence in a conclusion derived from a population interval.
You want to quantify your confidence in a conclusion derived from a sampled interval.
You want to quantify your confidence in a conclusion derived from a population.
You want to quantify your confidence in a conclusion derived from a sample.
What is the margin of error?
The number added to or subtracted from the sample E
The number added to or subtracted from the sample confidence interval
The number added to or subtracted from the point estimate
The number added to or subtracted from the population mean
The number added to or subtracted from the point estimate
point estimate
the value of a sample statistic, which is used as an estimate of a population parameter
confidence level
how confident we are that the interval contains the true population parameter
(1-alpha) 100%
alpha = the significance level
alpha = 0.01 or 0.05
the most common confidence levels are 90%, 95%, and 99%
confidence coefficient
the corresponding confidence level shown as a proportion as opposed to a percentage
(1-alpha)
0.90, 0.95, and 0.99, respectively
Which of the following is a confidence coefficient?
99%
0.95
(1-alpha)100%
95%
0.95
The _____ is the value of a sample statistic, which is used as an estimate of a population parameter.
point estimate
confidence interval
interval estimate
margin of error
point estimate
The number added to or subtracted from the point estimate is known as the:
Margin of safety
Margin of error
Standard error
Standard deviation
Margin of error
Why would a statistician use a point estimate instead of just trying to find the relevant population parameter directly?
Because a point estimate can be calculated from a sample of a larger population, so the relevant information required is easier to gather.
Because a point estimate can be calculated from a sample of a larger population, so it will be identical to the population parameter.
Because finding a population parameter requires integration, while finding a point estimate does not.
Because finding a population parameter requires differentiation, while finding a point estimate does not.
Because a point estimate can be calculated from a sample of a larger population, so the relevant information required is easier to gather.
Which of the following can be used to calculate the confidence level?
(1-alpha)100%
The point estimate +/- the margin of error
1-alpha
(1-alpha)10%
(1-alpha)100%
confidence interval
a numeric value that quantifies the risk of incorrectly accepting or rejecting a hypothesis
degrees of freedom
used to describe expected variances in data that might otherwise be cause for concern
point estimate
an unknown statistical value that is essentially a ''best guess'' created for the purpose of projection and analysis when the true value will not be known until a later time
The leadership team of a commercial airline is creating next year's budget. The actual cost of fuel is not known until it is actually purchased, but historical budgets demonstrate that jet fuel prices rise an average of 3-5% per year. When the team projects fuel expenses using today's price plus 5%, they are making use of a:
Point estimate
Confidence interval
Standard deviation
Degree of freedom
Point estimate
Incorrectly calculating or applying the appropriate _____ may lead to the belief that a value is problematic (or an outlier) when, in fact, the value is accurate but dynamic.
Point estimate
Confidence interval
Degree of freedom
Bell curve
Degree of freedom
All Saints Hospital is using internal research to determine where to open a satellite hospital. The Board of Directors votes to place the new facility in Harristonville because they have concluded that ''hospitals perform better financially when placed in suburban communities.'' This conclusion is an example of a:
Standard deviation
Confidence interval
Hypothesis
Point estimate
Hypothesis
Basin Wind & Sky ski resort signs most of its employees to seasonal, full-time roles. Payroll costs vary from year to year based on dates of operation and snow conditions. Which statistical analysis element allows Basin Wind & Sky to assess these fluctuations as normal rather than abnormal?
Confidence interval
Outlier rejection
Degree of freedom
Point estimate
Degree of freedom
Raj is an industrial psychologist who specializes in the relationship between retail product placement and consumer buying habits. As part of a market research study, Raj surveys four potential customers. Three of the four indicate that they would buy a cold soft drink only if it was placed in a checkout line. Which statement about Raj's market research is TRUE?
Raj's research indicates it is not going to be profitable to place cold drinks at the check out line.
The preference of 1 customer is an outlier and must be discarded.
The sample is too small - the confidence interval is below the threshold of being actionable.
Raj's research is accurate and should be acted upon.
The sample is too small - the confidence interval is below the threshold of being actionable.
null hypothesis
when you do research and your hypothesis doesn’t really get anywhere & it’s false
Type II Error
accepting the null hypothesis when it is false
Sample size
the number of participants in a study
generalizable
able to be applied to the general population
desirable when conducting research
inferential statistics
involves making predictions about a general population based on the outcomes of a sample
t-distribution
has fatter tails than a normal curve (greater area on the ends of the bell curve) to account for the uncertainty related to having a small sample size
Tony studied student grade improvement after exercise. His participants had the following results: -3, 5, 1, -2 and 4. What degrees of freedom should Tony use in his calculations?
4
The sample is too small for degrees of freedom to be found.
6
5
4
Samples under the size of _____ should be treated as small sample sizes.
10
100
300
30
30
Why are small sample sizes not recommended for inferential statistics?
It is not possible to conduct inferential statistical analysis on small sample sizes.
Inferential statistics attempt to describe only the sample given, thus small sample sizes are of little interest.
Small samples are perfect in inferential statistics.
Small sample results are not optimal for generalizability.
Small sample results are not optimal for generalizability.
Jia has a sample size of 15. He wants to be able to make inferences about the entire population based on his work. What should he do when calculating his confidence interval?
He should use the z-table to compare calculations because this distribution underestimates the general population standard deviation.
He should follow the same steps as he would if he were sampling the entire population.
He should add 16 to his degrees of freedom to ensure that he meets the correct level for generalizing small results to the general population.
He should use the t-table to compare calculations because this distribution uses fatter than normal tails under the normal curve to approximate the general population standard deviation.
He should use the t-table to compare calculations because this distribution uses fatter than normal tails under the normal curve to approximate the general population standard deviation.
Why would a researcher use a small sample size in a study if it is known that small samples risk un-generalizable results?
There are many reasons why a small sample size might be required or accepted in a study including all of those listed here.
There may be only a small group of participants readily available, as in the case of endangered animals in the wild.
The scenario may require small sample sizes, as in cases of extremely rare medical conditions.
Each observable data point may be the culmination of a large group, thus making a large sample size untenable.
There are many reasons why a small sample size might be required or accepted in a study including all of those listed here.
confidence interval
a measure of the reliability of a sample mean compared to the actual mean of the entire population
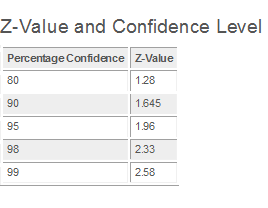
Z-value statistic/ Z-val
the actual tie between our chosen confidence interval and its associated normal distribution, expressed in standard deviations
one-tailed confidence interval
one particular end of that distribution
What does a confidence interval of 95% actually mean?
95% of the entire population will fit into the sampled range
95% of the time the sample range contains all the values in the entire population
95% of the time the average of the entire population should be in the average range of the sampled data
95% of the time our sample is large enough to support the associated calculations
95% of the time the average of the entire population should be in the average range of the sampled data