Systems Modelling
1/28
There's no tags or description
Looks like no tags are added yet.
Name | Mastery | Learn | Test | Matching | Spaced |
|---|
No study sessions yet.
29 Terms

How to draw a sine wave?

How to include a constant?
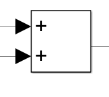
How to achieve addition in Simulink?

How to acheive scope output in Simulink?

How to include a derivative in Simulink?

How to acheive multiplication in Simulink?

How to achieve an integtrator in Simulink?

How to include a step response in Simulink?
Using the .* operator.
How to perform element-wise multiplication in MATLAB?
Using the * operator.
How to perform matrix multiplication in MATLAB?
figure; plot(t, y)
If we have an array of x values t and a array of y values y, how do we draw a plot of this in MATLAB?
Using the .^ operator.
How to carry out exponents in MATLAB?
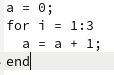
Write a MATLAB script that initialises a variable a to 0. Using a for loop, over three iterations increment the variable by 1.
hold on
How to enable multiple plots on the same figure in MATLAB?
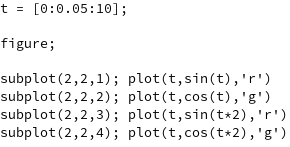
Give an example of using subplots to draw 4 subplots in a 2×2 grid.
xlabel(“Label name“) ylabel(“Label name“)
How to add X and Y labels to a plot?
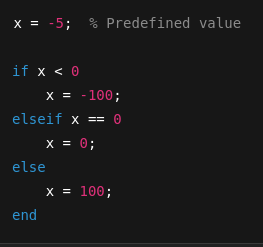
Write a MATLAB program that sets a var x to a predefined value. If it is less than 0, set it to -100. If it is equal to 0, set it to 0. Otherwise set it to 100.
plot3(x, y, z)
How to create a 3D plot in MATLAB with x, y and z values?
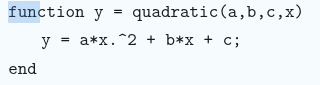
Write a function that takes in integer coefficents a, b, c and x and returns the value of the quadratic equation ax² + bx + c.
load dataset.mat;
How to load a dataset, dataset.mat in MATLAB?
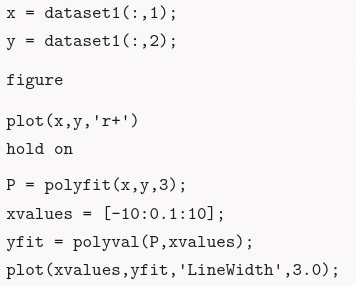
Give an example of using polyfit and polyval to fit polynomial models to data
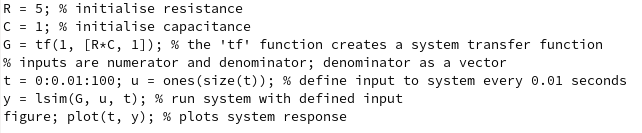
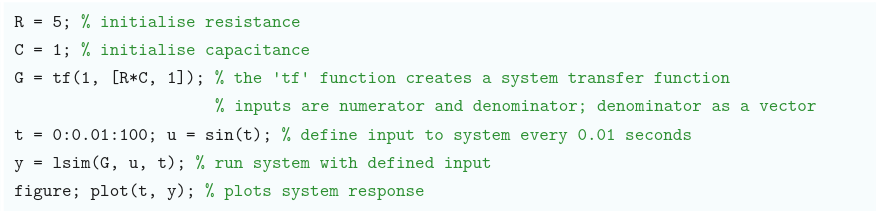
Give an example of plotting a step response graph using the lsim function, with the transfer function being 1/RCs + 1, and R being 5, C being 1. Set simulation time to be 10.
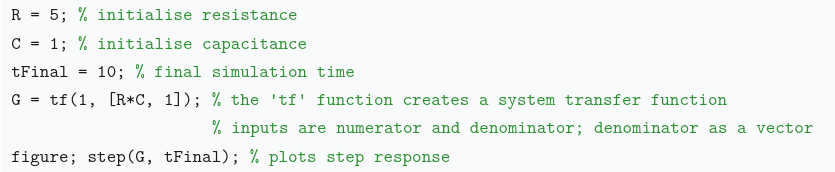
Give an example of plotting a step response graph using the tf function, with the transfer function being 1/RCs + 1, and R being 5, C being 1. Set simulation time to be 10.
Give an example of plotting a frequency response graph, with the transfer function being 1/RCs + 1, and R being 5, C being 1. Set simulation time to be 10
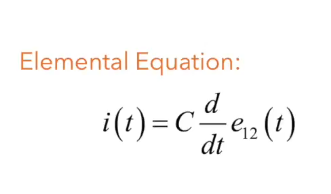
Elemental equation for capacitors
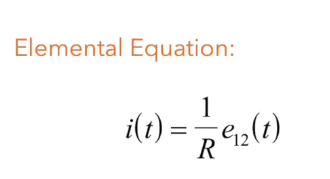
Elemental equation for resistors
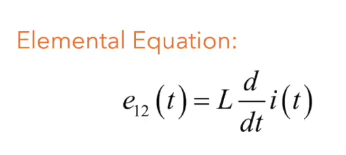
Elemental equation for inductors
T: 63% of final value, 2T: 86% of final value, 3T:95%, 4T:98%, 5T:99%
What are the percentages for the time constant in first order step responses?