Thinking Like an Analyst 2 - Data Prep & Analysis
1/11
Earn XP
Description and Tags
Data Prep & Analysis
Name | Mastery | Learn | Test | Matching | Spaced |
|---|
No study sessions yet.
12 Terms
What is Data Prep?
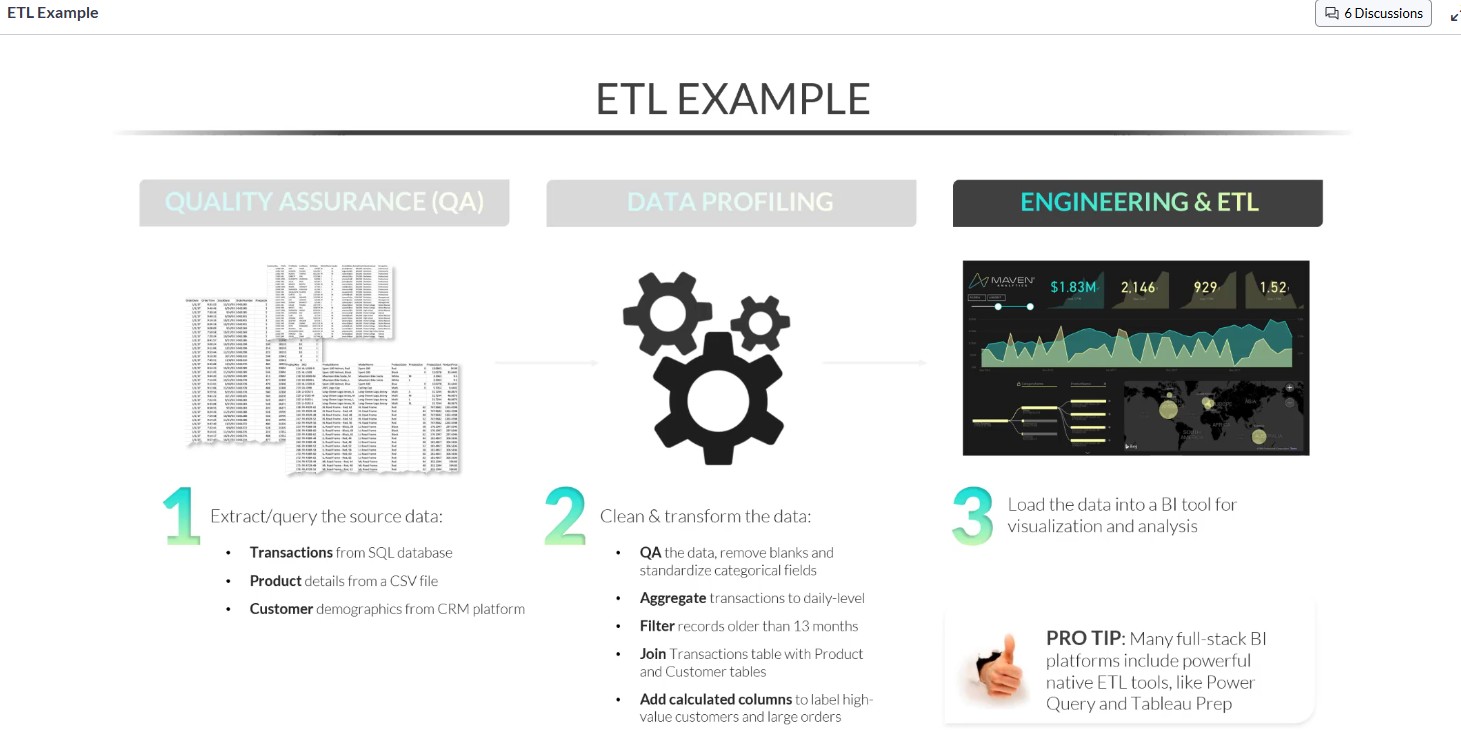
Data prep is about creating clean, quality data for analysis, and typically involves combination of quality (QA), basic profiling, and data engineering.
Quality Assurance
Data Profiling
Engineering & ETL (Extract Transform Load)
[See attached for definitions]
![<p>Data prep is about creating clean, quality data for analysis, and typically involves combination of quality (QA), basic profiling, and data engineering.</p><p></p><ol><li><p>Quality Assurance</p></li></ol><ol start="2"><li><p>Data Profiling</p></li><li><p>Engineering & ETL (Extract Transform Load)</p><p>[See attached for definitions]</p></li></ol><p></p>](https://knowt-user-attachments.s3.amazonaws.com/3ebbf3cf-371b-4960-8eae-af008f813cc8.jpg)
In terms of data, what does the saying “Garbage In, Garbage Out mean?
The “Output” of your data is only as good as your “Input”. Incorrect input will cause the results of the analysis to automatically be inaccurate.
What tool can be used to find naming inconsistencies in a spreadsheet? Example: TX vs Texas
Use “Distinct Count” to identify inconsistent number values such as abbreviated state name and full state names in the same column (All abbreviated names will only have 2 letters).
Solution: Choose the naming convention to be used (Name or abbreviation). Then use the “find and replace” tool to update the inconsistent values.
What do you do if you have random Empty values “Blank” cells in your column.
Either:
Keep
Substitute (Impute)
Remove
[See attachment]
Never replace empty or NULL values with 0 UNLESS you know for a fact it won’t skew the data!!!!!
![<p>Either:</p><ol><li><p>Keep</p></li><li><p>Substitute (Impute)</p></li><li><p>Remove</p><p>[See attachment]</p></li></ol><p>Never replace empty or NULL values with 0 UNLESS you know for a fact it won’t skew the data!!!!!</p>](https://knowt-user-attachments.s3.amazonaws.com/ed6b0242-20b3-465c-866b-ee1d53baa049.jpg)
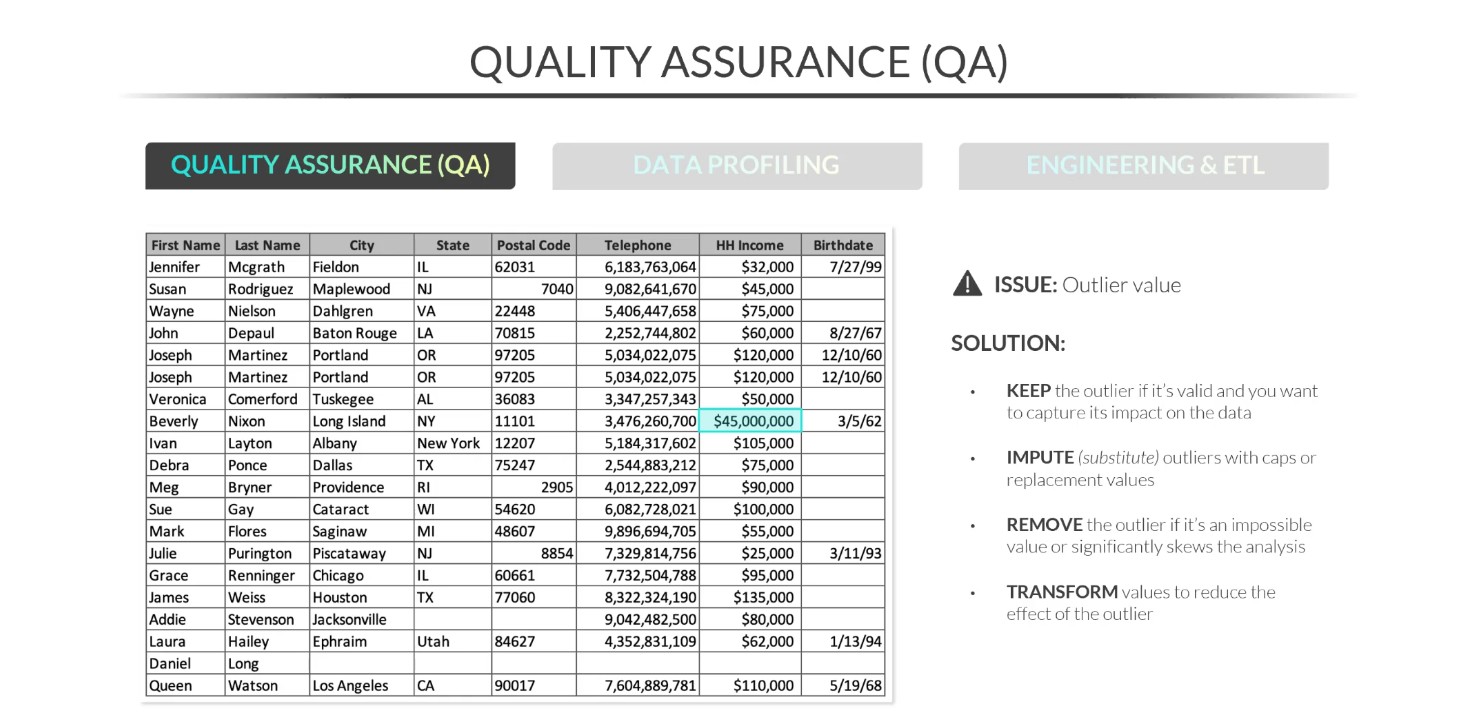
How do you handle a Outlier Value? Example $45,000, $75,000, and $45,000,000. [45 million seems off, and is the Outlier]
See attached.
Keep
Impute (substitute)
Remove
Transform or Winsorize the extreme data to reduce the effect of extreme values on the analysis.
Example: If we keep the outlier as is, then the average household income would be $2,400,000, does that sound right? NO!!! Meaning the outlier needs to be investigated to determine action (delete, replace, etc.)
What is Data Profiling, and can you explain “Range, Mean, Median, Mode, and Percentile”?
Data profiling is using metrics like Count, Distinct Count, and Conditional count to profile a dataset and identify its characteristics such as range, mean, median, mode, and percentile. These metrics help understand data distribution and detect any anomalies or patterns in the dataset.
[See attachment]
![<p>Data profiling is using metrics like Count, Distinct Count, and Conditional count to profile a dataset and identify its characteristics such as range, mean, median, mode, and percentile. These metrics help understand data distribution and detect any anomalies or patterns in the dataset. </p><p>[See attachment]</p>](https://knowt-user-attachments.s3.amazonaws.com/6cd91814-c4fe-4675-81c9-7c74e385748f.jpg)
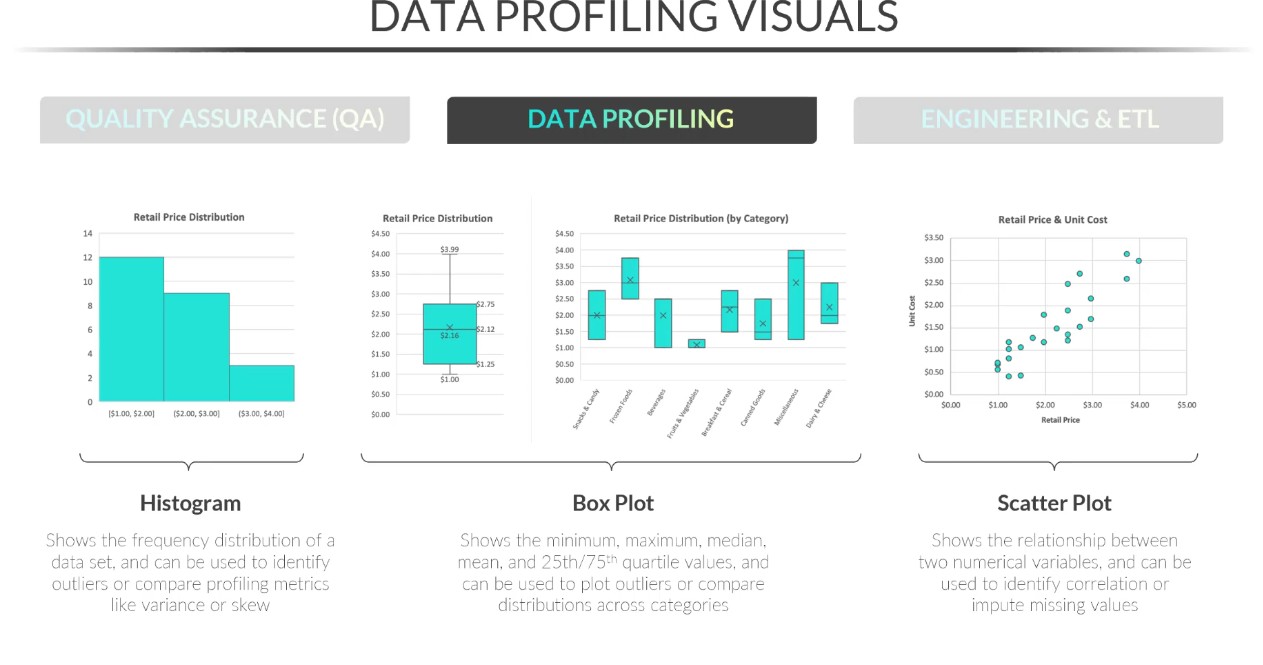
When visually profiling data, what is a Histogram, Box Plot, and Scatter Plot?
See attachment\
Histogram
Box Plot
Scatter Plot
What is ETL?
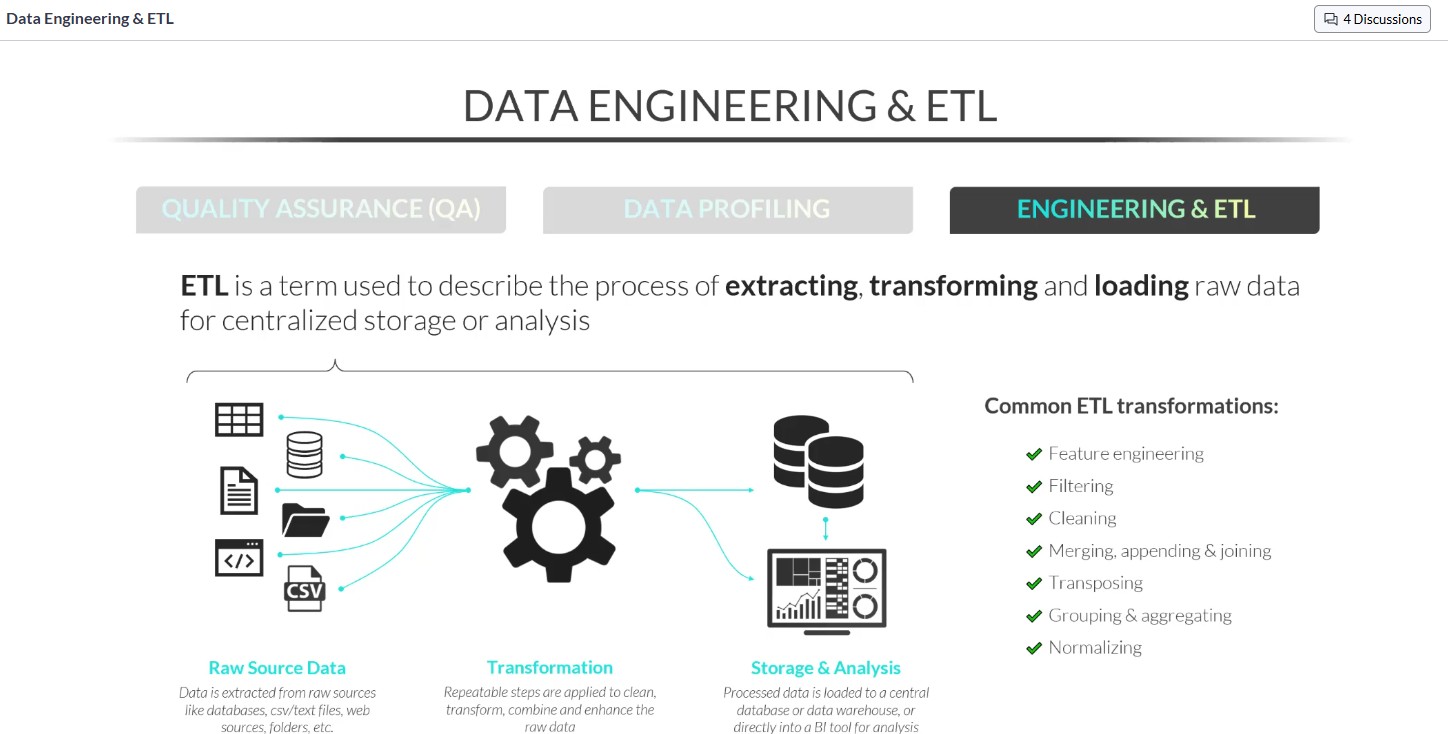
ETL is a term used to describe the process of Extracting, Transforming, and Loading raw data for centralized storage or analysis.
Taking raw disparate data sources.
Applying repeatable data transformation steps.
Then, consolidating them into a single data warehouse, repository, or BI Tool for analysis purposes.
[See attached]
![<p>ETL is a term used to describe the process of Extracting, Transforming, and Loading raw data for centralized storage or analysis.</p><p></p><ol><li><p>Taking raw disparate data sources.</p></li><li><p>Applying repeatable data transformation steps.</p></li><li><p>Then, consolidating them into a single data warehouse, repository, or BI Tool for analysis purposes.</p></li></ol><p>[See attached]</p><p></p><p></p><p></p>](https://knowt-user-attachments.s3.amazonaws.com/e40723b4-72f0-4cf6-a1c1-47dc620dfa3b.jpg)
What does SKU stand for and what is it?
A (SKU) “stock-keeping unit” is a label printed with a unique number and a scannable bar code, used by retailers to keep track of their inventory.
It helps identify specific products, manage stock levels, and streamline inventory management.
[See attachment]
![<p><span>A </span>(SKU) “<span>stock-keeping unit” is a </span><strong><em>label printed with a unique number and a scannable bar code</em></strong><span>, used by retailers to keep track of their inventory.</span></p><p></p><p><span>It helps identify specific products, manage stock levels, and streamline inventory management. </span></p><p><span>[See attachment]</span></p>](https://knowt-user-attachments.s3.amazonaws.com/f1dfb9bf-2f35-499d-a11e-f1f01d43179b.jpg)
What are the places data can be Extracted Transformed and Loaded from (ETL).
ETL source categories
Flat files: CSV, TSV, Excel, JSON, XML, Parquet
File storage: local folders, NFS, SFTP, HDFS, S3, Azure Blob, GCS
Relational databases: Oracle, SQL Server, MySQL, PostgreSQL, DB2
NoSQL databases: MongoDB, Cassandra, DynamoDB, HBase, Couchbase
Cloud warehouses: Snowflake, BigQuery, Redshift, Synapse
SaaS & business apps: Salesforce, Netsuite, Workday, ServiceNow, Jira
Streaming & messaging: Kafka, Kinesis, Event Hubs, RabbitMQ, MQTT
Logs & observability: Syslog, ELK, CloudWatch Logs, Prometheus
Web & public APIs: REST, SOAP, GraphQL, open-data portals
IoT & edge: OPC-UA gateways, time-series brokers
Batch drops: Email attachments, FTP nightly dumps
In the transform step of ETL, what is the term for making every value in a State column use the same format (all full names or all two-letter codes)?
Standardization.