Lecture 6(1) - Momentum & Volume Indicators
1/55
There's no tags or description
Looks like no tags are added yet.
Name | Mastery | Learn | Test | Matching | Spaced |
|---|
No study sessions yet.
56 Terms
Volume
Amount of shares/contracts traded over a specified period and is portrayed as a vertical bar below the price bar
High volume _____in the direction of the trend
should go
Volume not going with the trend is a ________
warning of impending trend reversal
Exceptionally high volume is a signal of an ________ _________
important change
When prices are rising/declining:
Volume increasing in confirming
Volume decreasing is questionable
When a price advance halts with high volume, it is a potential ____
top
When a price decline halts with high volume, it is a potential _______
bottom
Volume displays the _____ of a move in price
intensity
Methods for Analyzing Volume confirmation
Volume indexes
On Balance Volume
AD - Accumulation/Distribution Index
Volume Related Oscillators
Volume Oscillator
Chaikin Money Flow
Volume Spikes
Volume Indexes
Comprised of cumulative sums of data measuring supply and demand over time, rather than a specific period
Do not have an upper/lower bound
Compare price with the index looking for divergences between highs and lows in each
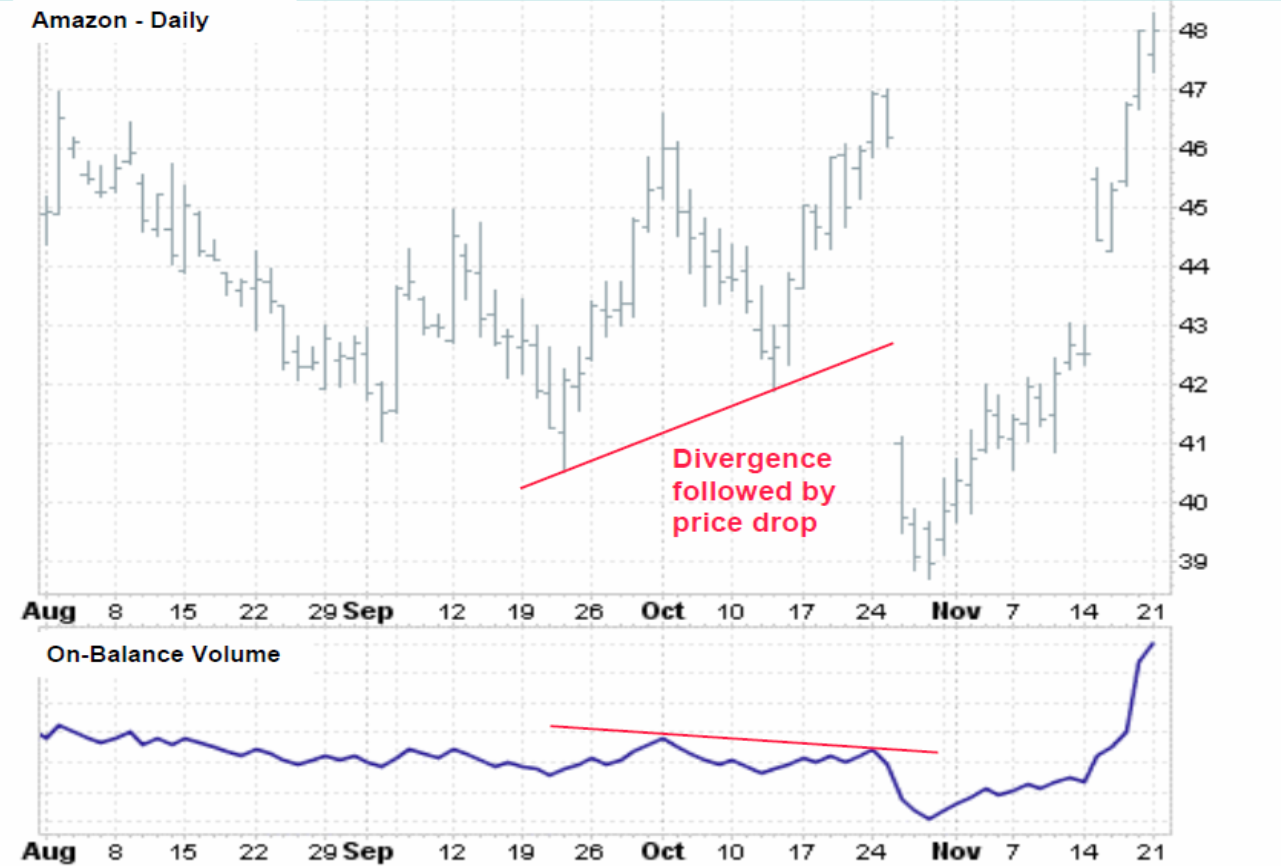
On Balance Volume
Cumulative index of plus or minus volume days based on change of closing prices
Volume based indicator that tracks buying and selling pressure, maintaining cumulative totals, goes up on up days, and down on down days
High Volume should confirm price trend, therefore compare price to OBV
Negative divergence between price and OBV ________
warns of a potential price reversal
Negative Divergence Graph
Accumulation/Distribution Index formula
Volume x [(close - low) - (High - close)]
(High/low)
A/D Index
Uses a more specific calculation to calculate the midpoint for the day’s volume
If close occurs above the midpoint for the day, the result is positive
This one has an adjustment factor
Volume Related Oscillators
Oscillates between an upper and lower bound
A move to high upper bound level creates an “overbought” condition
A move to a lower bound level produces an “oversold” condition
Bounded
Used for divergence analysis, trend lines, sometimes pattern analysis → more useful for trading range markets
Volume Oscillator
Ratio between 2 moving averages of volume and is used to determine when volume is expanding or contracting
Expanding volume implies strength in the trend, contracting volume implies weakness in trend
Useful for confirming trend and for giving advanced warning in a trading range of direction for next breakout
Chaikin Money Flow
Uses A/D calculation for each day
Calculated by summing ADs over the past 21 days and dividing that sum by the total volume over the past 21 days
This produces an oscillator that rises above zero when upward trend (buying pressure) begins and declines below zero (selling pressure) when the trend turns downward
Volume-related oscillator
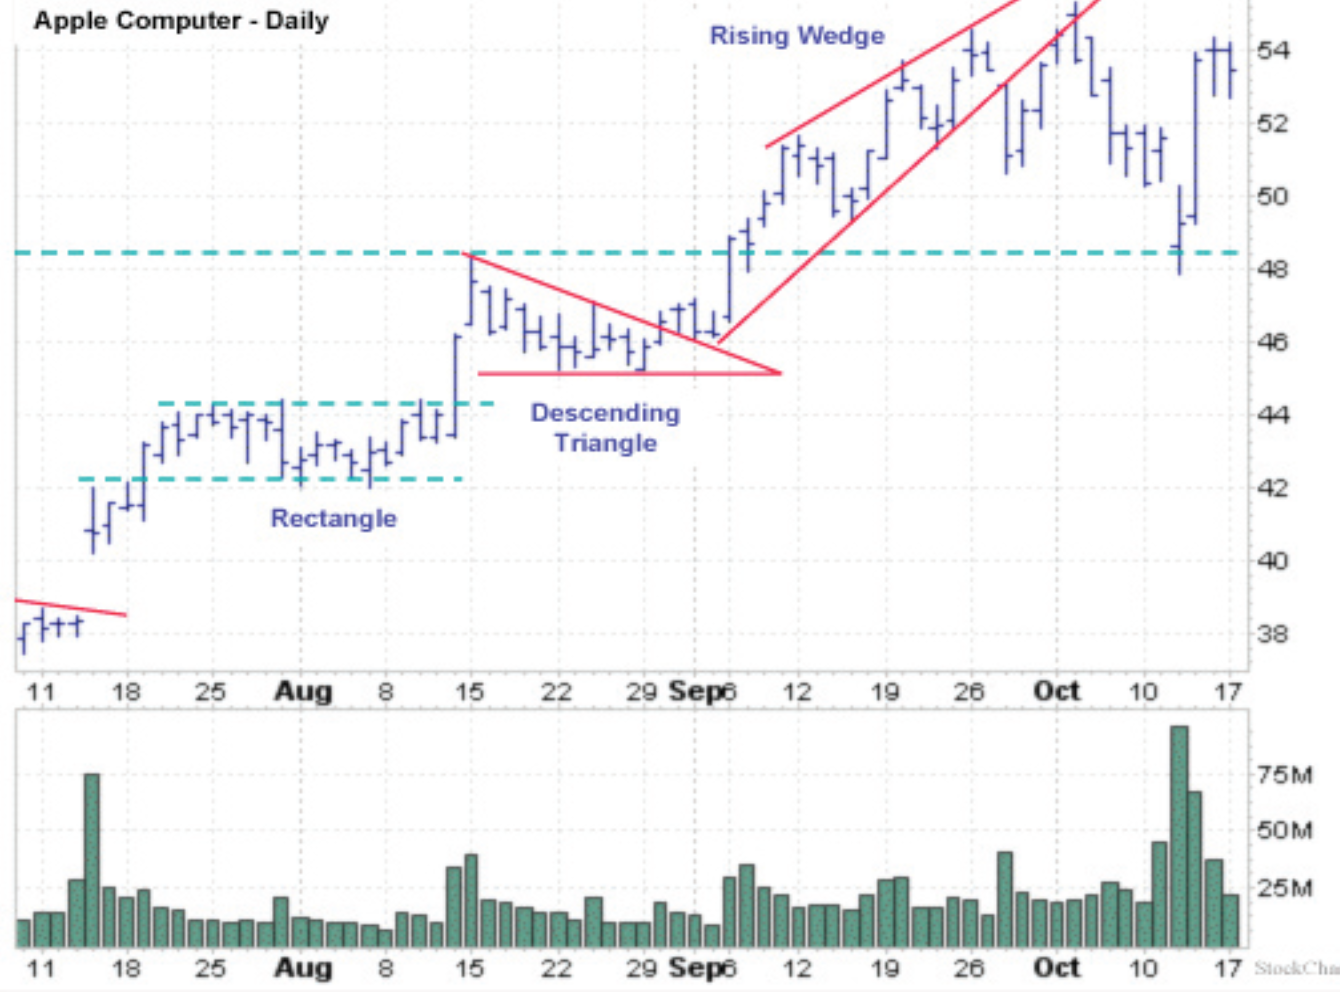
Volume Spikes
Usually a test of a significant support/resistance level
Sign of a sudden change in information (gap) or other pattern breakout
Most common at the beginning and end of a trend
Volume Spike graph
Momentum
Measure of the velocity of price movements, rather than price movements themselves
Rate of change of price measures how quickly prices are rising or how steeply the trend line is sloping
Types of momentum indicators
Rate of Change (ROC)
Moving Average Convergence Divergence (MACD)
Stochastic
Relative Strength Index (RSI)
Momentum oscillators work in these ways:
Oscillate between an upper and lower bound so a move to high upper bound level creates an “overbought” condition, and a move to a lower bound level produces an “oversold” condition
To indicate divergences between momentum and price trend and as a result gives indication to price trend change
Crossing of 0 or midpoint line can give you signals of trend change
Negative Divergence
Price hits a higher high, momentum oscillator hits a lower high
Positive Divergence
Price hits a lower low, but momentum oscillator hits a higher low
Overbought
When prices are noticeably above the central trend, and hit the upper boundary level of a momentum oscillator
Oversold
When prices are noticeably below the central trend, and hit the lower boundary level of a momentum oscillator
MACD - Moving Average Convergence Divergence
Uses 2 lines: MACD and signal line
Uses the 9, 12, 26 period EMAs
MACD line is calculated by finding the difference between two exponential moving averages (EMAs) of closing prices: the last 26 and 12 periods
Signal line is the 9 period EMA of MACD line
When MACD is above 0 line, (short term EMA > long term EMA), it suggests an upward trend
How is the MACD line calculated?
By finding the difference between two exponential moving averages (EMAs) of closing prices - the last 26 and 12 periods
How is the signal line (in MACD) calculated?
Find the 9 period EMA of the MACD line
Histogram is the difference between:
the MACD and its signal line
MACD is useful in trending markets because it is
unbounded
MACD Buy Signal
When the MACD line crosses the signal line from below and both lines are below the 0 zone. Best buy signals occur below the 0 zone
MACD Sell Signal
When the MACD line crosses the signal line from above and above the 0 zone
Overbought indicator in MACD
When lines are far above the 0 line
Oversold indicator in MACD
When lines are far below the 0 line
ROC - Rate of Change
Measures the amount a stock price has changed over a given number (N) of past periods
Price today - Price N periods ago x 100
Price N periods ago
Buy signal in ROC
When ROC crosses the 0 line from below
Sell signal in ROC
When ROC goes lower from above overbought level
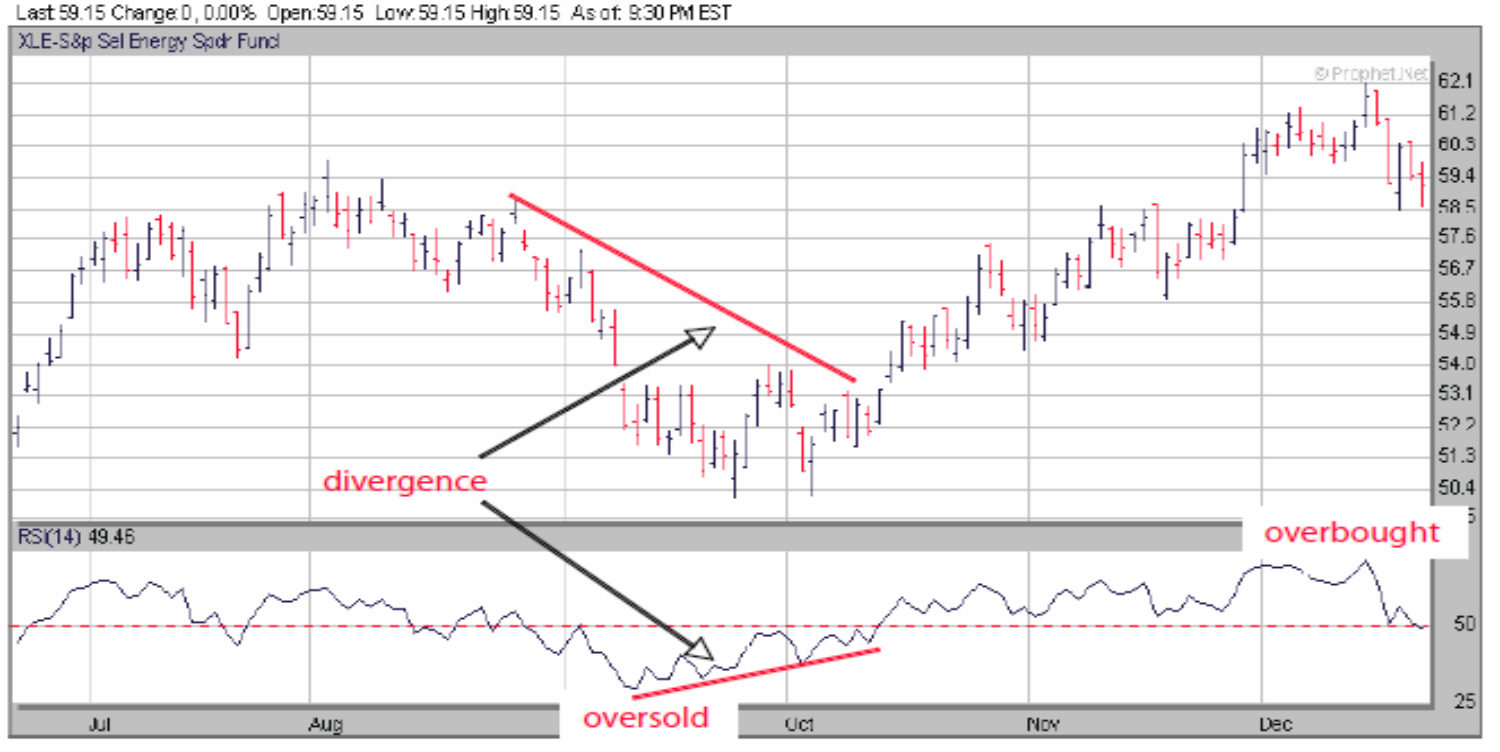
RSI - Relative Strength Index
Measures a security’s price strength relative to its own past price history
Bounded by the range of 0-100
RSI = 100 - 100
1 + RS
where RS = Average of x day’s up closes
Average of x day’s down closes
Overbought RSI indicator
Above 70
Oversold RSI indicator
Below 30
RSI in bear and bull markets
Bull Market: above 50, ranges from 55-85
Bear Market: 25-60
Top Failure Swing
When a peak in RSI over 70 fails to exceed a previous peak in an uptrend (may signal a top) - RSI forms an “M” with the second peak a lower high
Bottom Failure Swing - RSI
When RSI is in a down trend (under 30), fails to set a new low and when proceeds to exceed a previous peak (may signal a bottom) - RSI forms a “W” with the second trough a higher low
RSI divergence graph
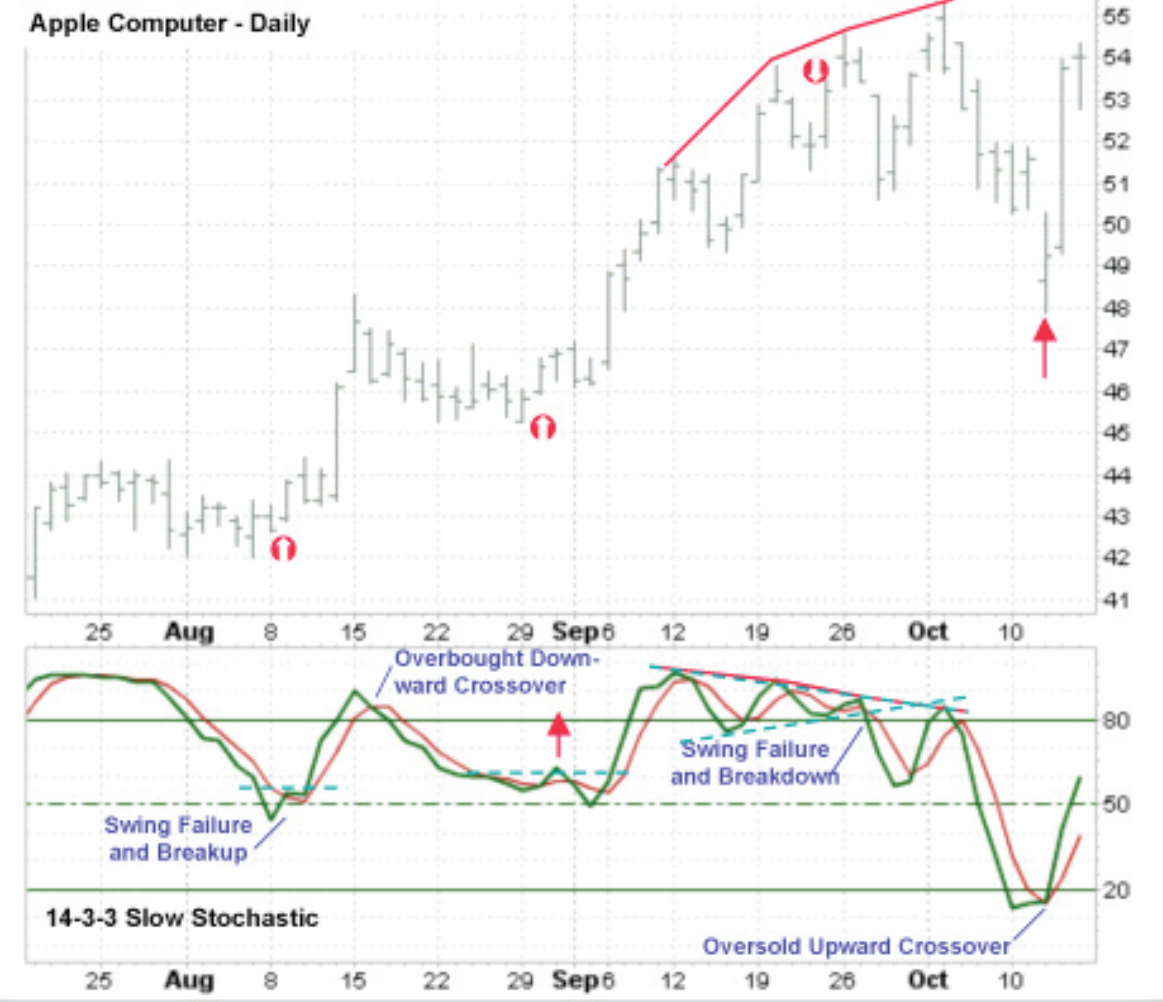
Stochastic Oscillator
As prices increase, prices tend to be at the upper end of the price range, and in down trends, price tends to be near the lower end of the range
Measures current closing price versus defined past findow of prices
Stochastic Oscillator Equation
%K = 100 x (Close - Low)
(High - Low)
Fast %D - Fast Stochastics
3 period SMA of the %K line
Slow %D - Slow Stochastics
3 period SMA of the %D line
Using Stochastics in the Overbought/Oversold
Bounded from 0-100
Overbought: Above 80
Oversold: Below 20
Using Stochastics in the trending markets
Divergences
Pattern recognition - trend line breaks, triangles
Failure swings
Using Stochastics in the Trading range markets
Crossovers
Failure swings
Overbought/oversold
Using Stochastics in the Failure Swings: Top Failure Swing
When a peak in stochastic over 80 fails to exceed a previous peak in an uptrend
Using Stochastics in the Failure Swings: Bottom Failure Swing
When stochastic is in a down trend (under 20) fails to set a new low and then proceeds to exceed a previous peak
Stochastic graph