Ecology CH 1-6
 Call Kai
 Learn
Learn Practice Test
 Spaced Repetition
 Match
Match Flashcards
 Knowt Play
1/24

There's no tags or description
Looks like no tags are added yet.
Name | Mastery | Learn | Test | Matching | Spaced | Call with Kai | Chat |
|---|
No analytics yet
Send a link to your students to track their progress
25 Terms
Ecology
scientific study of the interactions that determine the abundance (how many) and distribution (where) of living things.
Biotic
Interactions between living things (e.g., predation, competition, mutualism).
Abiotic
The physical, non-living environment (e.g., temperature, salinity, disturbance)
Conditions necessary for natural selection to occur?
Variation: Individuals in a population vary in their traits (i.e., there are different phenotypes).
Heritability: Variation in traits is heritable (i.e., differences in phenotypes among individuals are due to differences in genotype).
Differential Fitness: Trait variation results in differences in fitness (survival and reproduction) among individuals.
Evolution
Genetic change in a population over time.
Fitness
genetic contribution of an organism’s descendants to future generations. This is determined by an organism's survival and reproduction.
Adaptation
As a trait: A genetically based characteristic of an organism that improves its ability to survive or reproduce within its environment.
As a process: The process of evolution that leads to an adaptive trait becoming more common in a population.
Individual
A single organism. Individuals differ in traits and fitness, and they survive and reproduce. (Crucial note: Individuals do NOT adapt or evolve; only populations do).
Population
A group of individuals of the same species in a given area. Natural selection operates on individuals, but the outcome affects the genetic makeup (allele frequencies) of the population over generations.
4 different mechanisms of evolution?
Mutation: New genes/alleles arising.
Gene Flow: Dispersal of genes between populations.
Genetic Drift: Changes in allele frequencies due to random chance.
Natural Selection: Adaptation to the environment (non-random).

Interpret mouse experiment graph
X-axis: Shows time over the 14 months.
Bars: Show the total number of mice alive. If the bars get shorter, there are fewer mice because some are being eaten by predators.
Lines: Show the percentage of mice that do not match their habitat. If the line goes down, it means mismatched mice are being eaten more often, so mice that blend in with their habitat are more likely to survive.
How does the Silver Fox experiment show artificial selection? How does it differ from natural selection?
How it shows artificial selection: Scientists chose the tame foxes to breed. They kept doing this for 45 generations, and eventually almost 100% of the foxes were extremely friendly. This shows that tameness can be passed down through genes and that humans can change a trait by choosing which animals reproduce.
How it is different from natural selection: With artificial selection, humans choose which animals reproduce. With natural selection, the environment does the selecting—animals with traits that help them survive and reproduce are more likely to pass those traits on.

How does warm air create rain
Warm air is less dense than cool air → warm air rises
Physical Principle: Gases expand when heated, decreasing density
As air rises, atmospheric pressure decreases → rising air expands
Physical Principle: Atmospheric pressure decreases with altitude
Expanding air cools → condensation occurs → rain forms
Physical Principle: When air expands, it cools; cool air can't hold as much moisture
When the sun heats air at Earth's surface, the warm air becomes less dense and rises. As it rises to higher altitudes where pressure is lower, the air expands. This expansion causes the air to cool down. Cool air can't hold as much water vapor, so the moisture condenses into clouds and eventually falls as rain.
What Drives Global Patterns of Precipitation and Temperature?
Equator: Gets the most solar energy because sunlight hits more directly → warmer.
Poles: Sunlight hits at an angle and spreads out → less energy + colder.
Earth’s tilt: Causes seasons by changing the angle of sunlight.
Unequal heating creates temperature differences → air movement → atmospheric circulation.

Draw and explain Hadley Cells, wind patterns, high and low pressure zones, and water currents
☀ Equator: Most solar energy → warm, moist air rises → low pressure + lots of rain.
🌧 ~30° N/S: Air cools and sinks → high pressure + dry weather/deserts.
💨 Surface winds: Air moves from high → low pressure, creating trade winds. Earth’s rotation curves the winds (Coriolis effect).
🌎 Cells: Hadley → Ferrel → Polar cells move heat around Earth.
🌊 Ocean currents: Winds push surface water, moving heat around the planet.
Sun → air movement → pressure → winds → ocean currents → heat distribution
Explain how proximity to the ocean and mountains modify climate on a local scale
🌊 Ocean: Moderates temperature and provides moisture → milder, wetter climate.
🌬 Trade winds: Carry moist air from the ocean toward the islands.
⛰ Mountains: Force moist air upward → air cools → rain falls on the windward side.
☀ Leeward side: Air sinks and warms → drier, less rainfall (rain shadow).
Distribution of biomes on earth
Climate affects organisms: Things like temperature and rainfall create the climate of a region. This climate puts pressure on organisms to survive.
Natural selection shapes biomes: Organisms with traits that help them survive the climate are more likely to survive and reproduce. Over time, these traits become common and help create the plants and animals found in a biome.
Convergent evolution: Different species can develop similar traits if they live in similar climates, even if they aren't closely related.
Example: Cacti in the Americas and euphorbs in Africa both developed thick, water-storing stems and spines because they live in dry environments.
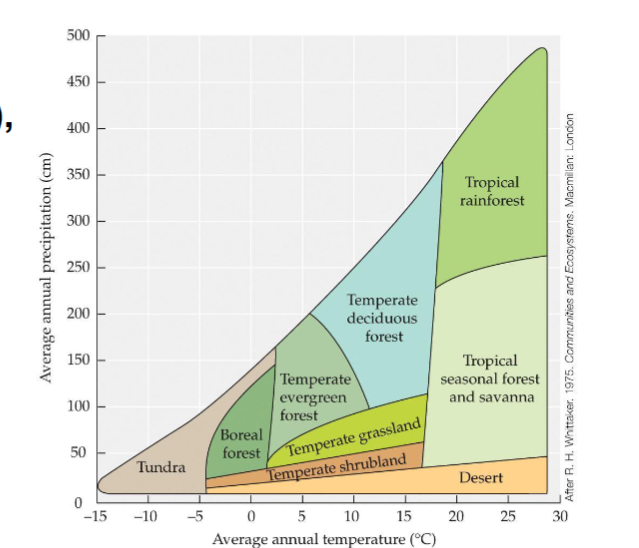
Interpret this figure showing biomes in climate space
Biomes can be mapped on a 2D graph using average annual temperature (usually on the x-axis) and average annual precipitation (usually on the y-axis).
Examples from the graph:
Tropical rainforests are found in the "warmest, wettest" quadrant of this climate space.
Boreal forests are found in areas with average annual temperatures near freezing and more than 50 cm of precipitation per year.

Interpret and draw your own climate diagrams
Red line: Average monthly temperature.
Blue line: Average monthly precipitation.
Tan area (Drought): If the red temperature line is higher than the blue precipitation line, conditions are too dry for plant growth.
Blue area (Freezing): If the temperature drops below 0°C, water freezes and plants cannot grow.
Explain how changes in elevation on a mountain are similar to global patterns in biomes
Going higher up a mountain is similar to traveling toward the poles.
As elevation increases, the temperature gets colder.
Higher elevations can also have more rainfall.
Because the top of a mountain is cold, its plants and animals are similar to those found in the tundra near the poles.
What drives biological zones in the ocean
Temperature
Salinity
Light (determines where photosynthesis can occur)
Depth (which correlates with water pressure)
Stability of substrate (e.g., whether the bottom is sand or rock)
Proximity to shore (which influences tides, waves, shoreline topography, and freshwater/sediment input from land)
Why Hawaii has such a wide diversity of biomes
Trade winds: Winds carry moist air from the ocean toward land.
Mountains: Mountains force the moist air to rise.
Windward side: As the air rises, it cools and drops rain, creating wet, green areas like rainforests.
Leeward side: After losing most of its moisture, the air moves down the other side and becomes dry, creating a rain shadow with dry forests or deserts.
Understand the water potential gradient and how water flow
Water moves from higher water potential (less negative, fewer solutes) to lower water potential (more negative, more solutes).
More solutes → lower water potential → water moves toward it.
In plants, water moves continuously from soil → roots → stem → leaves → atmosphere.
Example gradient: 0 (pure water) → -0.5 (soil) → -0.7 (root) → -0.8 (stem) → -1.0 (leaf) → -2.7 (humid air).
Takeaway: Plants constantly lose water through transpiration and must pull more water from the soil to replace it.
Understand the costs and benefits of different photosynthesis strategies and how they depend on the physical environment and translate into patterns of distribution and abundance on Earth

Be able to integrate and explain the concepts of performance curve and the niche and how this translates into the distribution and abundance of organisms.
Natural selection: The environment creates selection pressures, so organisms adapt to their conditions.
Performance curve: Shows how well an organism performs across an environmental gradient.
X-axis: Environmental condition (e.g., temperature, moisture)
Y-axis: Physiological performance/fitness
Minimum = lowest tolerable condition
Optimum = highest performance
Maximum = highest tolerable condition
Niche: The range of environmental conditions where a species can survive, grow, and reproduce.
Distribution: Organisms are most abundant where conditions are near their optimum and cannot survive outside their limits.