PSY 21500: Exam 3 [Ch 8-12]
1/32
There's no tags or description
Looks like no tags are added yet.
Name | Mastery | Learn | Test | Matching | Spaced | Call with Kai |
|---|
No analytics yet
Send a link to your students to track their progress
33 Terms
What circumstances would you use t-statistic for hypothesis testing, as opposed to a z-score?
When the St Dev (or variance) are not given —> Use T-statistic
(The T-stat substitutes the St-dev/variance with a corresponding sample value)
Recall:
St Deviation = √ (Variance)
Ratio Scale
Goes from 0 to infinity (but does not include any negative numbers)
(ie. 0, 1, 3, 4, 5, and beyond!)
Interval Scale
can have NO zero or can be negative
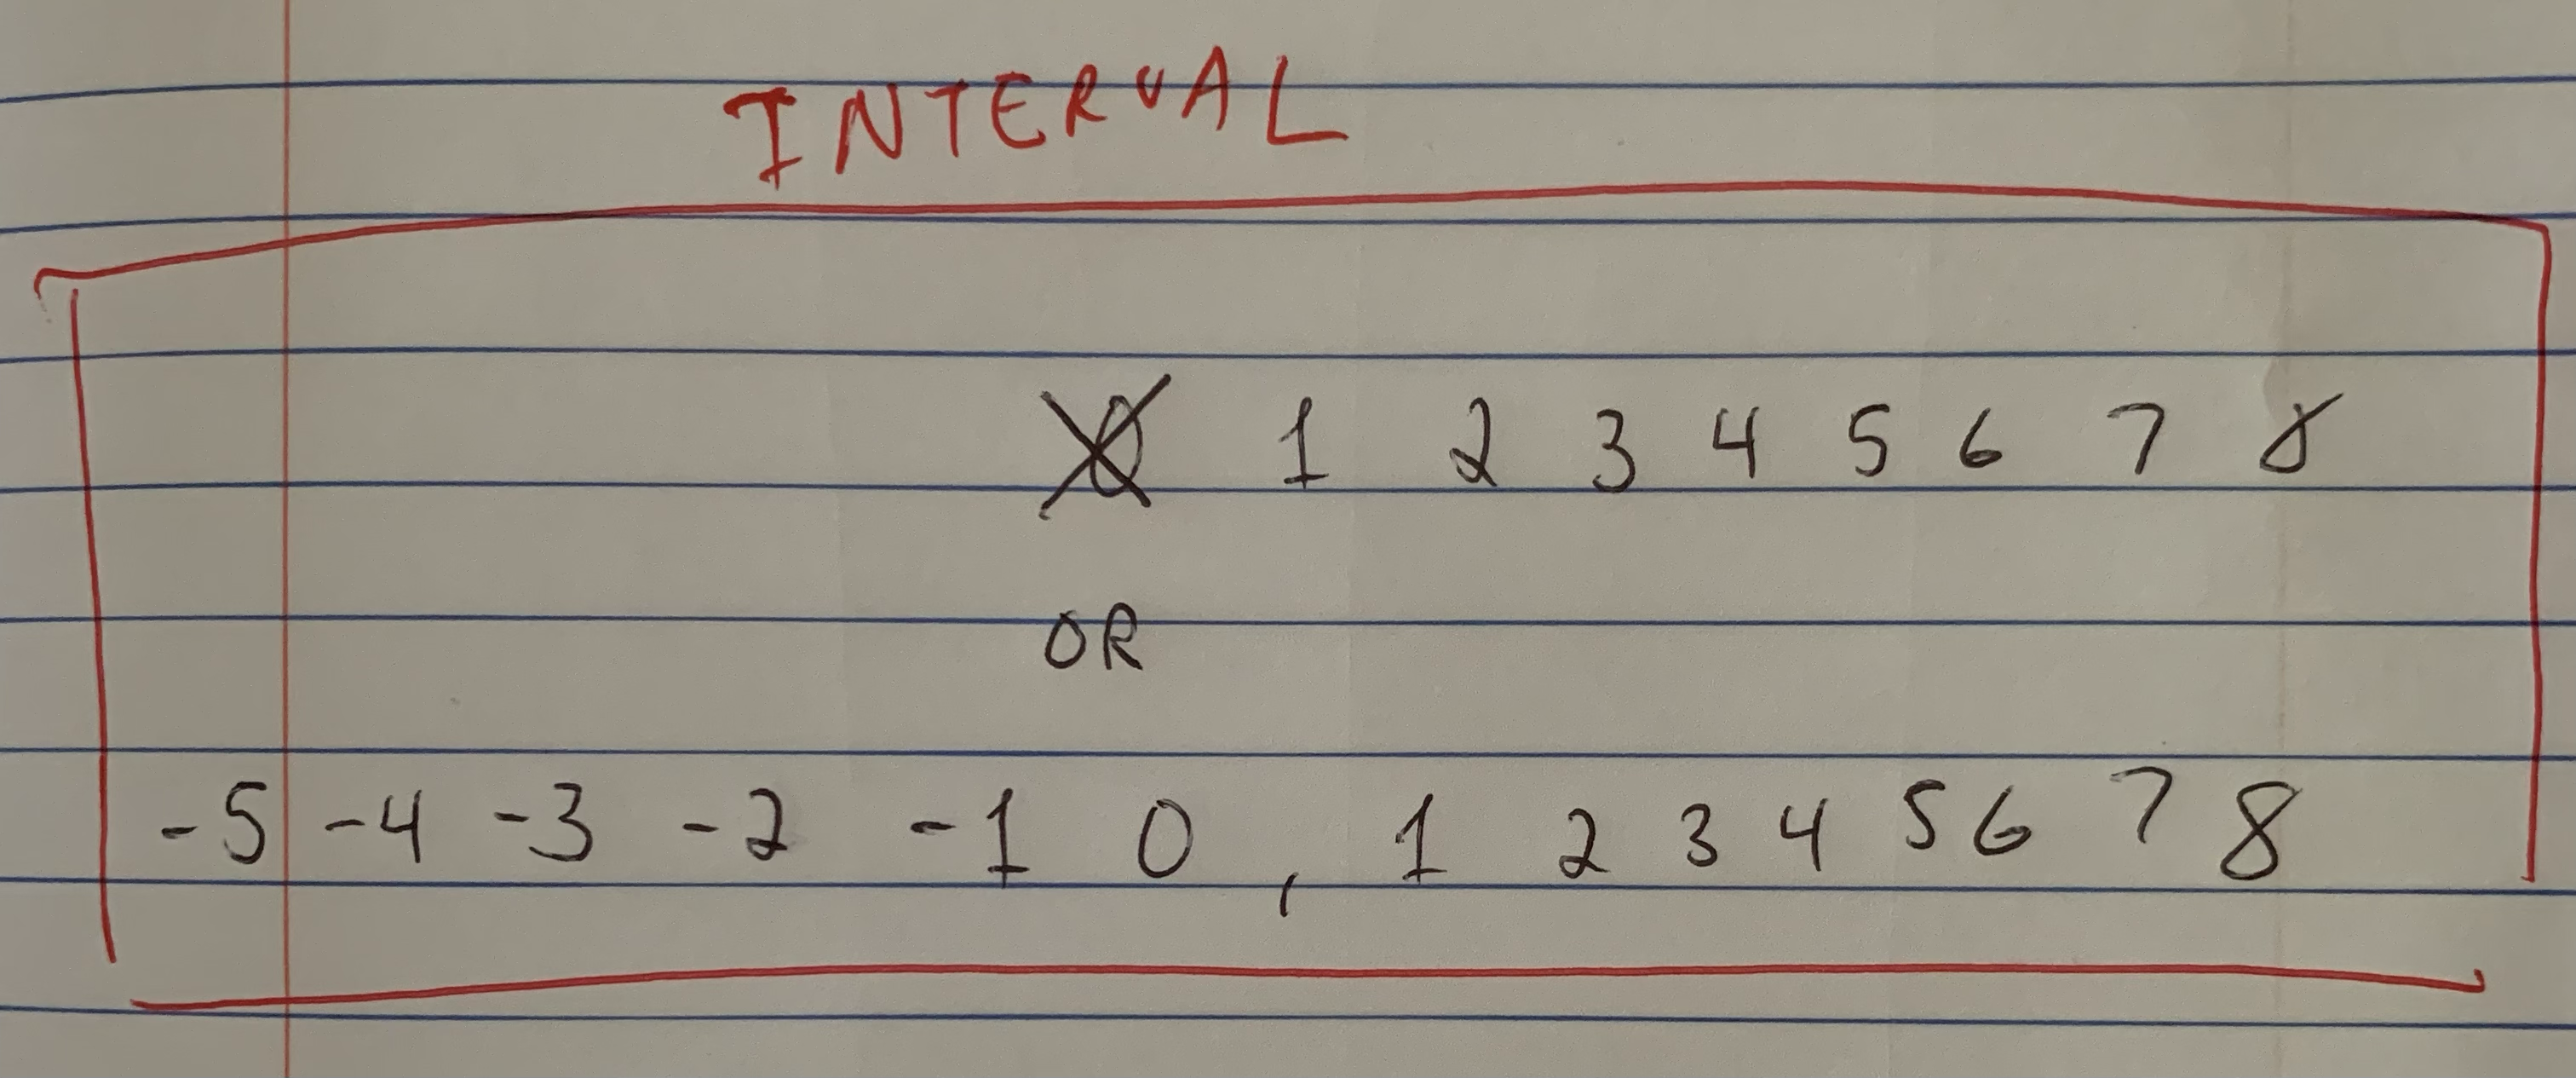
Interval Scale Examples
Interval (QUANT)
Temperature (F or C)
Times each day (in a 12 hour Clock)
(ie. 12:08 pm) - bc you cannot have zero O’clock
ANY STANDARDIZED TEST SCORES: Like the GRE (or SAT Scores)
Ratio Scale Examples
List out as many Examples as you can for Ratio Scales
Ratio (QUANT)
Kelvin (temp)
Driving Speed (cuz you can’t have a neg)
Age
Money
Weight
Number/Size of something tangible (eggs, or a house, sales figures)
Minutes/Hours of something
College GPA (scale of 0.00 to 4.00)
Formula for df-between
df-between = K - L
(Mnemonic: Beauty Kings)
Formula for df-within
df-within = N - K
(mnenomic: Will (Smith) Nike)
Factor is another way of saying….
The Independent Variable
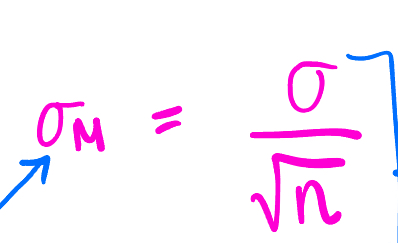
Standard Error (different from Sampling Error) + Equation
Measures how well the sample mean (M) approximates the population mean (μ). Its basically the equivalent of the st Dev (of the pop) but for the SAMPLE
What is the fundamental difference between a t-statistic and a z-score?
The t-statistic uses the SAMPLE variance in place of the population variance (this is why we use t-statistic, when such info is not available)
Sample Mean (M)
(for ch 7 stuff) Sample Mean (M) is basically the equivalent of the X-scores (but just for the sample distribution table.
For instance, if asked to find what proportion of all sample means has values greater than 7? basically ..
1) use this equation Z = M - μ /σn
2) Use Normal Table Appx B
What is the relationship between a t-distribution and a normal (z) distribution?
Both have bell shaped curves.
While t-distribution is defined by degrees of freedom, Z-curves are not.
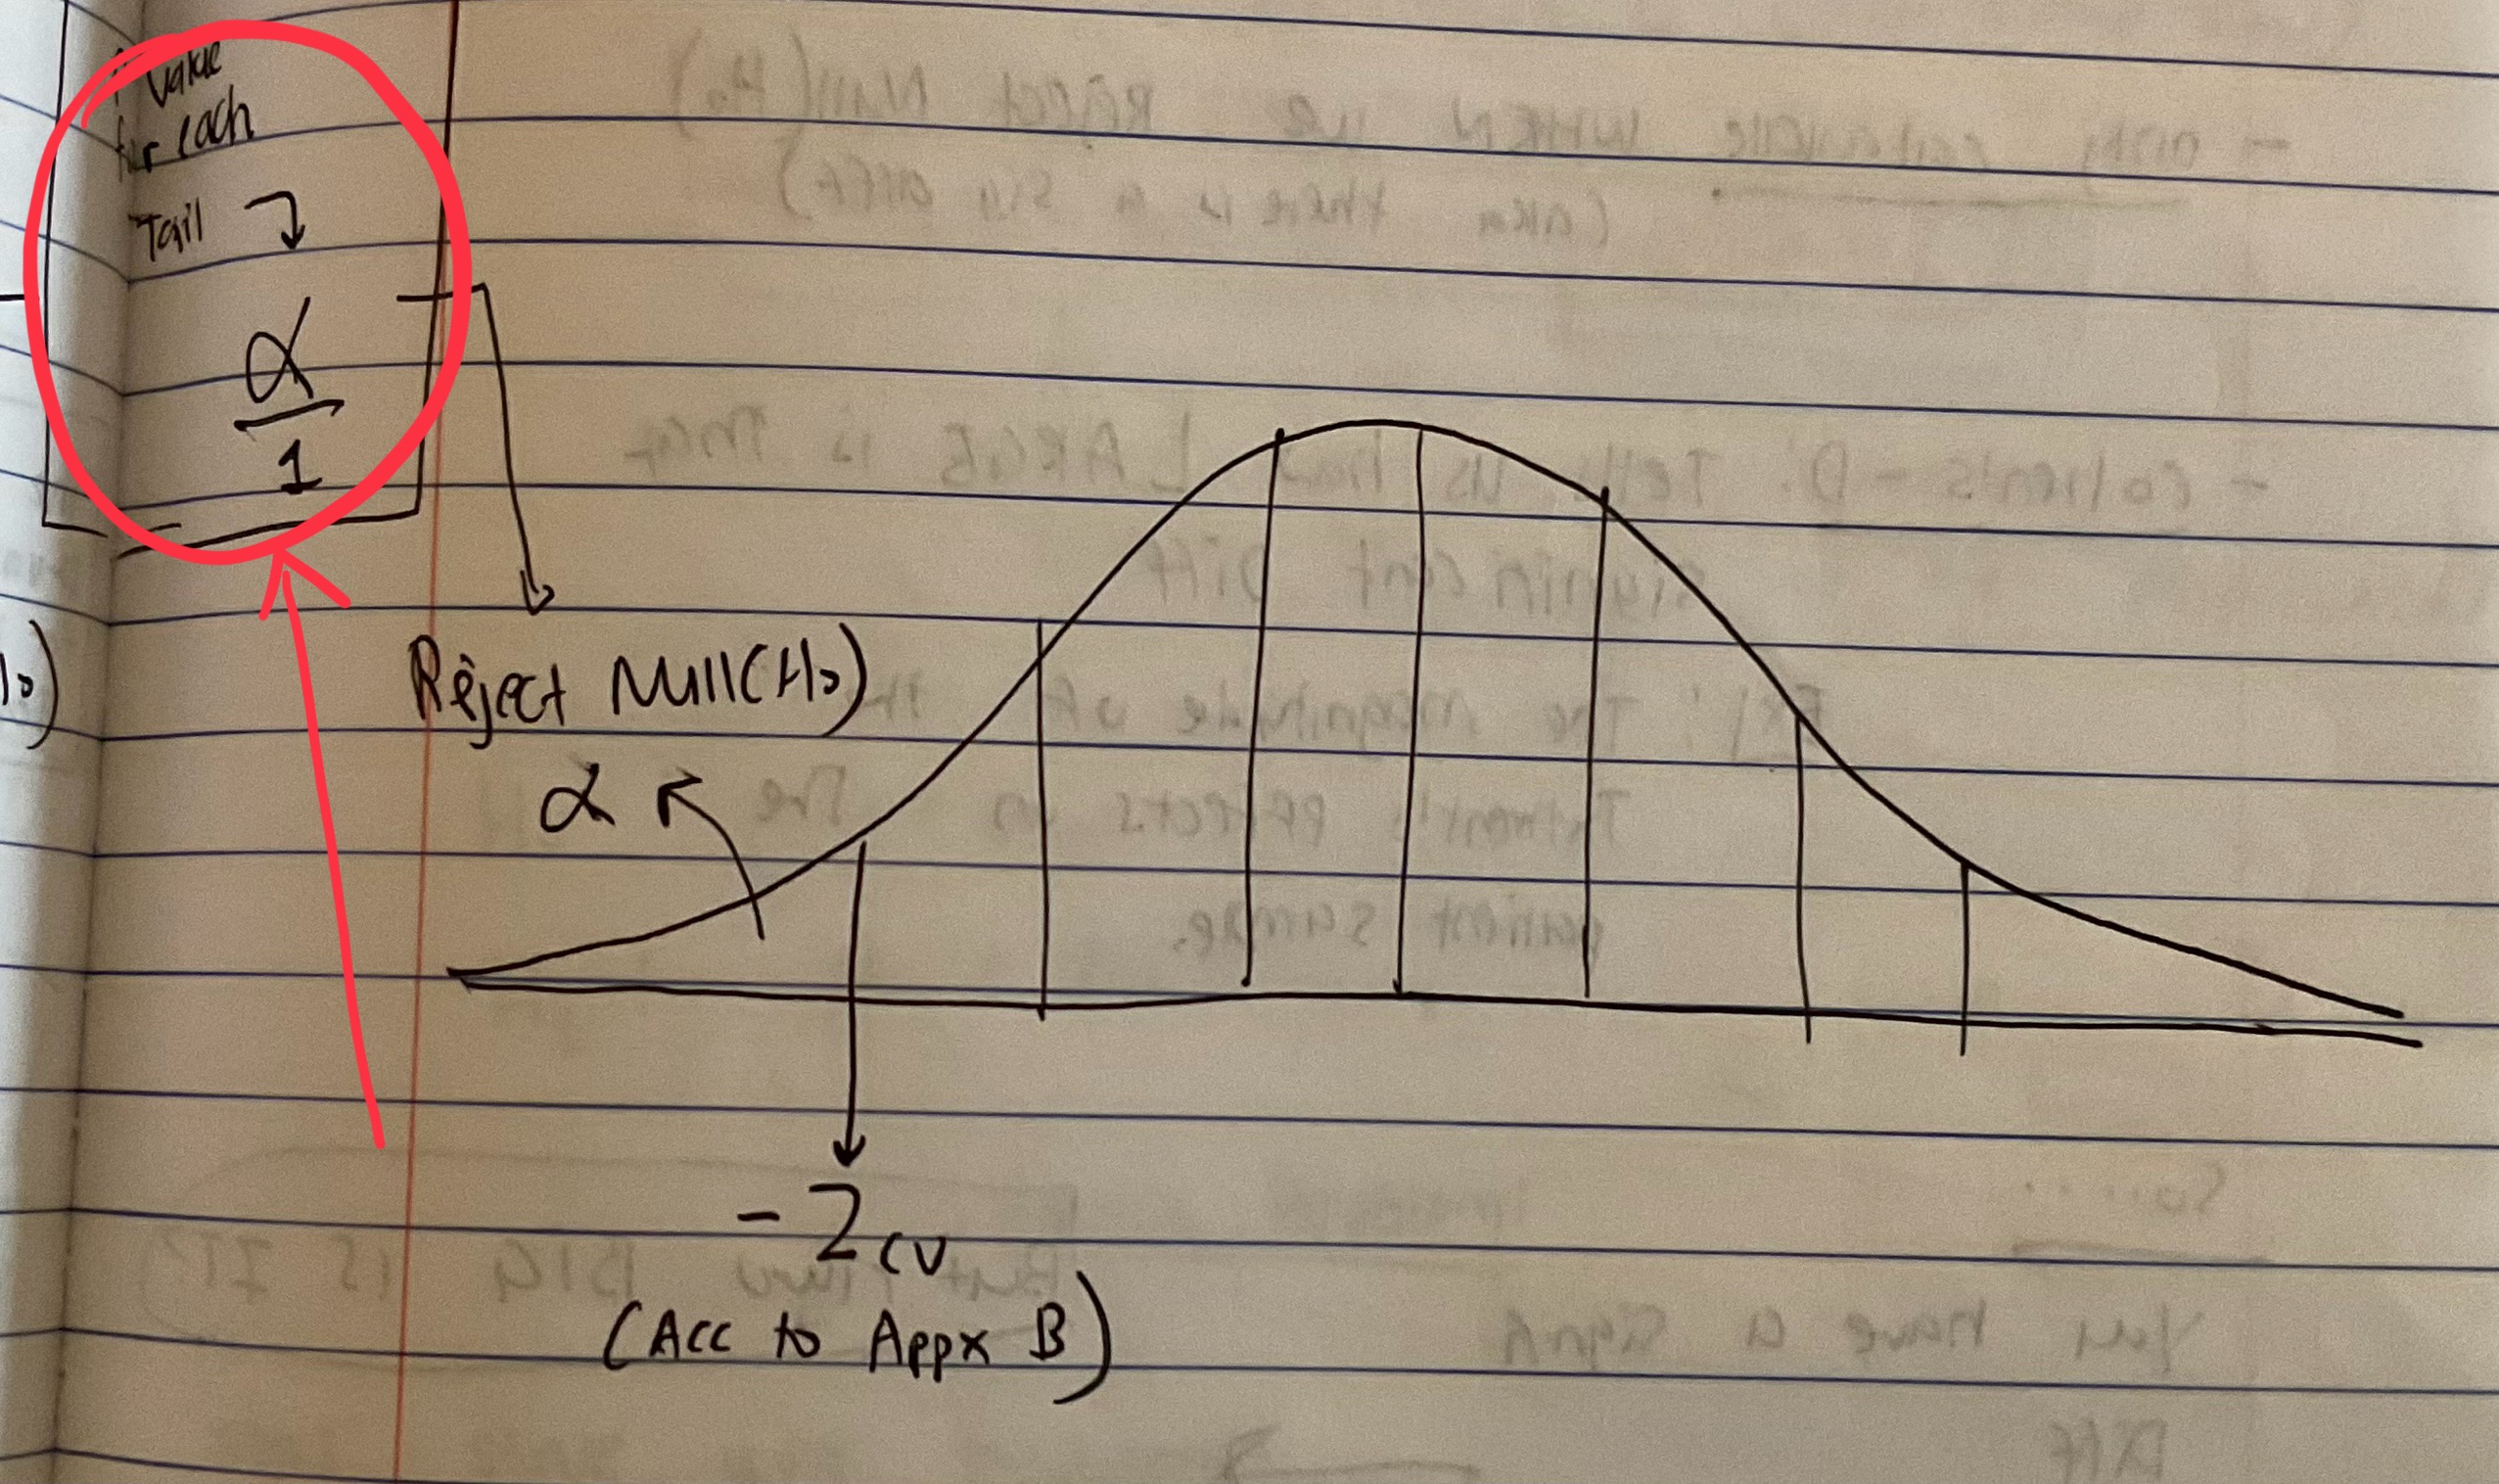
p-value for a 1-tailed Test
(based on Alpha Value)
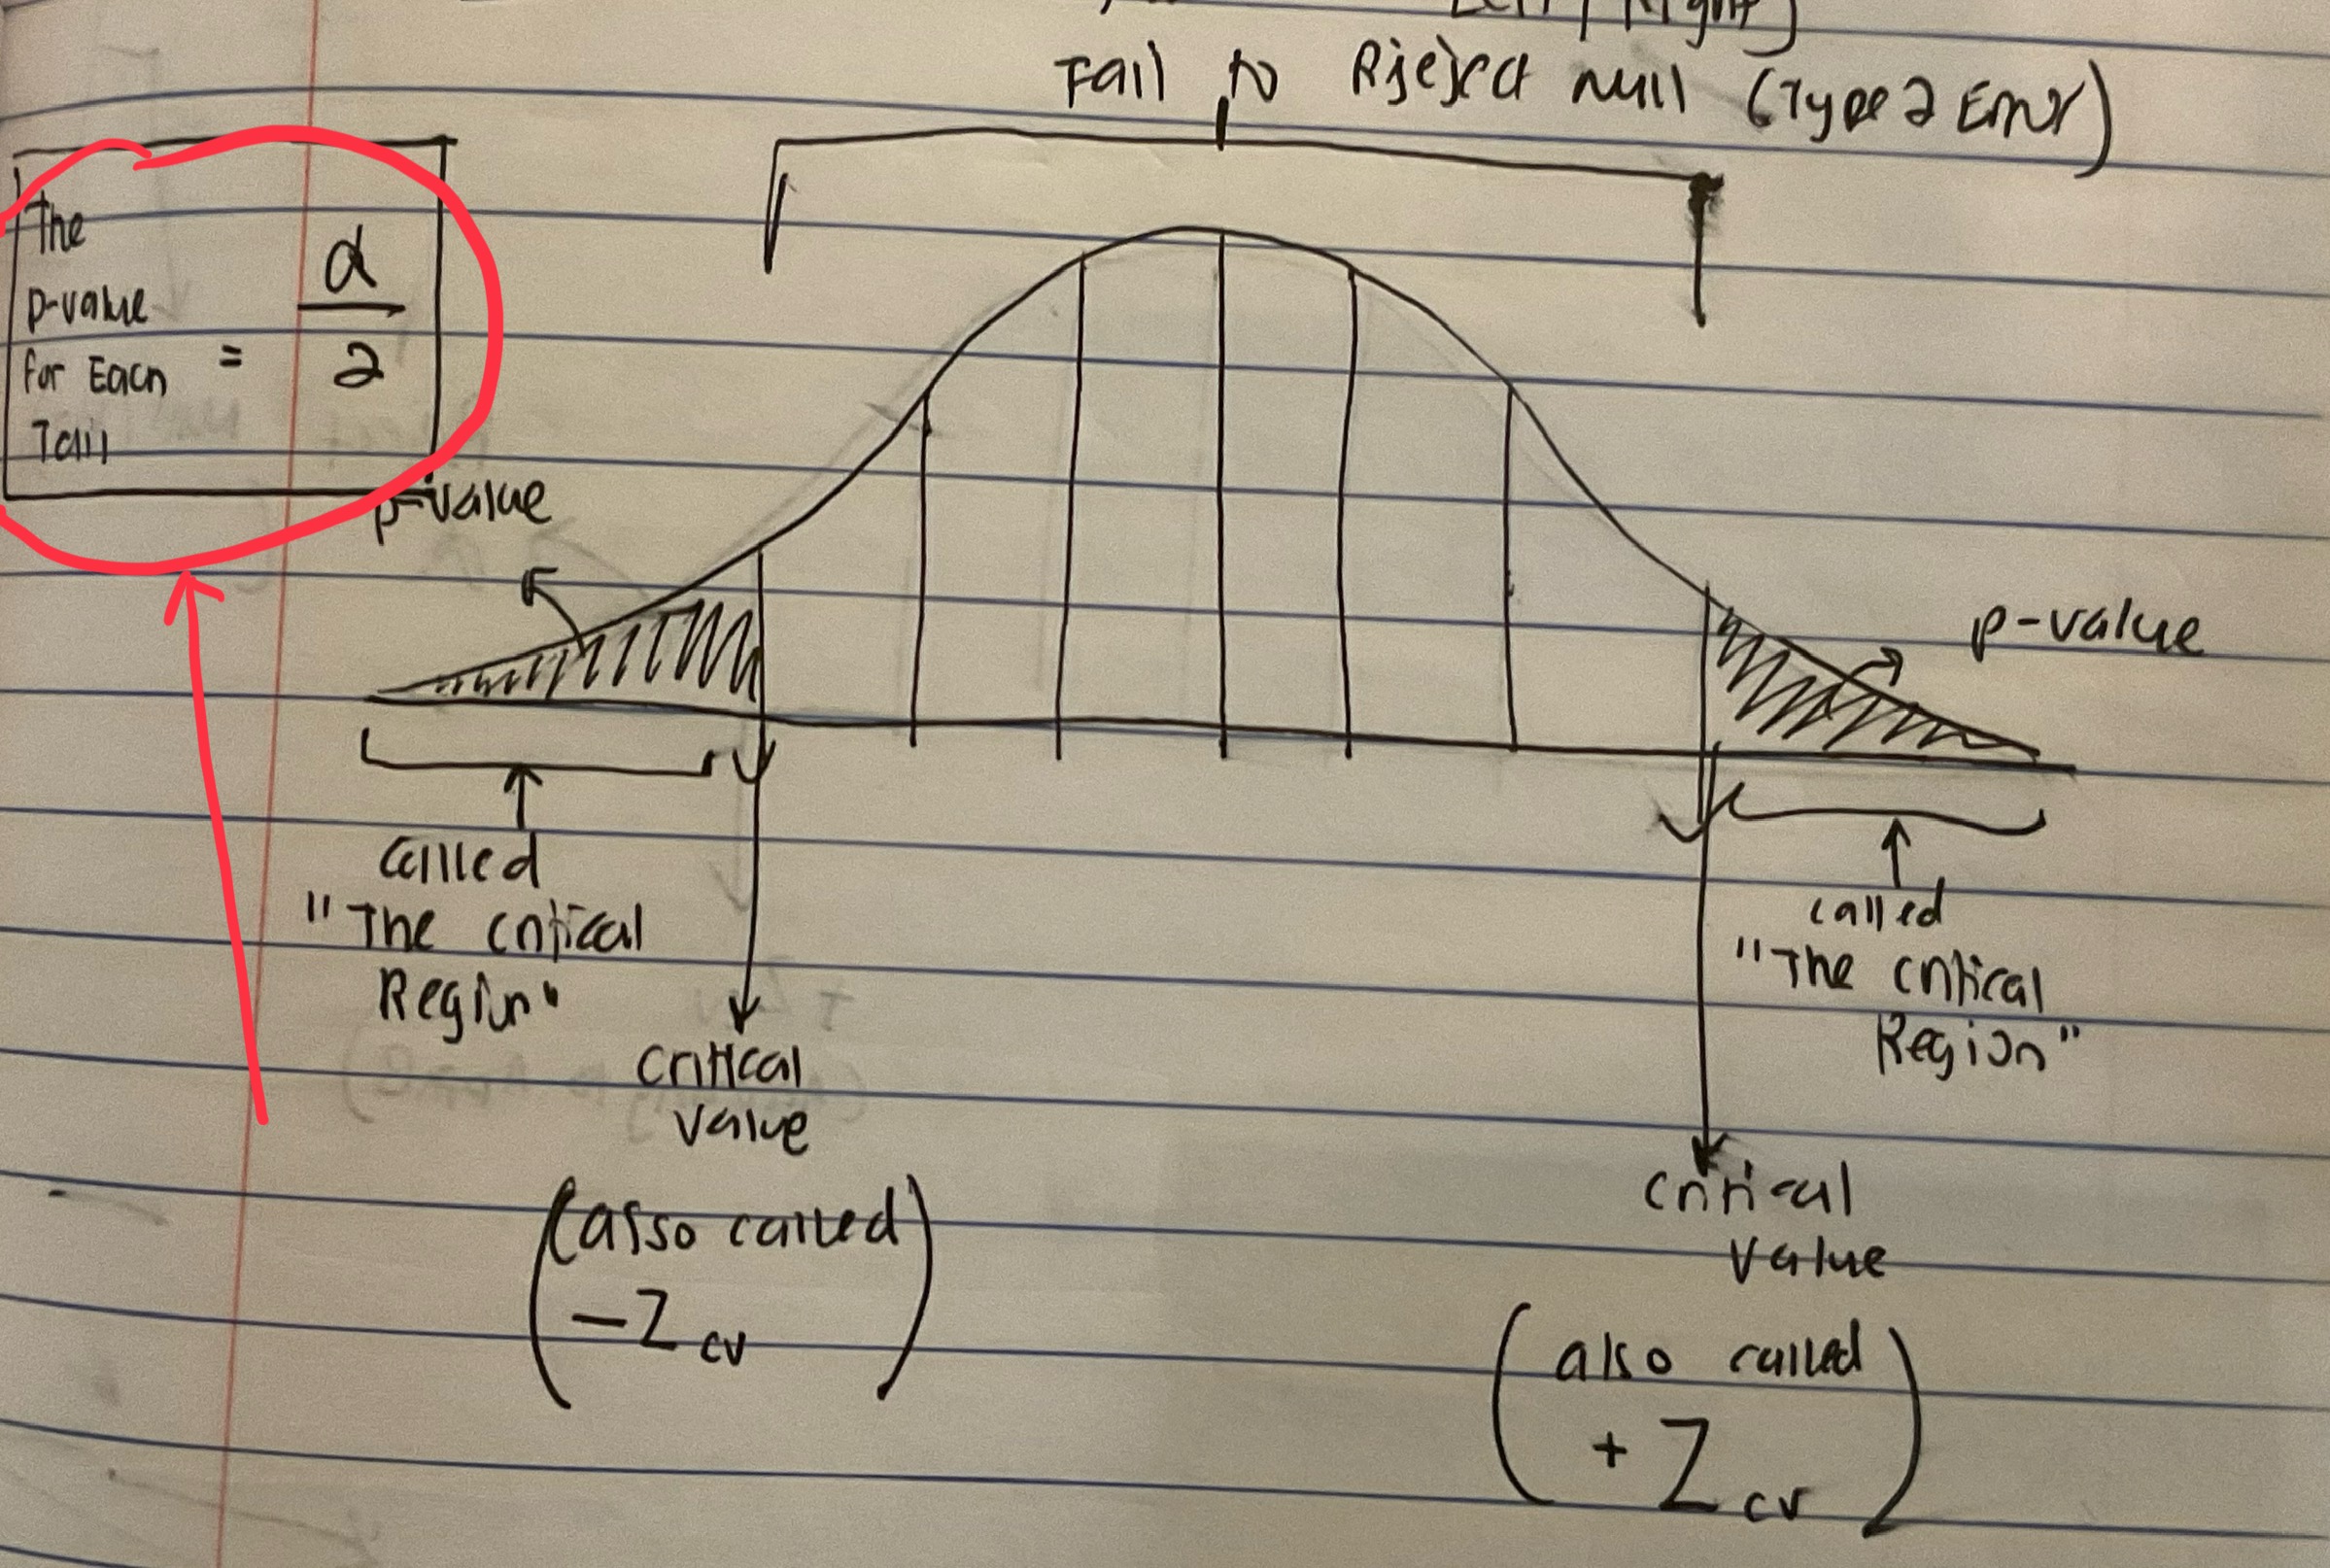
p-value for 2-tailed Test
(based on Alpha Value)
σ is to σM as…..μ is to _______.
Explain why
Answer: M
μ = Mean of the POPULATION
M = Mean of the sample (Its in the z formula)
in the same way…
σ = standard deviation of the POPULATION and
σM = standard deviation of the SAMPLE
What is Alpha (α) ?
LEVEL OF SIGNIFICANCE (ie. defines the critical region)
It is determined by the researcher (typically 0.05, or 0.01) thats used as a decision-making boundary for rejecting or failing to reject the Null Hypothesis
μ ≠ Some Number that’s designated as the mean represents ..
Null or Alternative?
Alternative (H1)
μ = Some Number that’s designated as the mean
Null (N0)
Type of Hypothesis Test #1 - Z-test
Used to determine if there is a statistically significant difference between a sample mean and a population mean when the population standard deviation is known and the sample size is large (typically, n > 30)
Type of Hypothesis Test #2 - T-test
Used to determine if there is a statistically significant difference between the means of two groups. It is often used when the population standard deviation is unknown and the sample size is small (typically, n < 30)
Type of Hypothesis Test #3 - ANOVA (Analysis of Variance)
(Analysis of Variance)
Used to compare the means of three or more groups to see if there is a statistically significant difference among them
What is a Z-score?
How far a data point is from the mean
(how many standard deviations away from the mean)
Z = (-) —> BELOW THE MEAN
Z = 0 —→ EQUAL TO THE MEAN
Z = (+) —> ABOVE THE MEAN
What does a Null Hypothesis (H1) Tell you?
There is NO significant difference between the variables being tested and any change is only due to chance (it’s not different from the status quo)
μ = Some Number that’s designated at the mean
Example: There is NO change/difference
DIRECTIONAL NULL HYPOTHESIS IS NOT RELEVANT FOR OUR COURSE (ONLY APPLIES TO ALTERNATIVE)
Sampling Error
When you take a sample of n = 25 from a larger population of N=100,000, that tiny sample may not be an accurate representation of the entire population.
This difference, or error between sample statistics and the corresponding population parameters, is called sampling error.
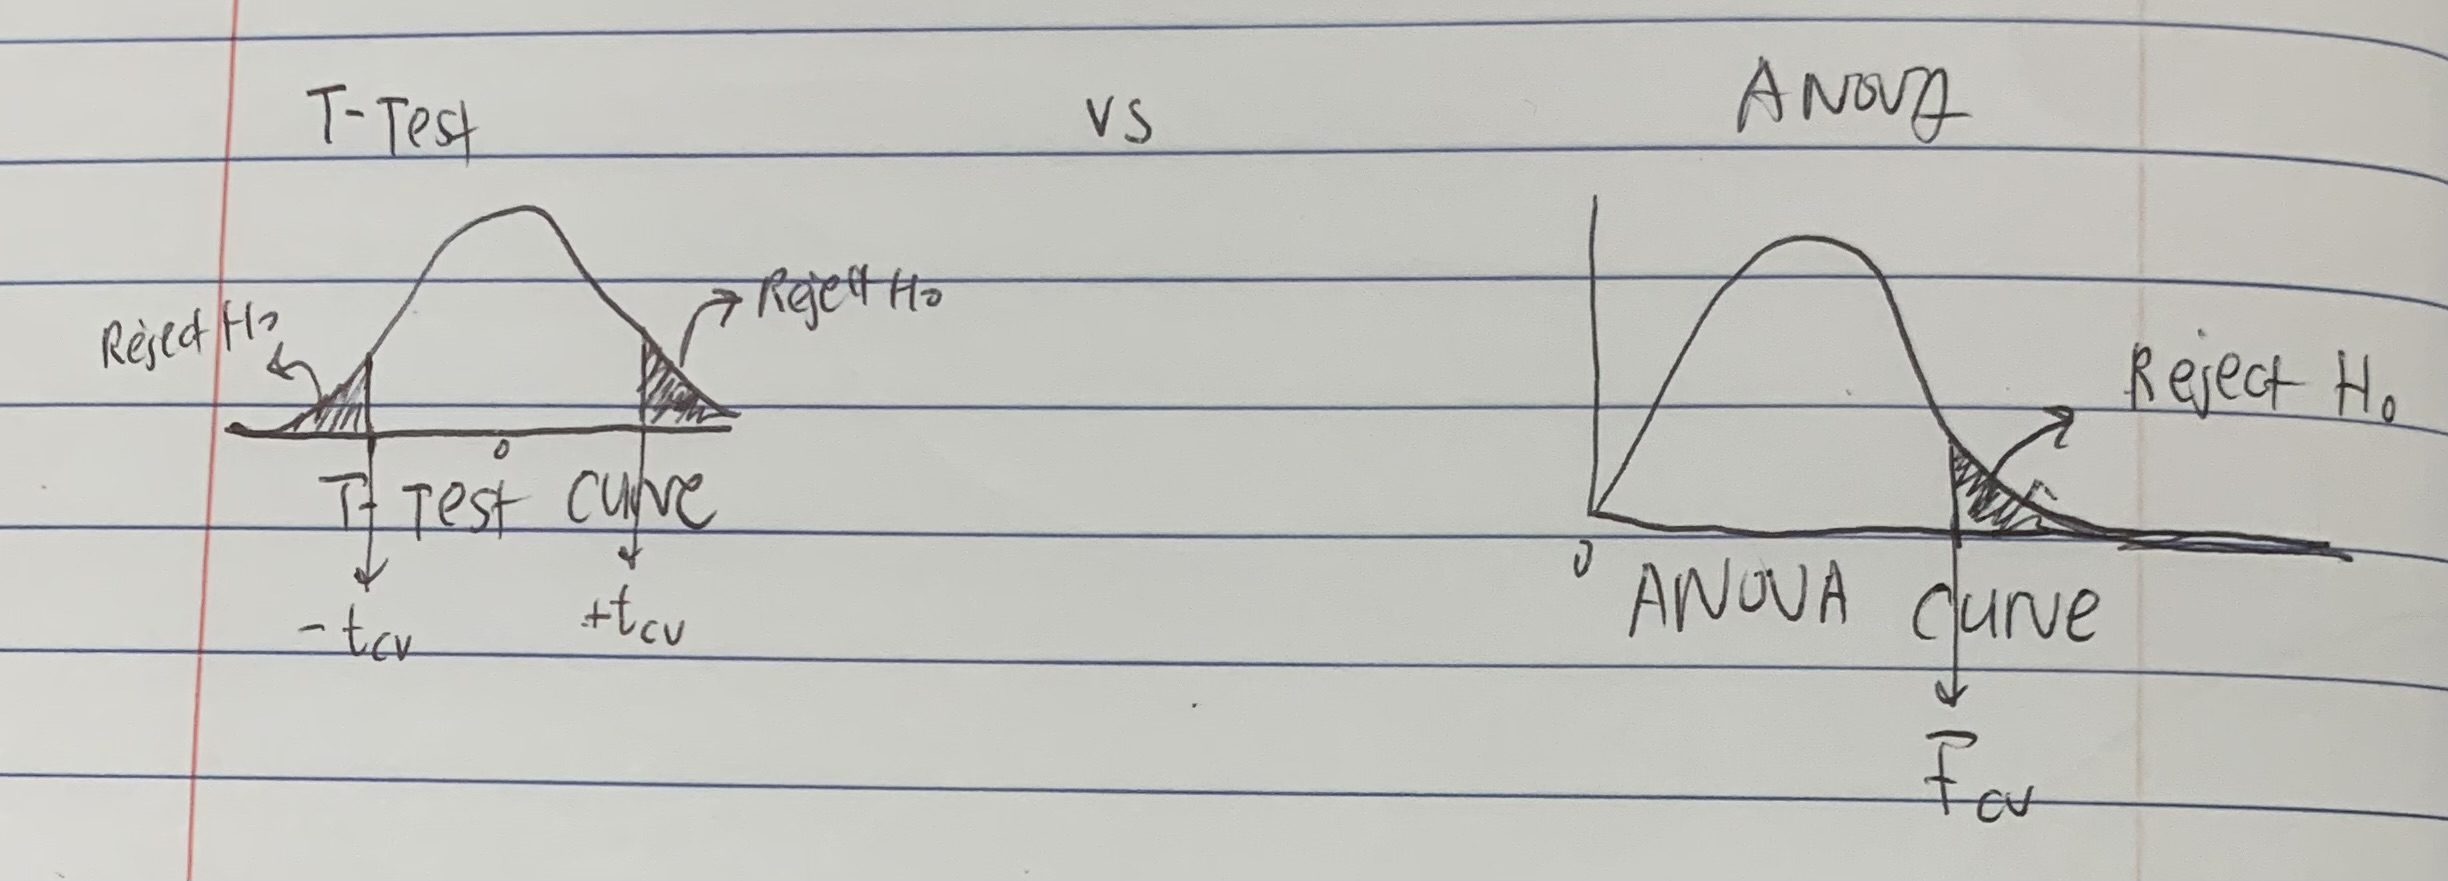
Whats the difference between a T-Test Curve and a One-Way ANOVA Curve?
ANOVA curve (called the F-distribution) looks like it’s skewed the T-Test Curve (called the T-distribution) is a symmetrical bell shape

Whats the difference between tcv (for a T-Test) and Fcv (for an ANOVA)
Tcv is the t-critical value and represents the threshold value for the T-distribution to decide whether to reject or accept the null
The Fcv is the F-critical value and represents the threshold value for the F-distribution (the ANOVA curve) to decide whether to reject or accept the null
(see pic)
What is the mathemtical relationship between tcv and Fcv
t² = F
How does the T-test and an ANOVA test differ in terms of directionality?
T-Test can be non-directional or non-directional (ie. the right and left tailed curves and the two-tailed curve)
ANOVA can ONLY be non-directional (can only tell you if there is a difference, but not whether its significantly higher or lower than the norm)
Why can’t you use a T-test to assess a sample consisting of 3 or more groups?
You must do 1 t-test for each group, but the more T-tests you do, the higher the risk for Type 1 error
When doing an ANOVA test, what does “k” represent?
Number of groups being compared
Between Subjects vs Within Subjects
(see pic)
