stats unit 1 chapter 1
1/40
There's no tags or description
Looks like no tags are added yet.
Name | Mastery | Learn | Test | Matching | Spaced | Call with Kai |
|---|
No study sessions yet.
41 Terms
individual
person or object described in the data set
variable
- any characteristic, number, or quantity that can be measured or counted
- types: categorical and quantitative
categorical variable
- takes on names or labels
- places individual into groups
- ex: eye color
quantitative variable
- takes on numeric values
- types: discrete and continuous
- ex: class size
discrete variable
- fixed set of possible values
- ONLY WHOLE NUMBERS
continuous variable
- any value in an interval on the number line
- decimals
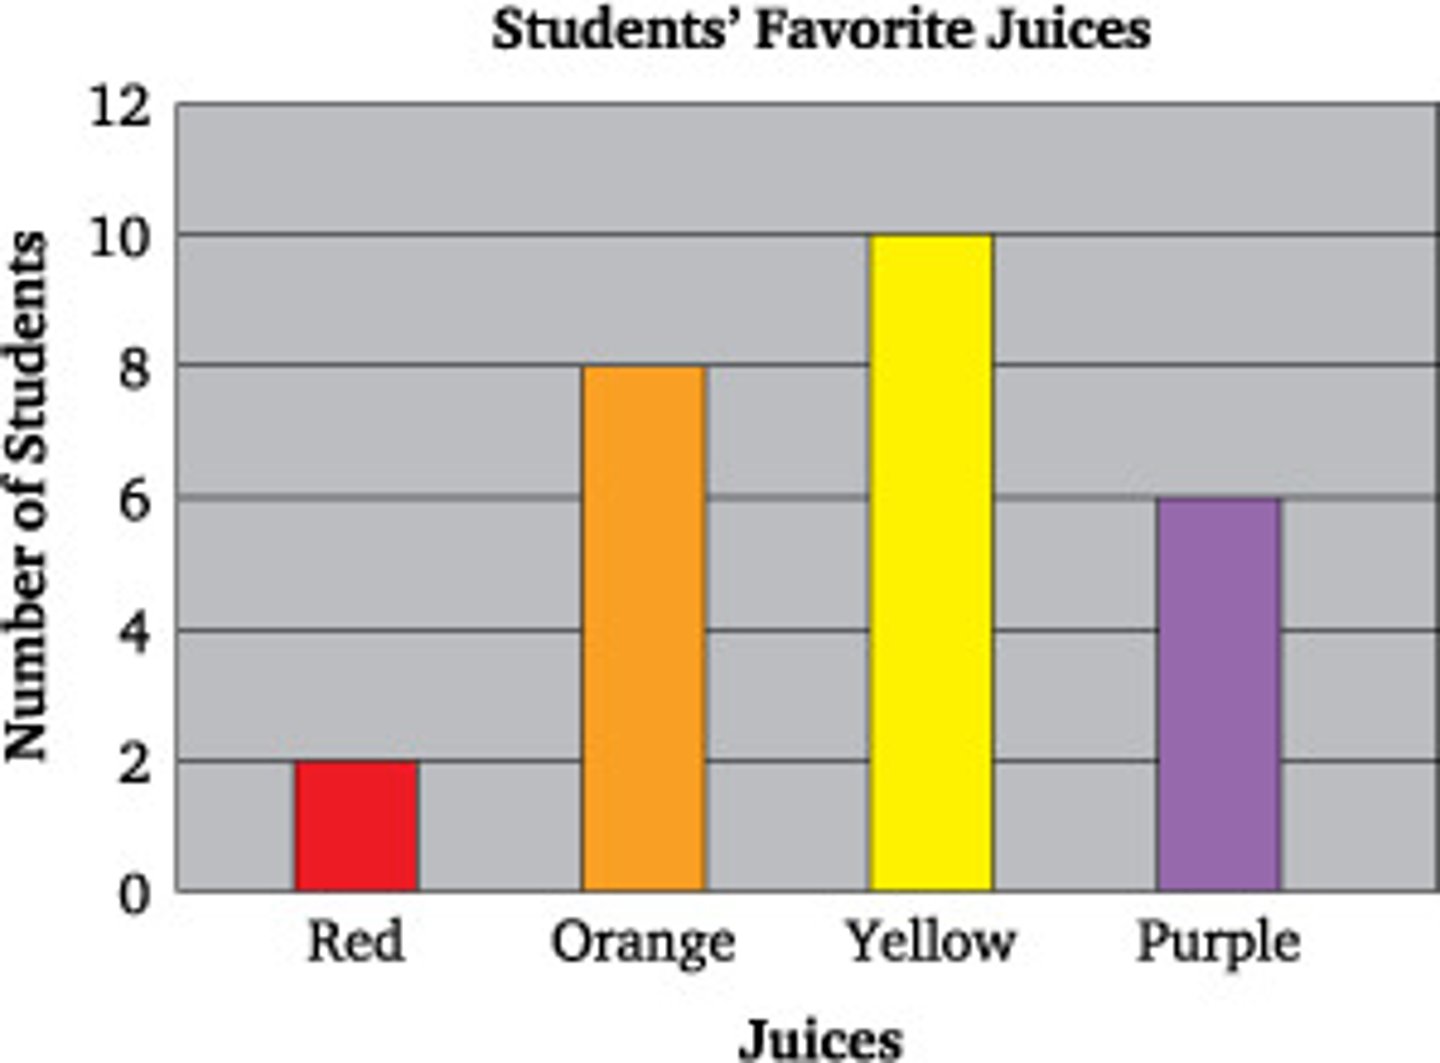
bar graph
- each bar represents frequency or relative frequency for each category
- used to compare discrete or categorical variables (counts)
- bars don't touch
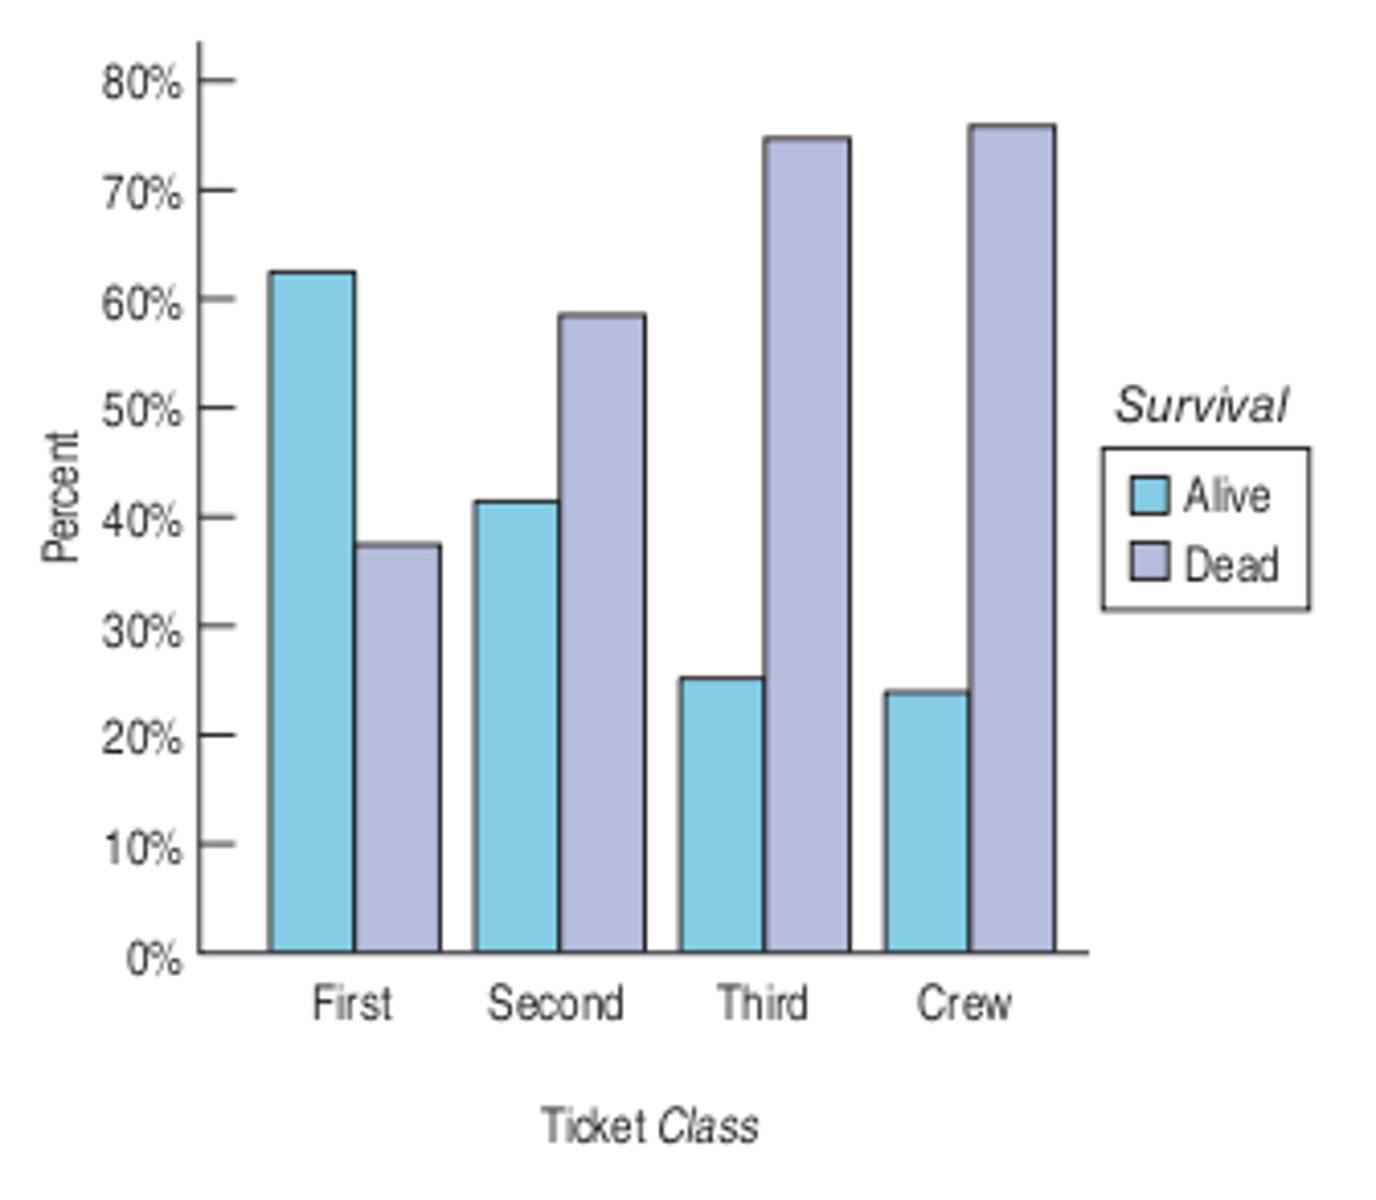
side-by-side bar graph
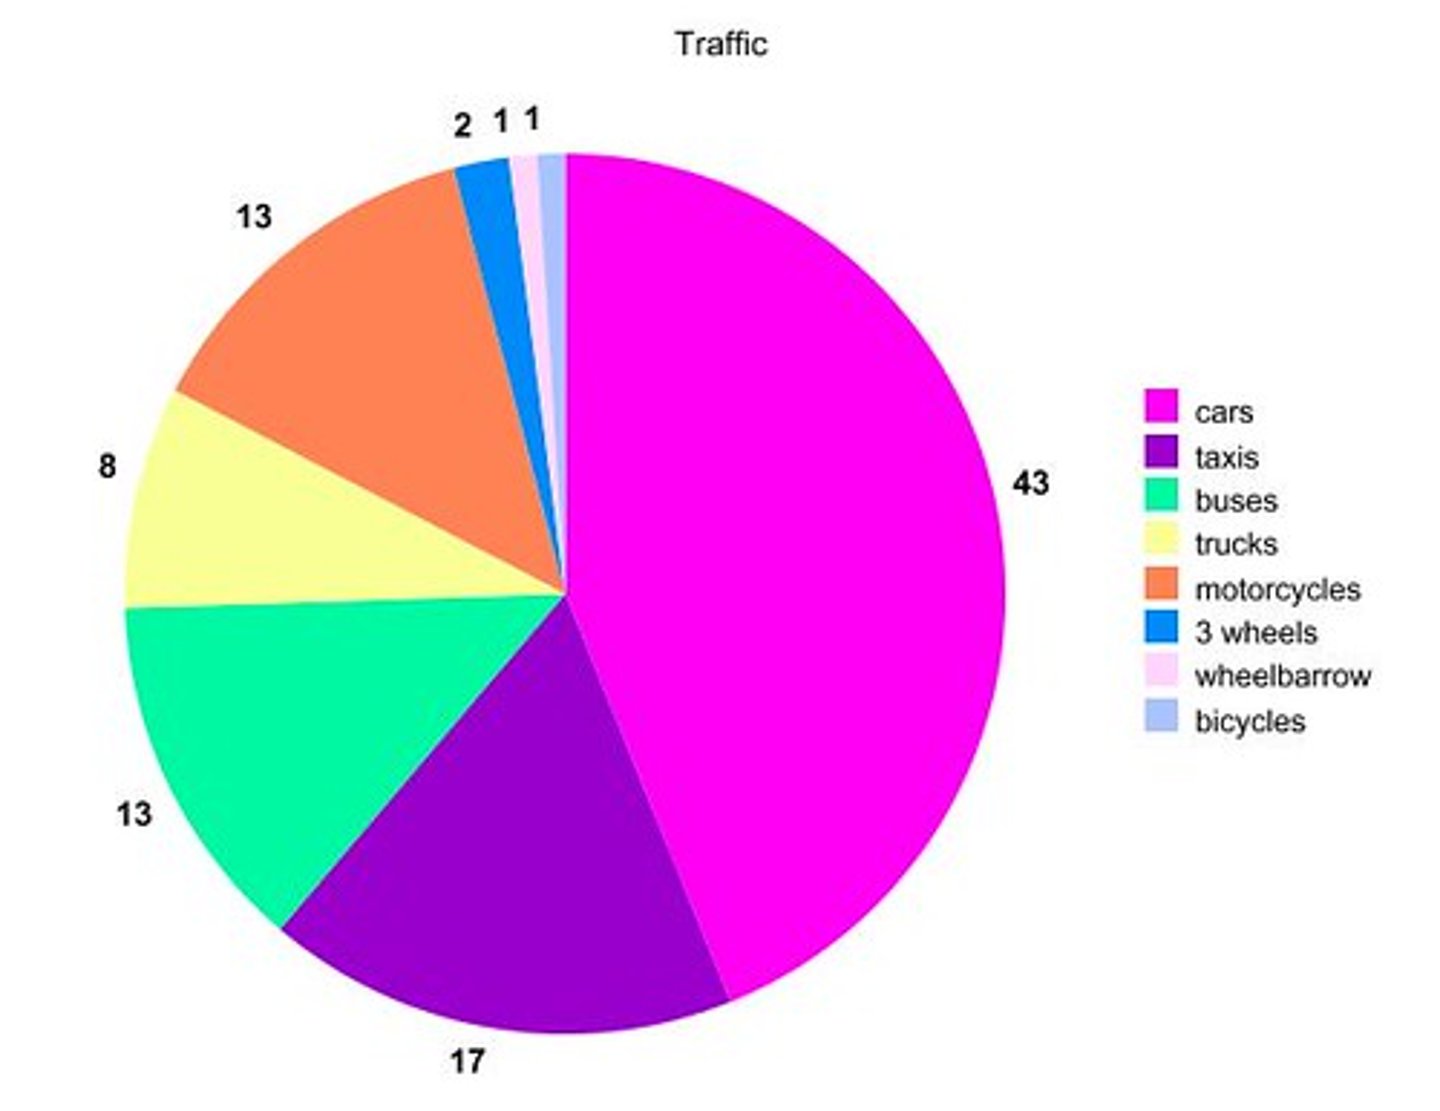
pie chart
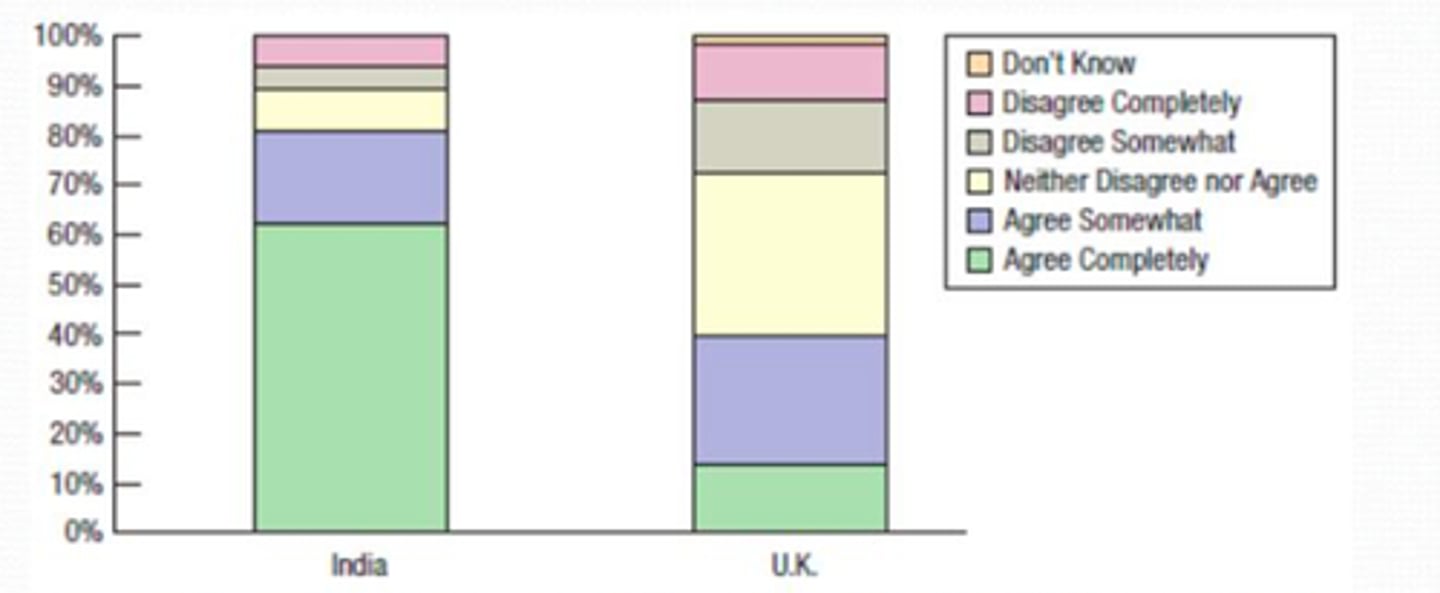
segmented bar graph
stack up the bars to make 100%
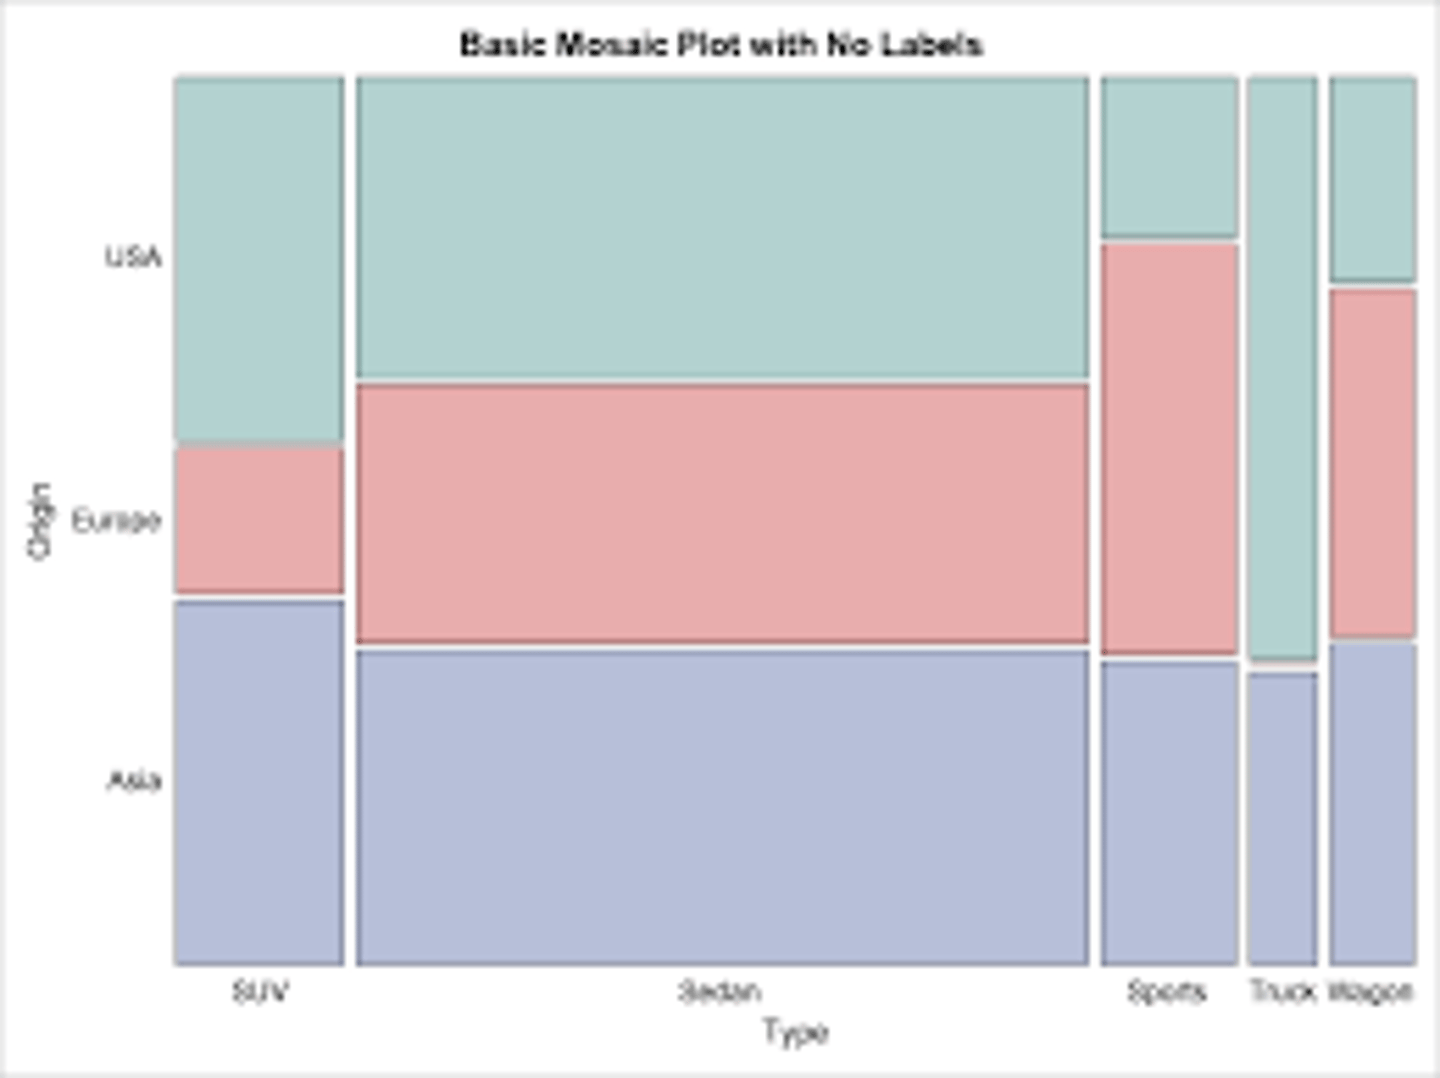
mosaic plot
segmented bar graph where the width of the bars is proportional to group size
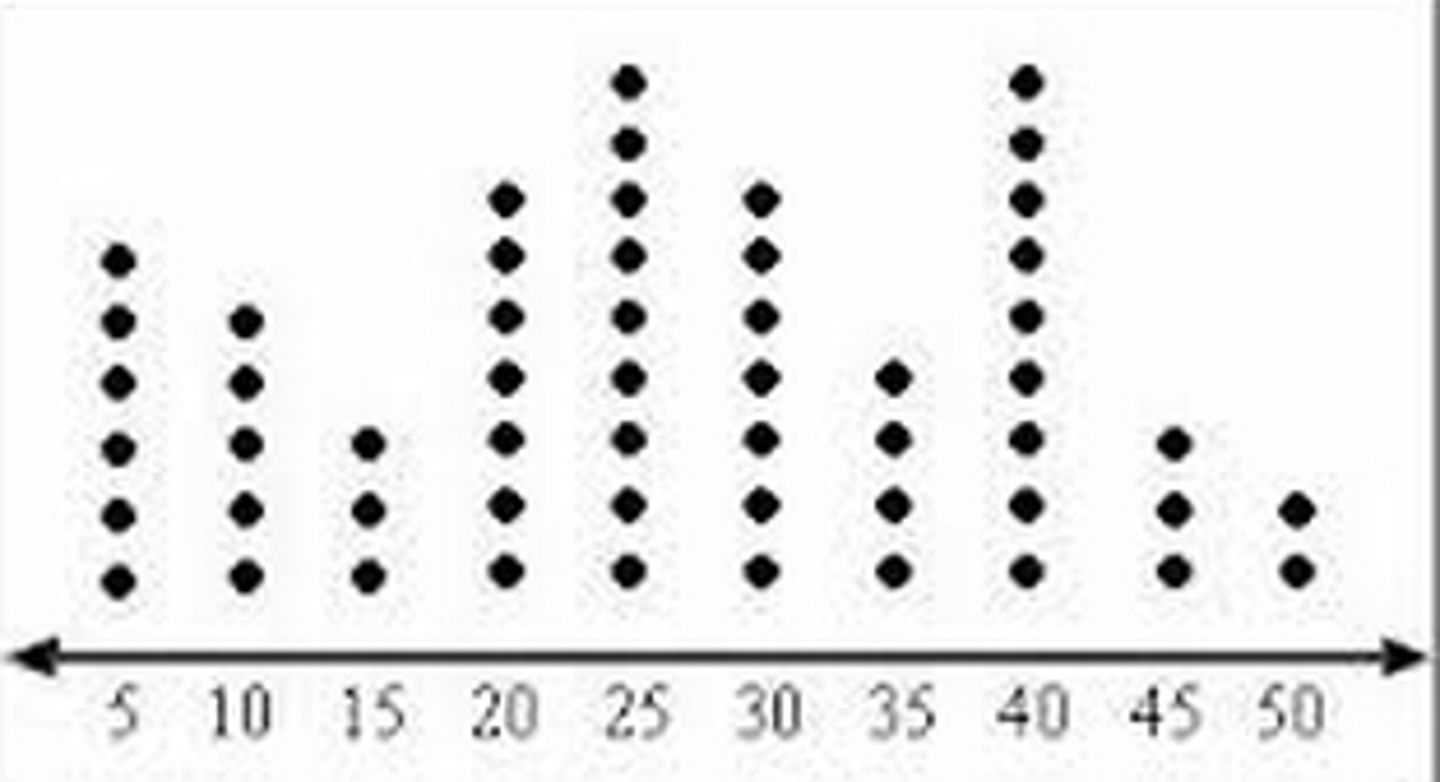
dot plot
association
if knowing the value of one variable helps us to predict the value of the other variable
descriptive statistics
describing something
inferential statistics
- drawing conclusions that go beyond the data at hand
- using sample data to make an inference about population
misleading graphs
- vertical axis should start at 0
- be wary of pictographs
marginal relative frequency
- totals
- ex: 53/121
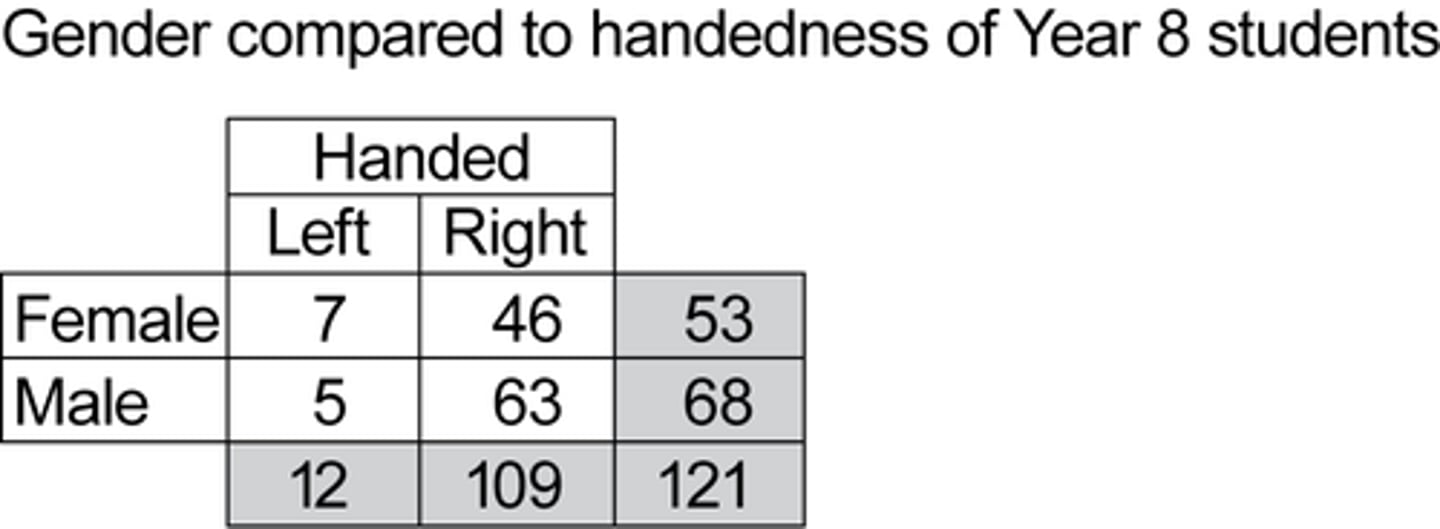
joint relative frequency
- in the table and total
- ex: 7/121

conditional relative frequency
- within the table
- ex: 7/53

symmetric
- right side approximately mirrors left side
- mean ≈ median
- use mean and standard deviation to describe
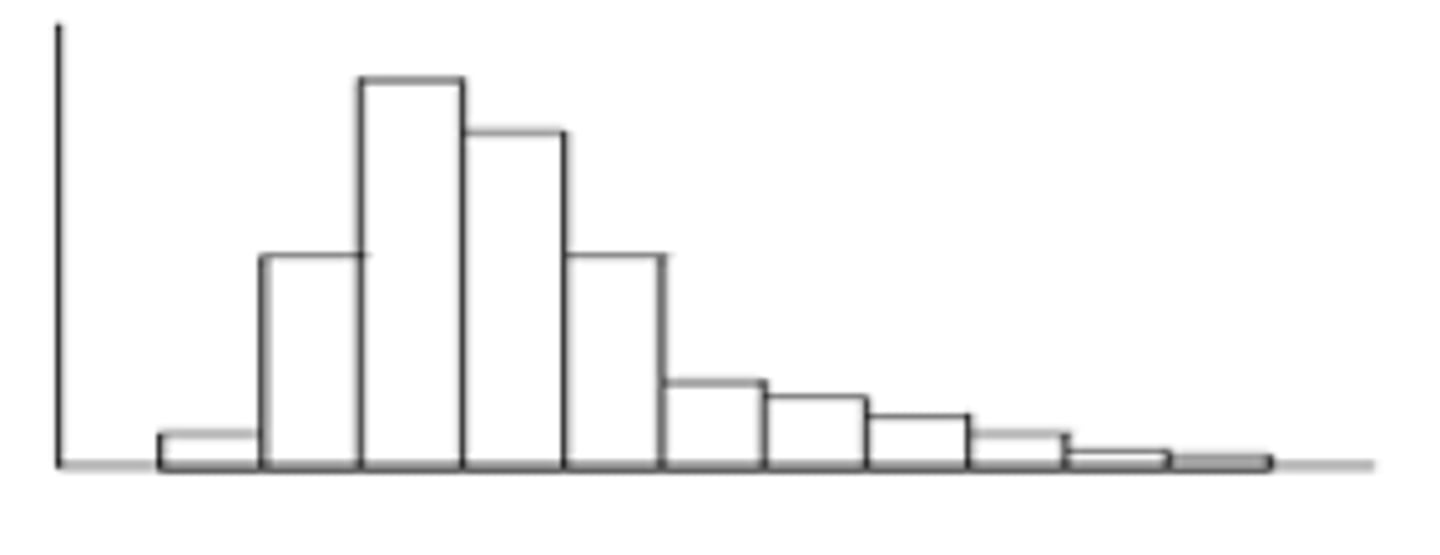
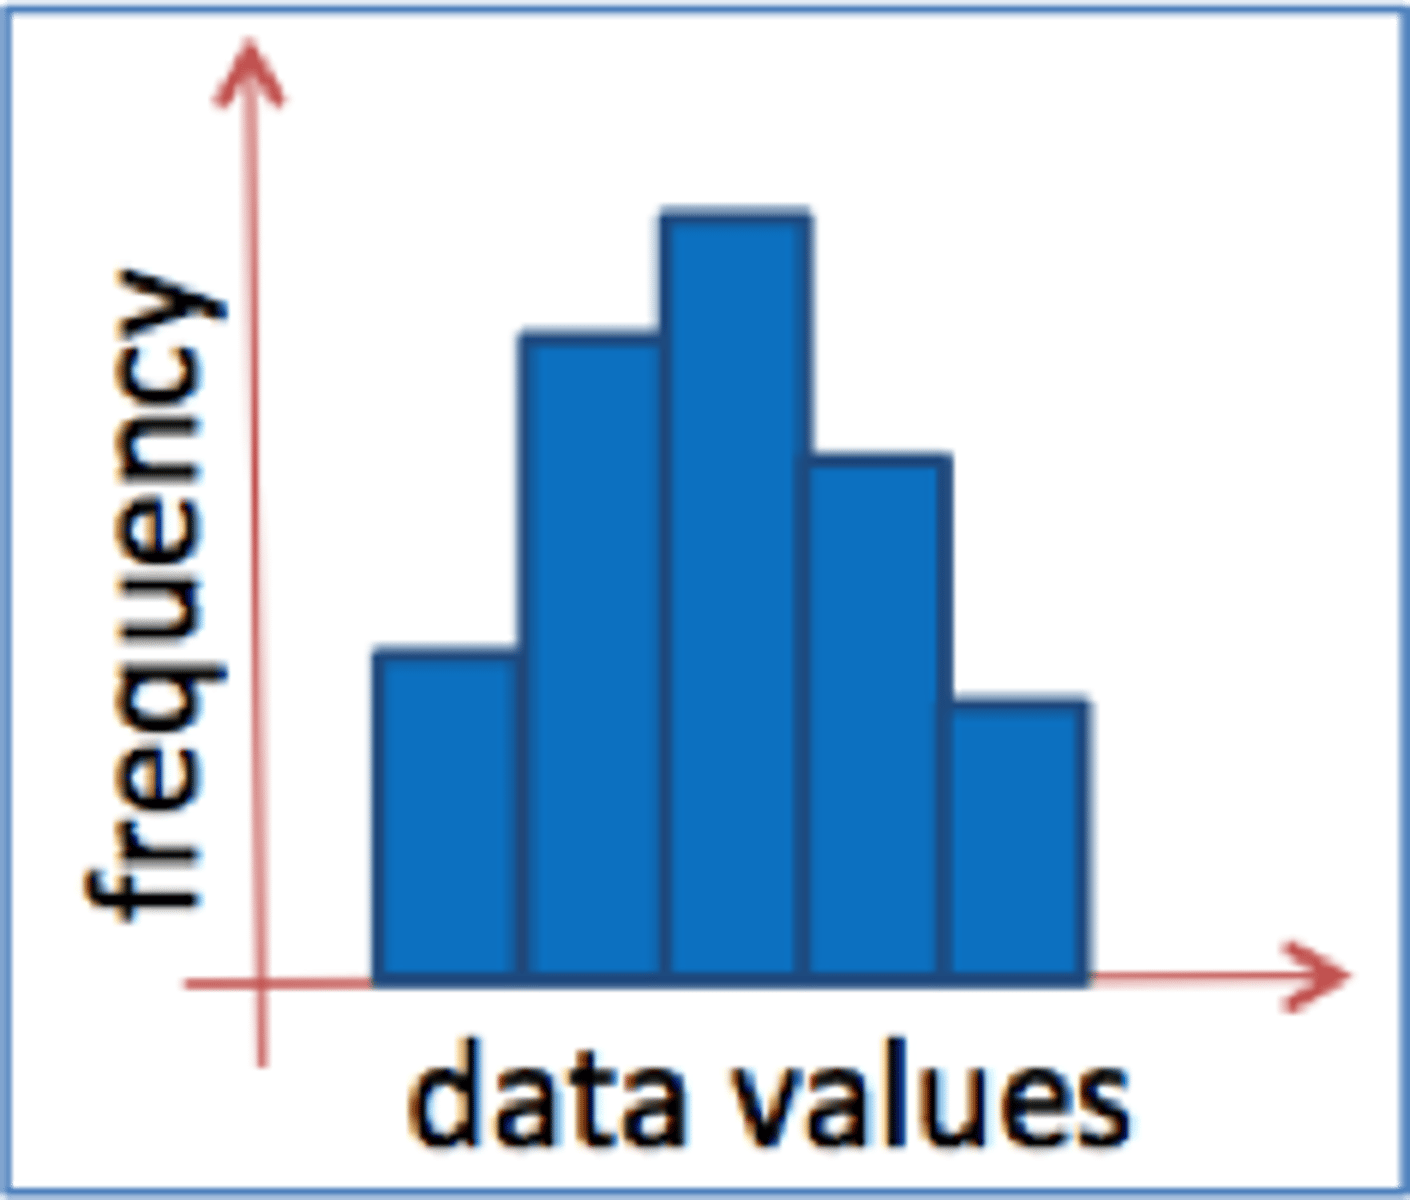
skewed to the right
- right side of the graph is longer
- mean > median
- use median to describe
skewed to the left
- left side of the graph is longer
- mean < median
- use median to describe
describing distributions
- include context
- shape: skewness, symmetric, bimodal
- outliers
- center: mean (symmetric), median (skewed/outlier)
- variability: how spread out data is
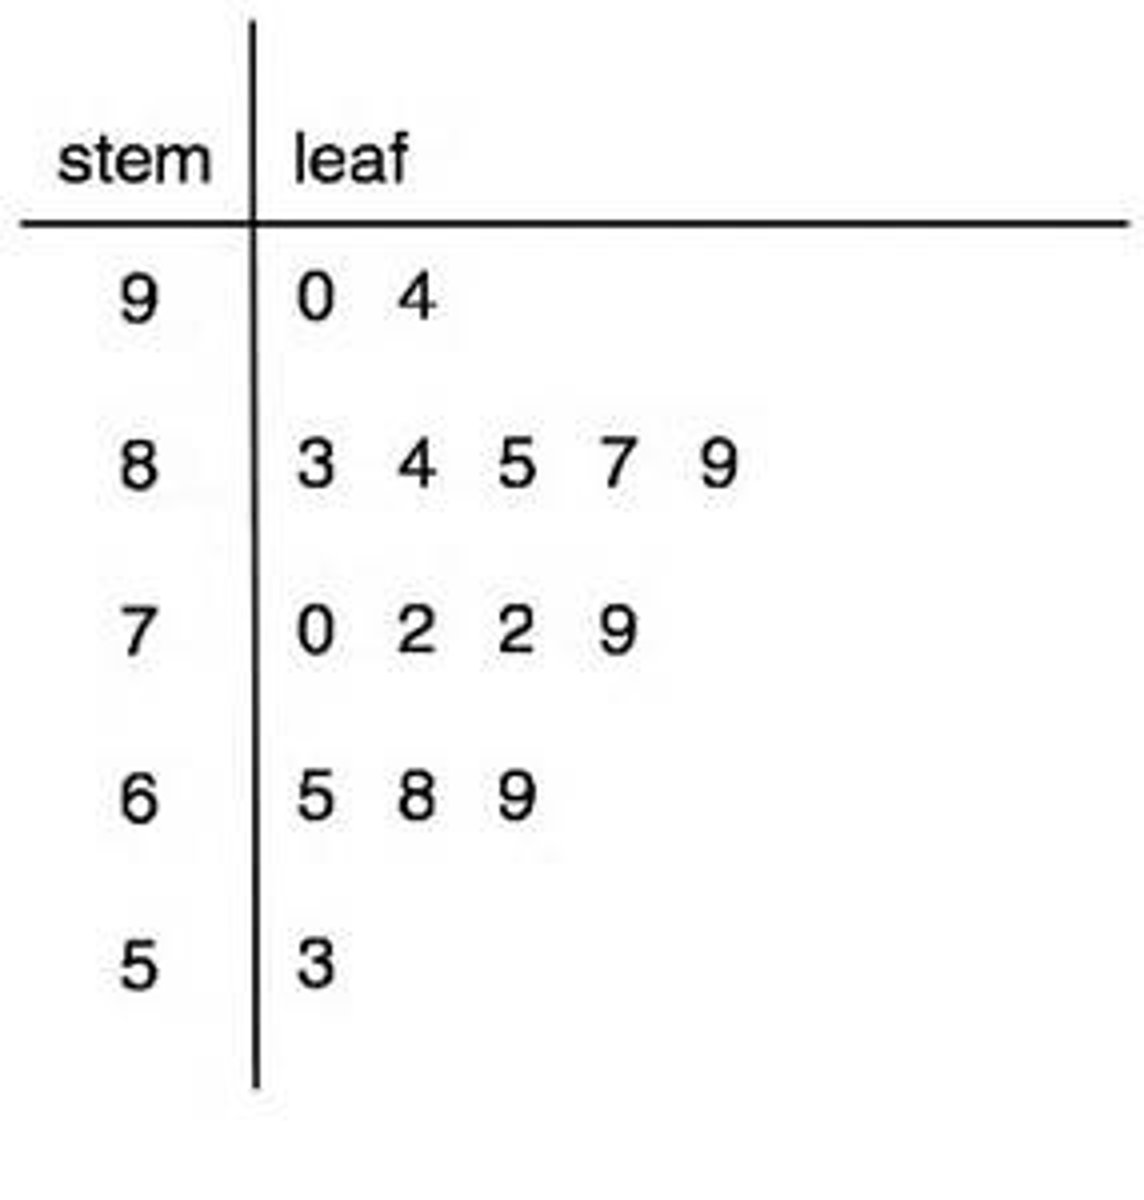
stem plots
turn stemplot to the side and you can read it like a dot plot
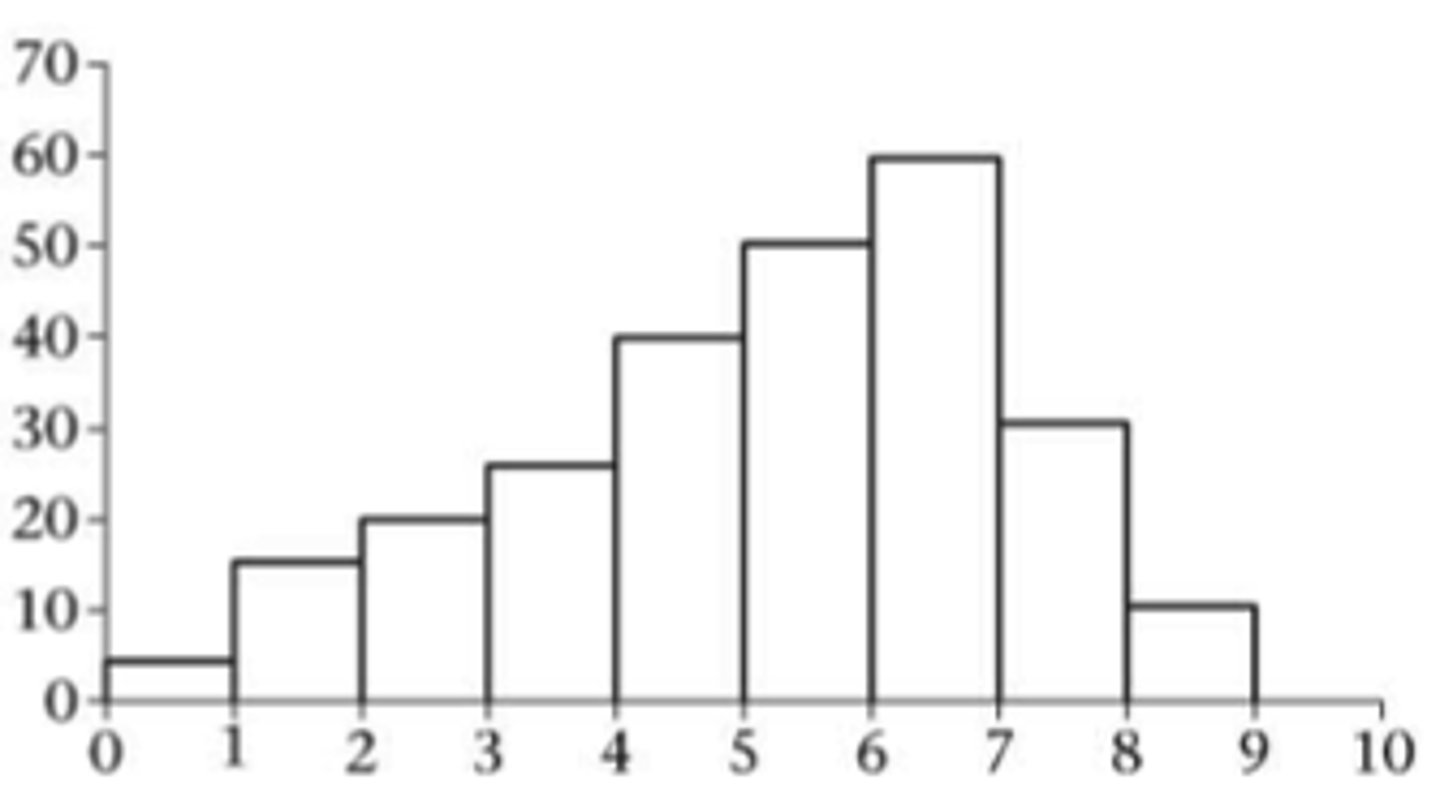
histograms
- vertical axis shows the frequency or relative frequency
- use percents or proportions on vertical axis
- bars touch
median
- midpoint
- resistant to outliers
- used to explain skewness and outliers
mean
- average
- affected by outliers
- used to explain symmetry
range
- maximum - minimum
- not a resistant measure of variability
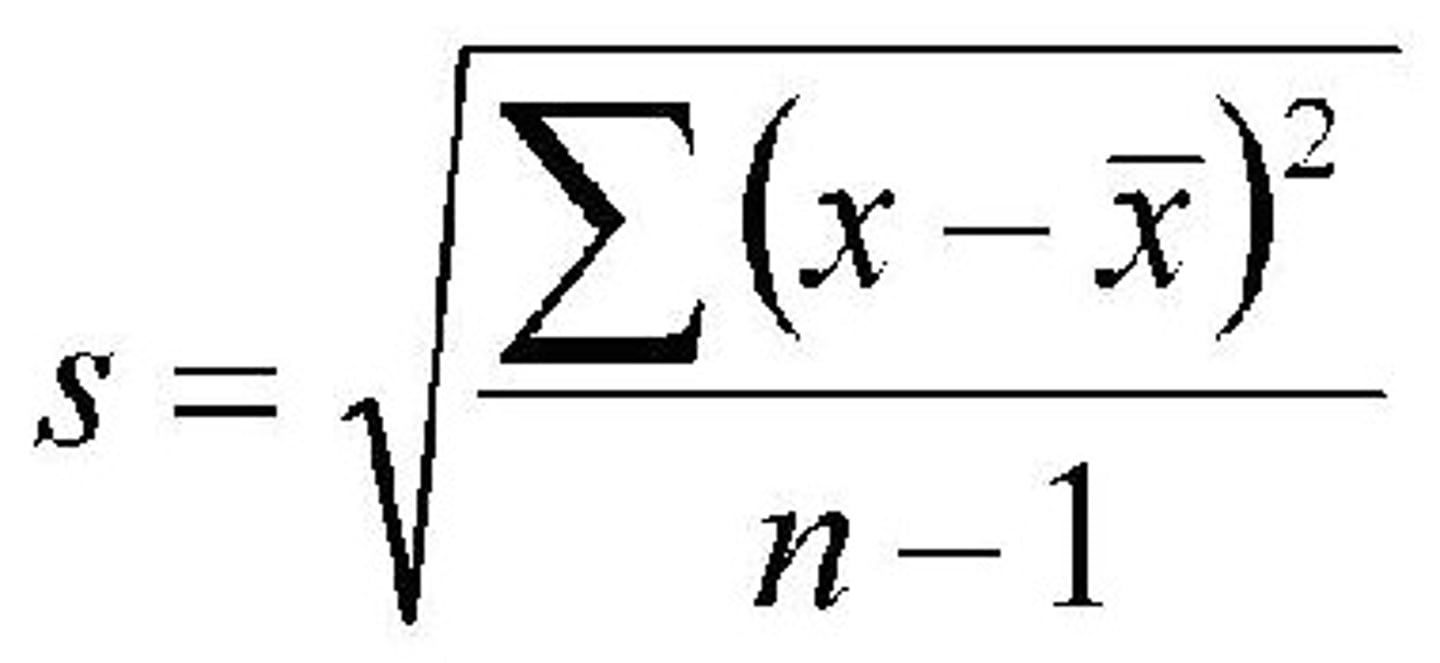
standard deviation
- distance of values from the mean
- larger value indicate greater variability
- affected by outliers (nonresistant)
- always greater than or equal to 0
- "n" is how many terms there are
sample variance
standard deviation without the square root
measures of center
- mean
- median
measures of variability
- range
- standard deviation
- "the context typically varies by SD from the mean of x̄"
interquartile range
Q3-Q1
box plots
outliers are a dot separate from the box plot

first quartile
median of values left of the median in the ordered list
third quartile
median of values right of the median in the ordered list
five number summary
minimum, Q1, median (Q2), Q3, maximum
low
___ outliers < Q1 - 1.5IQR
high
___ outliers > Q3 + 1.5IQR
outliers
influences mean, range, and standard deviation
comparing distributions
- shape
- outlier (1.5IQR rule)
- center (mean, median)
- variability (standard deviation, IQR, range)