Economics U3 AOS 2
 Call Kai
 Learn
Learn Practice Test
 Spaced Repetition
 Match
Match Flashcards
 Knowt Play
1/81

There's no tags or description
Looks like no tags are added yet.
Name | Mastery | Learn | Test | Matching | Spaced | Call with Kai | Chat |
|---|
No analytics yet
Send a link to your students to track their progress
82 Terms
Material living standards + how is it commonly measured?
Material living standards are living standards measured by access to goods and services
Depends on the quantity of goods and services that are consumed – thus reflects the levels of income, production, unemployment rates
Commonly measured by looking at GDP per capita (GSP of a nation divided by its population)
Criticisms of GDP per capita as a measure of living standards
It does not include all goods and services that are produced, only includes those that are sold (so not voluntary work) + it also doesn't include black market transactions
It only gives an average and doesn’t reflect on the actual distribution of the consumption of products in a nation
It treats all goods and services equally - increased burglar alarms and visits to a psychiatrists will increase GDP but may indicate that non-material living standards are decreasing
Does not effectively reflect non-MLS
A) GDP (Gross domestic product)
B) Increases in GDP depend on
GDP (Gross domestic product) is the market value of all final goods and services produced within a country in a year
Increases in GDP depend on:
Improved efficiency in the use of resources
Access to increased quantities of resources
A) Real GDP
B) Purchasing power
Real GDP is GDP that has been adjusted to remove the impact of inflation
Purchasing power is the ability to turn income and savings into goods and services
Non-material living standards + Affluenza
Non-material living standards are living standards unrelated to access to goods and services and includes factors such as happiness, leisure, life expectancy, crime rates and good health
Depends on the quality of daily life
Affluenza is the addictive pursuit of more and more goods and services to the detriment of overall mental and physical wellbeing
Outline how economic growth can reduce living standards (environment)
Often the production of goods and services will result in negative externalities (e.g. pollution, global warming, loss of common resources such as forests) --> reduce non-MLS
A quality environment, such as clean air and water, leads to greater health and life expectancy, and so improves non-MLS
Reduces the quality of natural resources people rely on, such as clean air, water, and fertile land. Pollution and deforestation can lower food production, damage health (less workers) and increase the cost of living --> MLS
Outline how good physical and mental health can improve living standards:
MLS
Good physical and mental health enables individuals to work efficiently, allowing them to maintain a stable income and financial security and thus be able to consume goods and services --> increasing MLS
Non-MLS
Good physical health allows people to participate in activities which can support emotional stability and social interactions, increasing happiness and satisfaction
Outline how bad physical and mental health can reduce living standards:
MLS
Whereas those with poor physical or mental health (e.g. having chronic illness, disability) will face higher healthcare expenses and may be unable to work consistently, which reduces their access to goods and services --> decreasing MLS
Non-MLS
Poor physical health can limit mobility, reduce energy levels and individuals may also suffer from chronic pain
Individuals struggling with mental health may experience difficulties in managing daily tasks and forming social connections, which can lead to increased stress and anxiety
Outline how high crime rates can reduce living standards:
Crime rates
Increased crime rates reduce MLS however is not shown up in GDP as GDP only looks at current production, so if a criminal burns down a house --> MLS would decrease but GDP is unaffected
MLS
Firms may need to spend more on security systems, which increases production costs and leads to higher prices for consumers, thus reducing their purchasing power
Non-MLS
Increased crime rates also reduce non-MLS as more people are more anxious and spend money on products to protect against crime but, in the absence of crime, could have spent money on products that made them happier
Makes it harder for people to enjoy public spaces due to fear of being a victim of crime
Governments may need to spend more on policing and prisons, which may reduce spending for other areas such as healthcare and education, thus reducing society's welfare
Outline how higher literacy rates can improve living standards:
The adult literacy rate measures the percentage of people ages 15 and above who can both read and write
MLS
A more skilled workforce is more productive – increasing GDP and consumption levels
Literate people are more likely to gain higher employment as a person who can read can attend higher education such as university and get a degree, allowing them to be more highly paid so they can then afford more goods and services
Non-MLS
The ability to read exposes a person to new ideas and possibilities which leads to an increase in non-material living standards
People can take pleasure in things such as novels and poetry
By reading books, articles it can be used as entertainment and allow them to connect with others, increasing their happiness
In the five sector model, what is provided by households to firms
Resources are supplied from households to firms
Households own land and rent it out for shops and factories
Households start small businesses and own their assets
Households provide labour in return for wages
Households ultimately own all the shares in large and small companies and provide the initial funds for them to acquire wages resources
Payment is made for those goods and services by households to the business sector
In the five sector model, what is provided by firms to households
Business sector pays for these resources
In wages, commissions, royalties (eg. if you write a song or a book)
In rent for land
In dividends on shares
In profits (on businesses directly owned by households)
The business sector provides goods and services to households
The five-sector flow model:

Leakages + it’s components
Leakages: is money that exits from the flow of spending on goods and services --> it consists of savings, taxes and imports
Savings which are disposable income not used for consumption & are typically invested directly or through the financial sector
Taxes which households are required to pay to the government sector (state, federal and local) - include rates, stamp duty, GST, income tax
Imports, where spending goes towards purchasing products from overseas
Injections + it’s components
Injections: is money that is added to the circular flow of income --> through investment, government spending or exports
Investment: where the financial sector (that includes banks and the stock market) lends to or invests in firms to increase productive capacity
Government spending which includes G1 (spending on products that are not capital in nature (not investments) such as employee salaries, stationary, rent) and G2 (government investment spending on capital goods such as new buildings, roads and ports)
Exports where Australian products are sold overseas and the funds received are an injection into the circular flow
Define Business cycle + sketch it
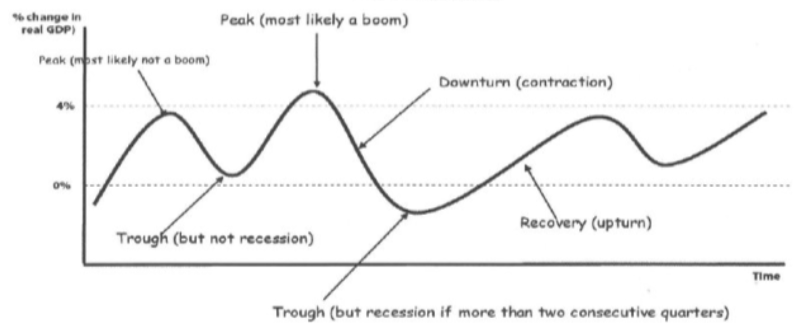
The business cycle is the cyclical pattern of growth in the economy over time with periods of above average growth and periods of below average and negative growth
Expansion/recovery
Expansion/recovery: a period of increasing growth in real GDP which follows a trough
During this stage:
The economy has plenty of capacity – so firms can easily increase production
Consumer and business confidence are beginning to rise
Unemployment begins to fall
Inflation is low but begins to rise
Assets are cheap, however start to increase
Peak
Peak: occurs after a solid period of growth and just before a downturn
During this stage:
Consumer and business confidence are high
Consumption, investment and asset prices are high
Unemployment and savings are low
Inflation is high
Contraction/downturn
Contraction/downturn: a period of negative or falling growth in real GDP --> is often triggered by an unexpected event that negatively impacts on AD where consumer and business confidence drop resulting in a further decrease in AD
During this stage:
Consumer confidence and business confidence decrease
Asset prices drop
Savings increase
Consumption decreases
Unemployment increases
Trough
Trough: occurs after a period of very slow or negative growth and just before a recovery
During this stage:
Consumer and business confidence are low
Consumption, investment and asset prices are low
Unemployment (causes labour to be cheap + readily available) and savings are high
The economy has spare capacity causing inflation to be low
What is described as a recession?
Two or more consecutive quarters of negative GDP growth
Aggregate demand + formula
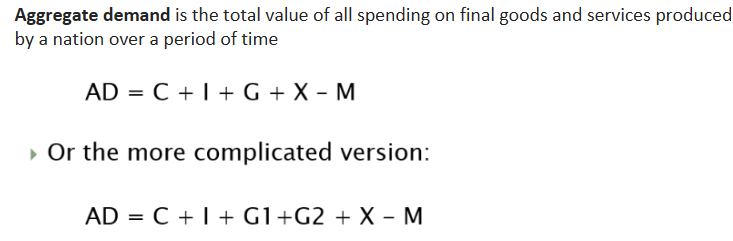
Private consumption expenditure (C) + what percentage of AD does it make up in Australia
Private consumption expenditure (C): the total spending by households on goods and services (but not including new housing which falls under I)
Makes up approx. 60% of AD in Australia
Private investment expenditure (I) + what percentage of AD does it make up in Australia
Private investment expenditure (I): funds applied towards expanding productive capacity (e.g. new factories, plant, equipment, vehicles, housing, addition to inventories)
Makes up approx. 15-20% of AD
Volatile
Government spending (G) (It’s components) + what percentage of AD does it make up in Australia
Government spending (G)
Includes:
G1 – government spending on goods and services that are not capital in nature (not investments) (e.g. employee salaries, stationary, rent)
G2 - government investment spending on capital goods (e.g. new buildings, roads and ports (things that increase the productive capacity)
G1 is approx. 17% of AD
G2 is approx. 3% of AD
Net exports/balance of trade (X-M) + what percentage of AD does it make up in Australia
Exports (X) is spending by foreigners on Australian exports of goods and services
Imports (M) is spending by Australians on foreign goods and services
X and M each represent around 20% of AD but their net impact on AD is around plus or minus 4% --> This is very volatile
List the AD factors:
Disposable income
Interest rates
Consumer and business confidence
Exchange rates
Economic growth overseas
Disposable income + how it affects AD
Disposable income: income available to households for spending after the receipt of welfare benefits and deduction of direct (income) taxes
Increase in disposable income will cause an increase in AD
Interest rates + how it affects AD
Interest rates which are the percentage amount charged by lenders to borrowers for the use of money
An increase in interest rates will decrease AD because it will reduce household discretionary income (disposable income after payment of non-avoidable expenses such as for food, shelter and interest on loans)
--> and thus it will make households less willing to borrow for consumption + it will make businesses less willing to borrow for investment
Consumer confidence + how it affects AD (Talk about marginal propensity to consume)
Consumer confidence which is a measure (through regular surveys) of consumers' optimism about the future state of the economy
An increase in consumer confidence will increase AD because:
Consumption will rise as consumers are more confident about the future and especially in their employment prospects (continued employment or wage increases) --> it increases the marginal propensity to consume - a number between zero and one, which measures the change in consumption from $1 of additional income. [The higher the MPC the greater the consumption rather than saving]
Business confidence + how it affects AD
Business confidence which is a measure (through regular surveys) of firms' optimism about the future state of the economy
An increase in business confidence will increase AD as investment will rise as firms are more confident about the future and hence will invest in new plant and equipment
Exchange rates + how it affects AD
Exchange rates are a measure of the value of the AUD against other currencies
An increase in the value of AUD will decrease AD because:
Australian exports will be more expensive for foreigners --> thus decreasing exports (X)
A decrease in the value of AUD will increase AD because:
Australian exports will be more cheaper for foreigners --> thus increasing exports (X)
How does economic growth overseas affect AD
Economic growth overseas
Increase in economic growth overseas (especially growth in Aus major trading partners like China, Japan, US, Korea) will increase AD as there is increased demand for exports
Aggregate supply
Aggregate supply is the total value of all goods and services produced by a nation over a period of time
It is equal to GDP
The maximum possible AS is at the nation's PPF
List the AS factors
Quantity of resources/factors of production
Quality of resources/factors of production
Costs of production
Technological Change
Productivity growth
Exchange rates
Climatic conditions
Government regulation
International supply chains
How quantity of resources/factors of production affects AS
Increase in resources will increase AS as firms have more resources available for production
--> this can be caused by:
Discovery of new natural resources
Immigration - labour
More investment in capital resources
How quality of resources/factors of production affects AS
Higher quality of resources will increase AS
e.g.
If agricultural land is over-farmed it can degrade the quality of the soil and reduce the ability to produce --> reducing AS
A better trained labour force will be more productive (higher outputs that can be obtained by given number of inputs) --> increases AS
Better plant and equipment can produce more --> increases AS
How costs of production affects AS
Increased production costs will reduce AS (e.g. increased wages, increased oil prices)
Decreased production costs will increase AS (e.g. decreased wages, decreased costs of technology)
How technological change affects AS
Improved technology makes production more efficient --> increases AS
A) Productivity
B) Labour productivity
C) How productivity affect AS
Productivity measures the output that can be obtained from a given number of inputs
Labour productivity is a measure of how productive the workforce is - obtained by dividing total output by the number of hours worked
When productivity is increased, we produce more per unit of resources --> which increases AS
How exchange rates affects AS
When the value of AUD increases, inputs acquired from overseas become less expensive and so AS increases
When the value of AUD decreases, inputs acquired from overseas become more expensive and so AS decreases
How climatic conditions affects AS
B) El Nino
C) La Nina
Unfavourable climatic conditions (e.g. droughts, cyclones) --> damage resources and thus reduce AS
El Nino --> more droughts
La Nina --> more rainfall
How government regulation affects AS (answer is examples)
Examples:
Policies requiring renewable energy can increase energy costs for firms --> reduce AS
Increases in minimum wage & award wages --> increase production costs and hence reduce AS
Lockdowns during pandemics, prevent firms from operating
Government spending can increase availability of trained workers + quality of resources --> increase AS
How international supply chains regulation affects AS
AS can be impacted by disruptions of international supply chains (e.g. pandemics/lockdowns, wars (Russia-Ukraine, Iran), piracy (an act of robbery or criminal violence by ship or boat-borne attackers upon another ship)
On AD & AS curves, what are on the X and Y axis?
On the y-axis is the general level of prices
On the x-axis is real GDP
A) State the relationship between AD and the general price level
B) Outline why
AD has an inverse relationship with the general price level because of:
Wealth effect: when prices increase, the purchasing power of income decreases, which results in decreased consumption
Interest rate effect: when prices increase, consumers have less money left over for savings & hence investment --> which exerts upward pressure on interest rates (borrowers having less loans pushes up the price of loans) --> which causes firms to invest less (I) --> reduces AD
International competitiveness: when prices increase (more than prices in other countries) exports will be more expensive + imports will be cheaper --> reduces AD
A) State the relationship between AS and the general price level
AS has a direct relationship with the general price level --> as when prices rise, firms increase production as they can earn more profit
Draw the AS curve (Keynesian) graph and explain why it is the way it is:
In the Keynesian version of AS (shown above)
When the economy has spare capacity (e.g. high unemployment, idle equipment), the AS curve is relatively flat as producers can easily increase production in response to changes in price
As the economy gets closer to its productive capacity the slope starts to increase --> as bottlenecks (things that prevent growth) appear and workers bargain for higher wages --> so producers will need the incentive of higher general prices to increase production
Finally when the economy is close to full capacity (e.g. little unemployment and idle equipment) supply becomes more and more inelastic/slope steepens as economy faces capacity constrains


Gross Domestic Product (GDP) + how often is it calculated
Gross Domestic Product (GDP): final market value of all goods and services produced in the economy over a given period of time
It is calculated by the Australian Bureau of Statistics (ABS) every quarter (e.g. 3 months ending 31st March, 30th June, 30th September and 31st December)
What are the different ways of calculating GDP
(as these flows equal to GDP and each other):
Income approach (I) based on estimates of all incomes earned in the economy
Expenditure approach (E) based on estimates of total expenditure on goods and services
Production approach (P) based on estimates of total output produced in the nation
The goal of strong and sustainable economic growth
The goal of strong and sustainable economic growth is to achieve the highest rate of growth in real GDP possible consistent with strong employment growth but without causing unacceptable inflationary, external or environmental pressures (3-3.5% growth rate)
Economic growth + how to measure it (include annualize meaning and calculation)
Economic growth refers to an increase in the level of national production over time
It is commonly measured by looking at the rate of increase in real GDP

Negative consequences of economic growth (Environmental)
Such as pollution and other negative externalities (e.g. noise) in both the production and consumption of goods and services --> these can include carbon emissions that can worsen climate change/global warming
Degradation of land (e.g. if farm land is overused, it loses nutrients and can become unproductive)
Overutilisation of common access resources (e.g. loss of species (fish) through shrinking habitats)
Problems with waste disposal (e.g. plastics in the ocean)
Non-MLS: greater pollution and climate change which can reduce health outcomes + greater workplace stress
Negative consequences of economic growth (External pressures)
In response to an increase in AD, Australian producers may not be able to satisfy the extra demand (or may raise their prices) so cheaper imports rise relative to exports (M>X) --> this increases the level of Australia's foreign debt and reduces the value of the Australian dollar
This is unsustainable as:
The lower value of the AUD increases inflation which may cause the Reserve Bank to increase interest rates to slow growth
Increased foreign debt means that more interest payments have to be made overseas in future (and so less spending in Australia)
Negative consequences of economic growth (High inflation)
Increase in demand inflation which occurs when the aggregate demand for goods and services surpasses aggregate supply, causing prices to rise as higher economic growth results in an economy to operate to close to productive capacity
Positive consequences of economic growth
Reduced unemployment rates
Increases in real GDP will result in increased taxes collected by governments as more sales of products means more GST collected + higher incomes means more income tax collected --> this allows governments to have higher revenue to spend on essential goods and services (e.g. hospitals, schools, police forces, infrastructure such as roads, ports and public transport) and welfare benefits and other transfer spending such as Jobseeker allowance (financial assistance to those actively seeking work, temporarily stood down, or unable to work due to temporary illness), aged pensions, NDIS
Ultimately, economic growth tends to increase living standards as:
MLS: an increase in incomes and hence spending and consumption of goods and services
Non-MLS: life expectancy, happiness, self-esteem, etc
The goal of full employment
The goal of full employment is to reach the highest level of employment consistent with the achievement of non-inflationary sustainable growth and an absence of cyclical unemployment
There is no specific percentage for the level of unemployment in order to achieve full employment, however it is said to be around 4 – 4.5%
Cyclical unemployment + what affects it
Cyclical unemployment: occurs when the nation is not operating at its full capacity due to insufficient AD
This unemployment can hence be affected by all things that impact AD (e.g. CC, growth in trading partners, interest rates, exchange rates, etc)
Why will there always be some UE?
As there will always be:
Structural unemployment which arises due to changes in the production process, that typically causes a mismatch between the skills of workers and what firms want --> these changes include:
changing tastes of consumers that lead to changing products
technological advancements
outsourcing of jobs to other countries where labour is cheaper
changes in tariff levels
Frictional unemployment which is unemployment caused by people being temporarily between jobs
Natural rate of unemployment / NAIRU (Non-Accelerating Inflation Rate of Unemployment) + what unemployment rate it is said to be + what types of unemployment does it consist of
Natural rate of unemployment / NAIRU (Non-Accelerating Inflation Rate of Unemployment): lowest level of unemployment that can be reached without causing inflation to become too high and where cyclical unemployment is absent
It is around 4-4.5% unemployment rate
It consists of structural, frictional, seasonal and hardcore unemployment
A) Employed
B) Unemployed
C) Labour force
D) Unemployment rate + how to calculate
E) Participation rate + how to calculate

A) Hidden unemployment
B) Underemployment/disguised unemployment
C) Calculating underutilisation rate
A) Hidden unemployment occurs when people become discouraged from not finding a job and give up seeking employment and hence leave the LF
Such people will not be included in the unemployment rate as they are not actively seeking employment
B) Underemployment/disguised unemployment: which occurs when someone who is employed however are not working as many hours as they desire

Long-term unemployment + why is it bad
Long-term unemployment: occurs when people have been unemployed for a year or more
This is a bad sign as when this figure increases, it is harder for them to find a job
The government can lower long-term unemployment by offering incentives to businesses to hire long-term unemployed
Too high unemployment negative consequences:
Not all labour resources are being fully utilised and hence GDP is lower than it could be
Less tax revenue + government will have to spend more on unemployment benefits
Greater income inequality as there are more people relying on low welfare payments
Lower MLS --> as there are less incomes and hence less consumption
Lower non-MLS --> people may experience low self-esteem, financial stress, lack of purpose, more crime
Benefits of unemployment
Reduced inflation
Reduced labour costs – as workers are reluctant to leave their jobs or ask for higher wages and may accept low wages + less likely to go on strike --> which can increase AS and thus AD and GDP
The goal of low inflation
The goal of low inflation is a 2 to 3% per annum increase in the general level of prices on average over time as measured by the consumer price index --> this goal is based on the CPI
What circumstances will the RBA accept:
A) Inflation above the range for a short period of time
B) Inflation below the range
The RBA is willing to accept inflation above the range for a short period of time if the economy still seems to have spare capacity
The RBA also may accept inflation below the range if economic growth is satisfactory and there is minimal risk of deflation
General level of prices
The general level of prices is a measure of the prices of a representative basket of goods and services sold in the economy
Why is inflation not targeted as 0%?
As some wages tend not to go down, which is bad because if wages go down this encourages firms to hire more workers which reduces unemployment --> inflation means that even if wages stay steady real wages decrease allowing firms to employ more workers as labour is relatively cheaper
Some increase in prices is due to increased quality of products which is not fully captured in CPI
By targeting 0% there is a risk of going negative, causing deflation which is bad as it causes the delay of purchases
A) Inflation
B) Disinflation
C) Deflation
Inflation is an increase in the general level of prices in the economy (measured by CPI)
Disinflation is a reduction in the rate of inflation however the prices are still rising but not as much (e.g. inflation drops from 4% to 2%)
Deflation is a decrease in the general level of prices in the economy (measured by CPI) (e.g. -3%)
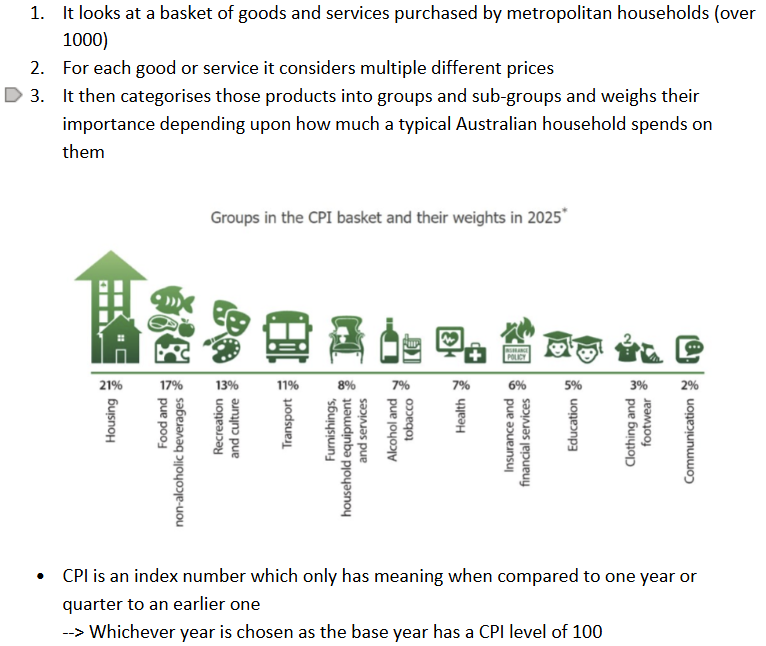
How CPI is calculated:
Criticisms of the way inflation is measured:
The selected items which are measured are items for a typical metropolitan household in Australia
--> where inflation might measure changes in prices well for households in:
Rural Australia
Not typical in their spending (e.g. rural households, pensioners, vegetarians)
Calculate inflation using the CPI level: (include quarterly and annually)

A) Headline rate of inflation
B) Underlying/core rate of inflation
C) How to calculate underlying/core rate of inflation
The rate of inflation measured by using the CPI is known as the headline rate of inflation – which is does not include any adjustment but can sometimes fluctuate due to temporary events
So the ABS and RBA also calculate the underlying/core rate of inflation – which provides as a better indicator of the longer-lasting changes in the general level of prices
It can be calculated by:
Trimmed mean – removing from CPI the top 15% products with the biggest price change and the bottom 15% of products with the smallest price change and just looks at the middle 70%
Weighted median – which looks at the middle price change
CPI excluding volatile items – CPI that excludes fruits, vegetables, automotive fuel)
By focusing on underlying inflation – the RBA will not change policy due to one-off events
A) Demand inflation
B) Factors that affect it
Demand inflation: when AD outstrips aggregate supply, causing prices to rise as a result to maximise profit --> particularly occurs as the economy reaches productive capacity
These factors include:
Higher disposable income – due to lower tax rates, interest rates etc
Higher consumer confidence
Greater government spending
Strong growth overseas which increase Australia's exports
Lower exchange rates – in which the Australian dollar weakens which increases Australian exports + decreases imports
A) Cost inflation
B) Factors that affect it
Cost inflation: occurs when rising costs of production (such as wages, interest rates or imported inputs) cause prices to rise so firms can protect their profits
These factors include:
Higher production costs – due to increased business tax, wages etc
Lower productivity
Poorer climate conditions
Lower exchange rates – due to weakened AUD, imports are more expensive so firms are likely not to be able to afford overseas productive inputs
Increased input costs
Consequences of high inflation
Erosion of purchasing power
Inflation erodes the real value of money and so the purchasing power of incomes and savings
--> this especially impacts:
People on fixed incomes (e.g. retirees living off savings)
People on minimum wage
People paying income tax who get pushed up into the next income bracket and pay higher taxes (this is called bracket creep) although their real income may have not increased
--> Thus reduces material living standards
Development of wage-price spiral
Where there is an expectation that inflation will increase so workers will demand higher wages, which increases production costs leading to firms to increase selling prices – inflation which causes workers to demand even higher wages which further pushes up inflation
Distortion of spending and investment decisions
It makes businesses uncertain whether changes in relative prices reflect real changes in demand or if it's just inflation --> this can lead to bad decisions such as overproducing or underproducing goods
Encourages investors to invest in assets whose price increases protect against inflation which may not always be the most productive assets (e.g. gold, bitcoin) --> leads to slower economic growth
Wastes resources with the constant need to communicate new prices (e.g. takes time, money and effort (printing menus, updating systems, relabelling etc)
High inflation discourages saving and future investment as consumers will wish to use their purchasing power before it is eroded, this means there will be a smaller pool available for investment which will slow future economic growth
Low returns on investment
When inflation rises above the interest rate, lenders/savers receive lower returns and hence lose purchasing power --> this has the effect of redistributing wealth from lenders to borrowers as borrowers are repaying loans using money that is now worth less than expected
--> this may discourage investment, resulting in GDP to grow less and reduces material living standards
Lowers international competitiveness
If Australia's inflation is higher than global competitors, then our exports will be relatively more expensive and we will lose market share and exports will decline --> reduces GDP and thus MLS
Consequences of low inflation
Consumers will delay consumption on the basis that if they wait prices will decrease --> this causes a decrease in AD and thus lowers GDP and increases unemployment
Inventories
Inventories are the stock of unsold goods and raw materials that businesses keep on hand for future sale or production.
Casualisation
Casualisation refers to the increasing number of casual and part-time jobs in the workforce as a proportion of the total number of jobs
How can access to goods and services affect living standards (access and not access)
MLS
Greater access to goods and services such as healthcare, education, and products increases material living standards as individuals are able to satisfy more of their needs and wants.
On the other hand, limited access to goods and services reduces material living standards as individuals cannot obtain and consume essential goods and services required for a satisfactory standard of living.
Non-MLS
access to certain goods may boost an individual's general welfare and quality of life. (e.g. For instance, access to healthcare improves life expectancy and access to education can increase life satisfaction and opportunities.)
Overconsumption of products may reduce ones leisure time, increase stress, worsen health and also can result in negative externalities which ultimately reduce the overall satisfaction and wellbeing of individuals. (e.g. consuming cigarettes, using loud lawnmowers)