Experimental Error & Statistics (L01; chptrs 3 & 4)
1/28
Earn XP
Description and Tags
CHEM 310: Foundations of Analytical Chemistry
Name | Mastery | Learn | Test | Matching | Spaced | Call with Kai |
|---|
No analytics yet
Send a link to your students to track their progress
29 Terms
qualitative analysis
deals with the identification of objects; finding what elements or compounds are present in the sample to give us a descriptive and non-numerical result
quantitative analysis
concerned with the determination of how much of a particular substance (analyte) is present in a sample, and it gives us definite results (has numbers and units)
types of quantitative analysis according to sample amount
> 100 mg = macro
1-10 mg = micro
1 ug = ultramicro
types of quantitative analysis according to percent analyte
> 1% = major constituent
0.01-1% = minor constituent
<0.01% = trace constituent
Error
= Accepted Value - Experimental Value
Can be positive or negative depending on whether the experimental value is greater than or less than the accepted value
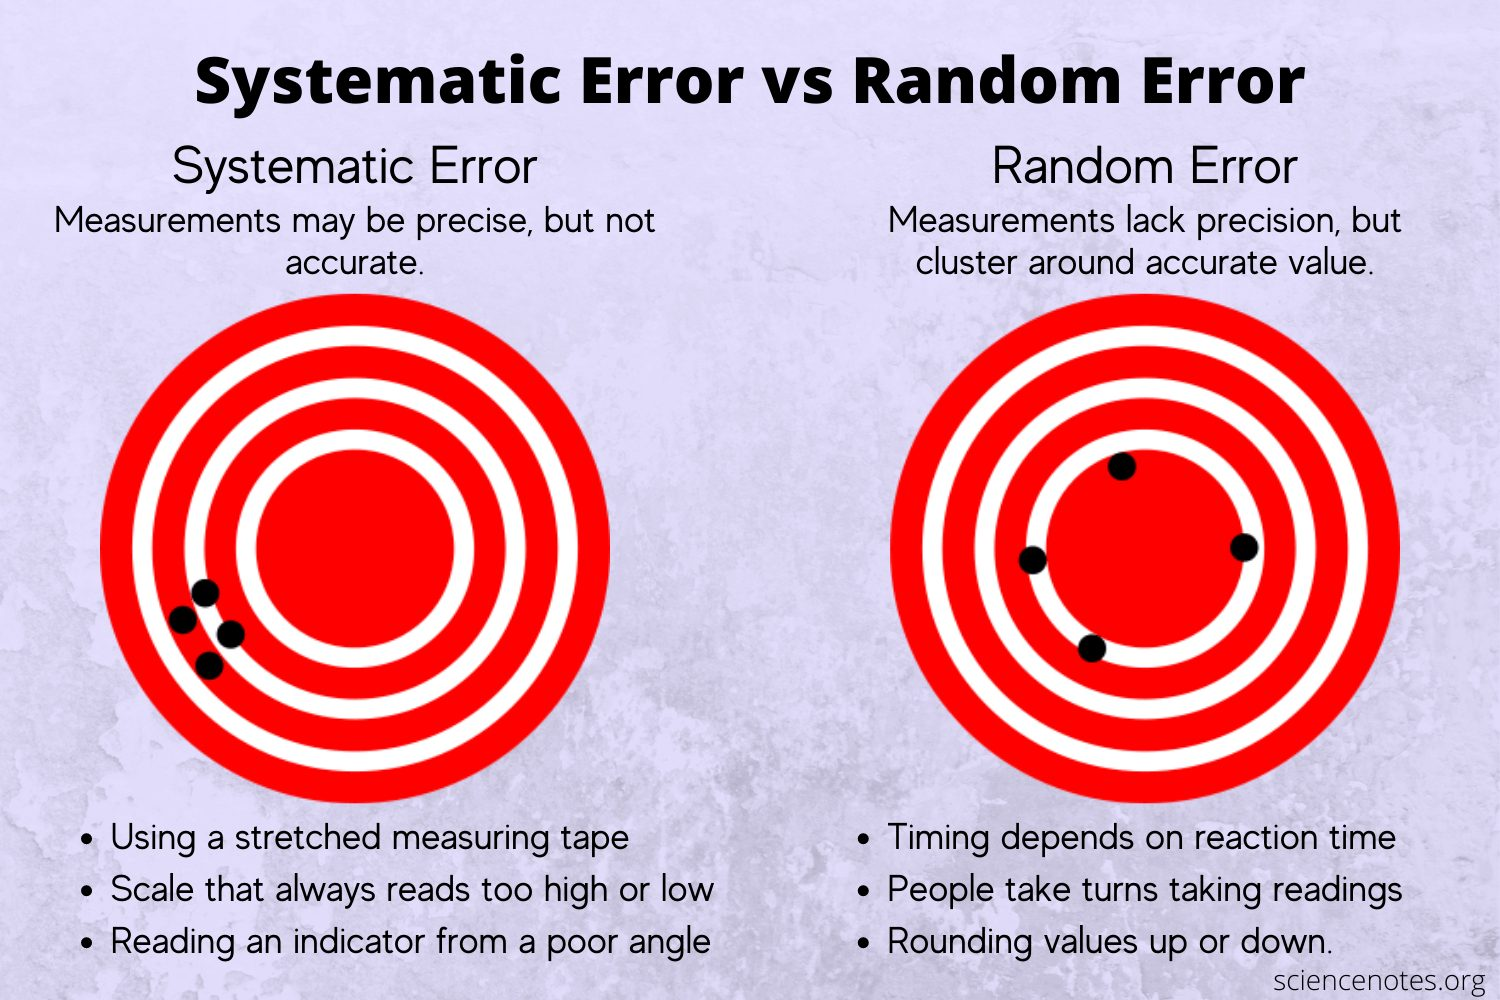
Systematic/Determinate Errors
Arises from an instrumental or procedural flaw
Reproducible
Unidirectional
Can be corrected
Example: System error from an uncalibrated burette
Causes of determinate errors?
Methodic - reflects the properties of the chemical system involved
Operative - faulty observation; mistake by the experimenter
Instrumental - miscalibration of apparatus
Random/Indeterminate Errors
arises from uncontrolled variables during measurement
cannot be corrected
example: electrical noise from an instrument

Identify the following as a Systematic/Determinate or Random/Indeterminate Error: A worker miscalculates the molecular weight of an analyte
Systematic/Determinate error
Identify the following as a Systematic/Determinate or Random/Indeterminate Error: A balance that is capable of measuring only to 0.0001 g cannot distinguish between 1.0151 g and 1.0149 g; in one case the measured mass is low and in the other case its high.
Random/Indeterminate error
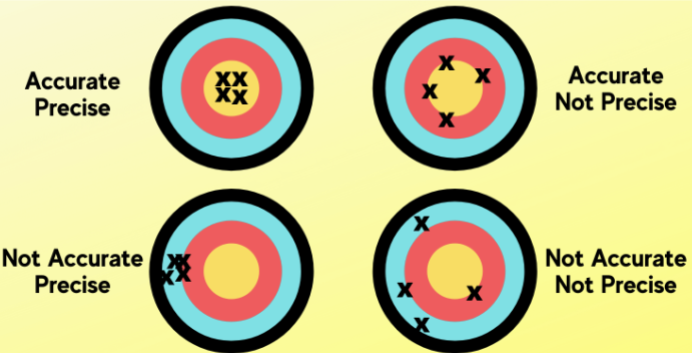
Accuracy
a measure of how close a measurement comes to the actual or “true” value
How can you express accuracy?
with absolute error and relative error
*the smaller the error, the greater the accuracy!
Absolute Error
= |Accepted Value - Experimental Value|
Relative Error
= ( |Error| / Accepted Value ) x100
Precision
a measure of reproducibility, depending on replicate analyses
Accuracy vs. Precision
ACCURACY: correctness, checked by using a different method, and poor accuracy results from procedural or equipment flaws
PRECISION: reproducibility, checked by repeating measurements, and poor precision results from poor technique
Measurement Precision
EVERY measurement has an associated uncertainty (unless it’s an exact, counted integer; e.g. the number of trials conducted)
and EVERY calculated result also has an uncertainty related to the uncertainty in the measured data—this uncertainty can be reported as an explicit ± value or as an implicit uncertainty by using the appropriate number of sig figs
Rules for sig figs: Add/Subtract
LEAST # OF DECIMAL PLACES

Rules for sig figs: Multiply/Divide
LEAST # OF SIG FIGS
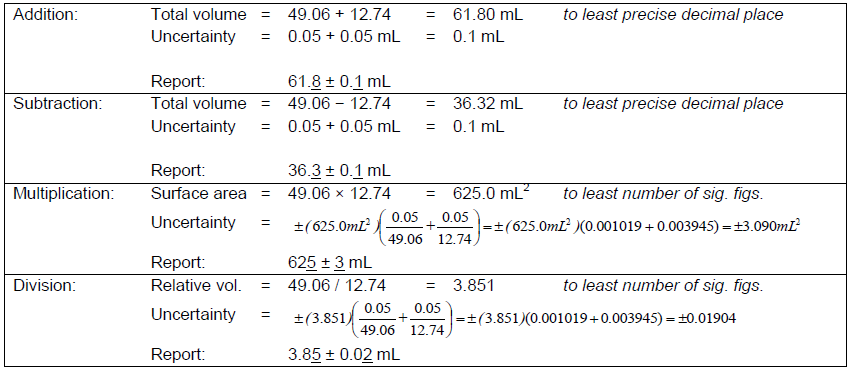
Absolute Uncertainty
refers to the actual uncertainty in a quantity
example: the average of three weightings is 6.3302 ± 0.0001 g, the absolute uncertainty is 0.0001 g
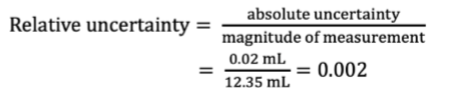
Relative Uncertainty
expresses the uncertainty as a fraction of the quantity of interest
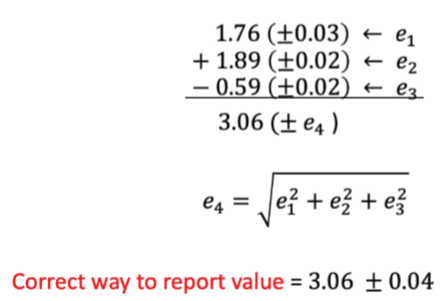
Propagation of uncertainty from random error for addition/subtraction
use absolute uncertainty
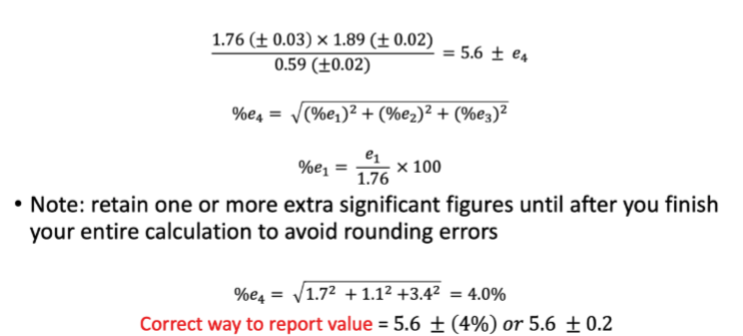
Propagation of uncertainty from random error for multiplication/division
use percent relative uncertainty
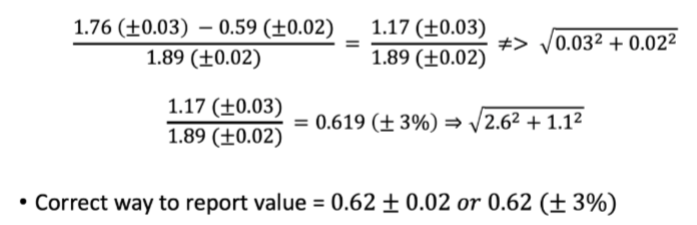
Propagation of uncertainty from random error for mixed operations
work on the absolute uncertainties (addition/subtraction)
then convert to relative uncertainties
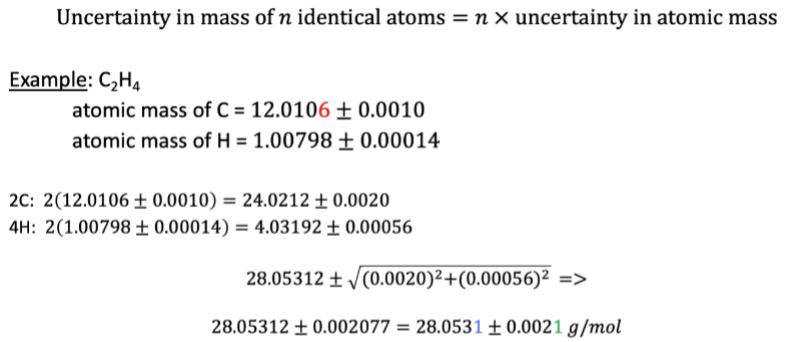
Propagation of uncertainty from random error for atomic mass (application)
Coefficient of Variation
the standard deviation expressed as a percentage of the mean value
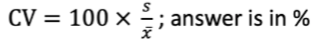
Student’s t test
a statistical tool used most frequently to express confidence intervals, to evaluate the probability that a certain measurement will be found in a specified data range, and to compare results from different experiments
*note! the slides show many example problems asking your to do t tests—practice those!
Analysis of Variance (ANOVA)
“t-test beyond two means”; post hoc test to determine significance
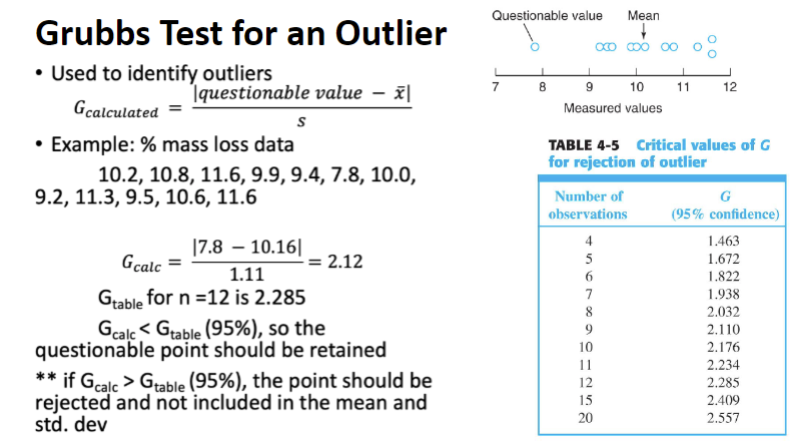
Grubbs Test
used to identify outliers