Basics of demand and supply
1/32
There's no tags or description
Looks like no tags are added yet.
Name | Mastery | Learn | Test | Matching | Spaced |
|---|
No study sessions yet.
33 Terms
What is utility
Satisfaction gained from consuming
What is marginal utility
Change in satisfaction when 1 extra unit of good is consumed
State the law of marginal utility
As more units of products are consumed, marginal utility decreases
State the law of demand
As price increases, quantity demanded decreases
Explain why the demand curve is downward sloping
Because the law of diminishing marginal utility
As marginal utility decreases, the price people are willing to pay for additional units decreases.
What shifts demand (6)
Income: Shifts normal goods demand to the right, shifts inferior good supply to the left. (units of inferior goods are replaced with normal goods)
Preference and taste: Popularity of product
Price of substitute good: Eg. Price for coke falls → Qd for coke rises → units of pepsi are replaced with coke, demand for pepsi shifts left
Price of complementary good: Eg. Price for cars falls → Qd for cars rises → More cars = more need for petrol → demand for petrol shifts right
Future price expectation: Price expected to rise in future, demand increases as consumers will buy no not later
Changes in population: More population = more consumers, demand shifts right
State the law of supply
As price increases, quantity supply increases
Long run
Period of time where all FOPs are free to increase and decrease
Short run
Period of time when 1 or more FOPs are fixed (usually land or capital)
Momentary period
In this instance, where all of the FOPs are fixed (eg. The amount of fish up for sale today)
What is total output
Total number of goods produced over period of time
What is marginal output?
Extra output from 1 additional unit of FOP
What is average output?
Amount of output produced per unit of variable FOP (labour)
Formula for marginal output
MP = ∆TP / (∆ unit of FOP)
Unit for average output
AP = TP / (unit of FOP)
What does it mean if MP is greater than AP
AP is increasing
Where is maximum average output?
When AP = MP
What does it mean when AP is greater than MP
AP is decreasing
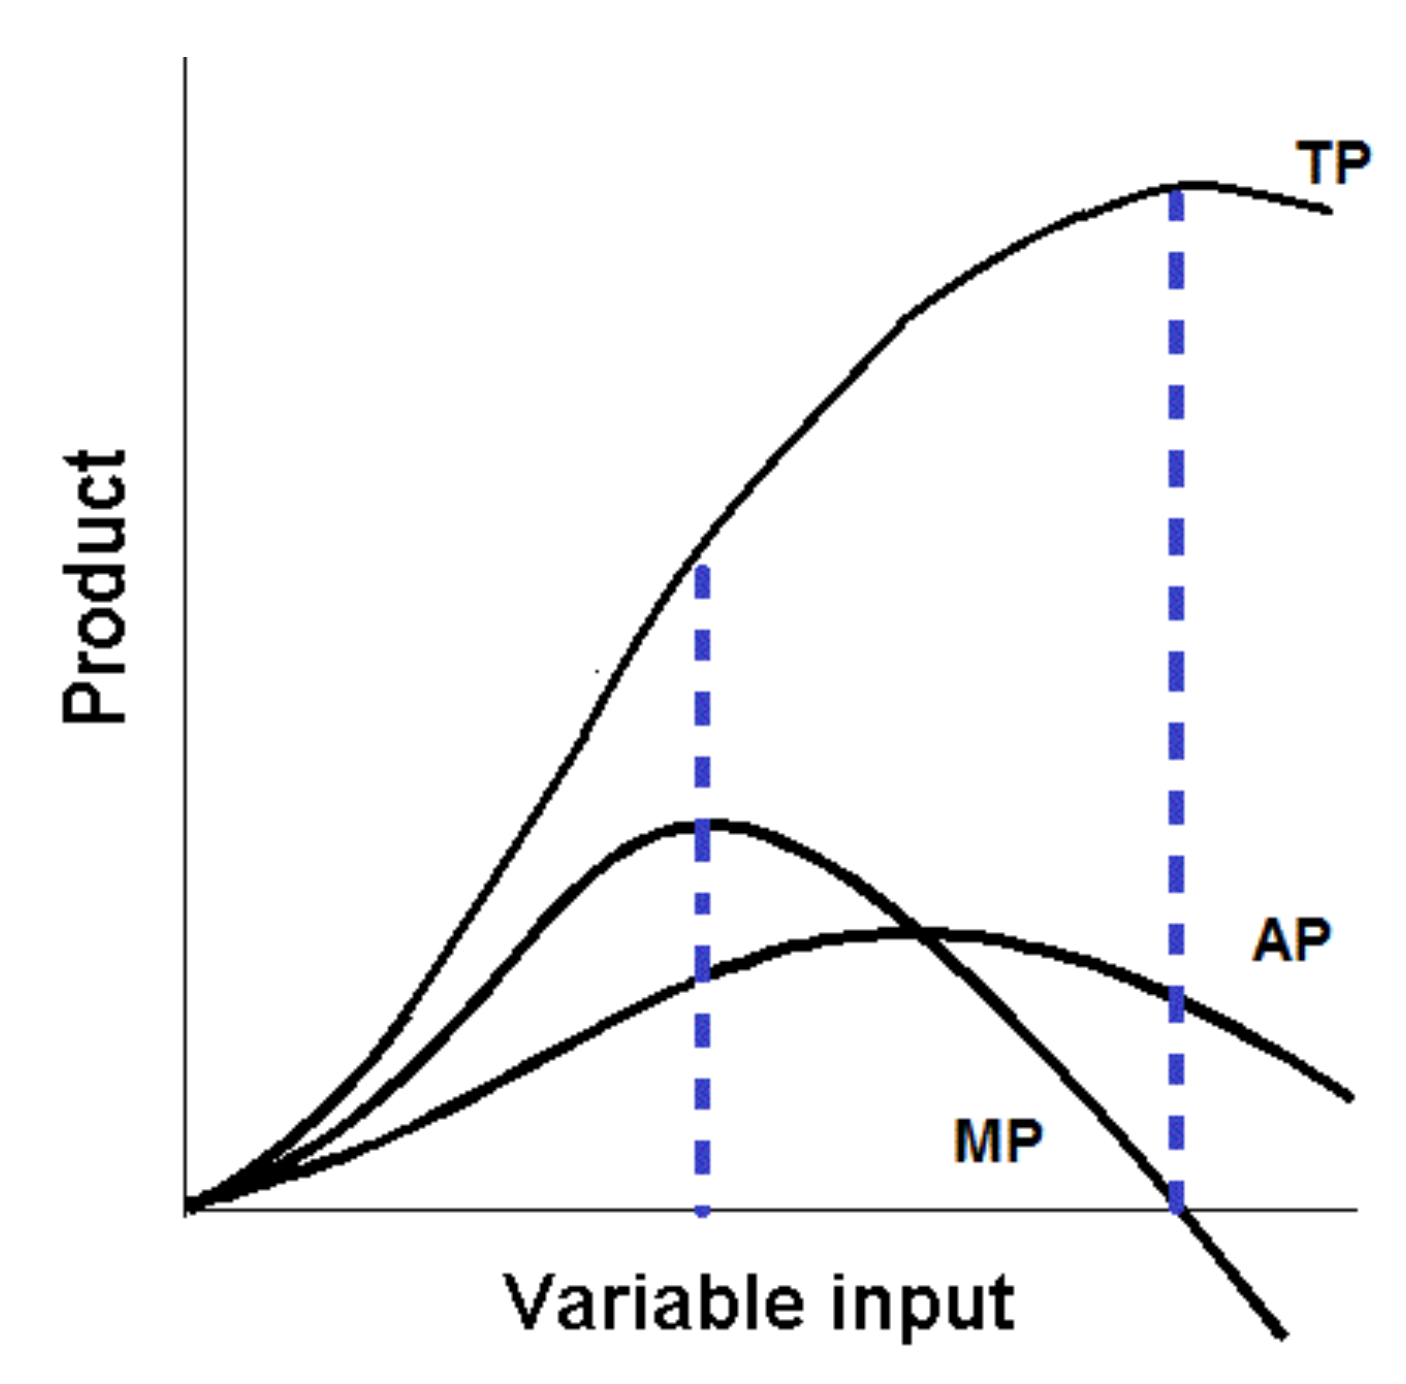
Draw the TP, AP and MP graph
What is Marginal diminishing returns
As more units of FOP are inputted into fixed land / capital, Marginal output increases at first, then decreases.
What is increase in marginal cost
As output increases, price per unit of output increases (efficiency decrease)
What explains the shape of supply curve
Supply curve is derived from the positive section of the marginal cost curve
What shifts the supply curve (8)
Cost of FOP: Increase in costs, shift supply left
Tech advancements: Lowers need for FOP → lowers costs, supply increase
Competitive supply: Eg. Price of butter increase → butter is more profitable → more whole milk is used to produce butter → No resources left to produce cream → supply for cream decrease
Joint supply: Price of butter increases → butter is more profitable → more whole milk is used to produce butter → skimmed milk is produced in the process → supply for skimmed milk increase.
Firm price expectations: Expected price increase = supply increase
Taxes: Increases COP → decreases supply
Number of competing firms: More competition → supply increase
Shocks: eg natural disasters
What happens if Qd > Qs in free market
Consumers compete for product and bids price up. As price increase, Qd decrease, Qs increase. Equilibrium met and market clears
What happens if Qs > Qd in free market
Producers will lower price to sell at surplus (profit maximise). As price decrease, Qd increase, Qs decrease. Equilibrium met and market clears
Where is allocative efficiency?
P = MC
OR
Ar = MC
(AR) is also MB
Where is production efficiency
MC = AC
Equation for consumer surplus
½ (P intercept of demand curve - P of consumers) * quantity
Consumer surplus definition
The amount of money that the consumers “earn” from paying a price that is lower than the highest price they are willing to pay
Equation for producer surplus
½ (P of producers - P intercept of supply curve) * quantity
Producer surplus definition
Amount of extra money producers “earned” from selling at a price higher than the lowest price they are willing to sell at.
What is maximum social surplus
Where the sum of consumer and producer surplus is maximised, also at allocative efficiency