MVS250-correlations
1/28
There's no tags or description
Looks like no tags are added yet.
Name | Mastery | Learn | Test | Matching | Spaced |
|---|
No study sessions yet.
29 Terms
What is correlation?
A statistic used to quantify the degree or association between two variables.
A single number that characterizes the strength and direction of the relationship between two variables.
The extent to which the direction and size of deviations from the mean in one variable are related to the direction and size of deviations from the mean in another variable.
looking at how two variables move around the mean.
What is an example of two variables that are correlated?
heart rate and oxygen consumption
What are the characteristics of a correlated relationship?
Form of relationship→ what does it look like graphed?
Direction of relationship→ is it positive or negative?
Strength of the relationship
What does the correlation tell us about two variables?
information about different characteristics of the relationship.
What is the “form of the relationship”?
either liner or non-linear
What is a linear relationship?
points in the scatterplot of two variables form a line.
as one variable increases/decreases, the other variable does the same.
pearson correlation
What is a non-linear relationship?
points on a scatterplot of two variables follow a pattern not well represented in a line.
DOES NOT mean two variables aren’t related
correlation could look like a curve
what is “the direction of the relationship”?
positive correlation: two variables move in the same direction as values increase/decrease.
x^+y^ or xdwn+ydwn
ex. heart rate and diastolic blood pressure
negative correlation: two variables move in opposite directions.
x^+ydwn or xdwn+y^
VO2 max + blood pressure
what is “the strength of the relationship”?
on a scale of -1.00-1.00; perfect correlation→ straight line
perfect correlation would be a straight line
strong relationship→ tightly packed
weak relationship→ data more spread out
unrelated→ scattered points
How is correlation measured?
-on a scale of -1.00-1.00; higher absolute value→ stronger relationship
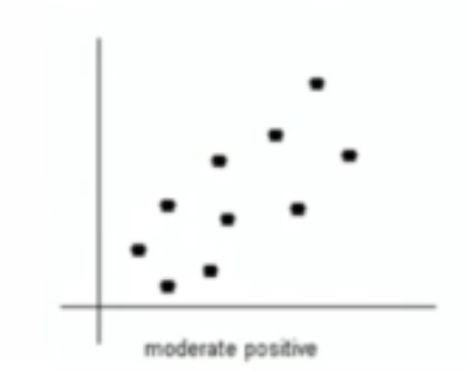
What type of relationship is this?
moderate positive
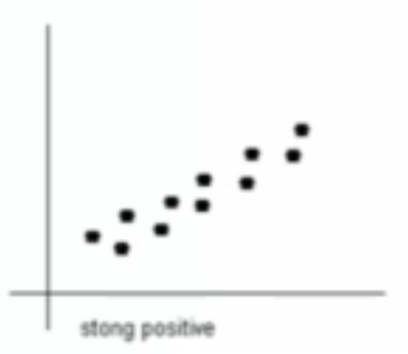
What type of relationship is this?
strong positive
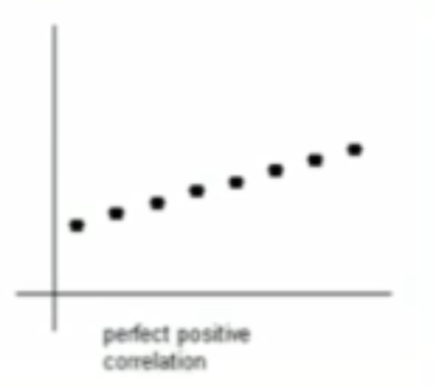
What type of relationship is this?
perfect positive correlation
What type of relationship is this?
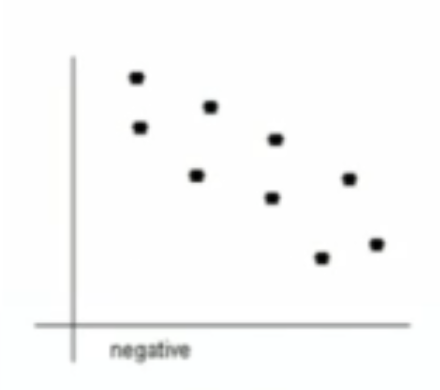
negative (moderate)
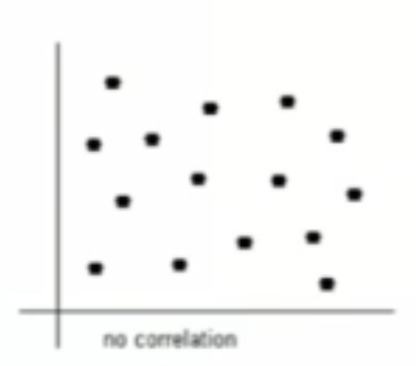
What type of relationship is this?
no correlation
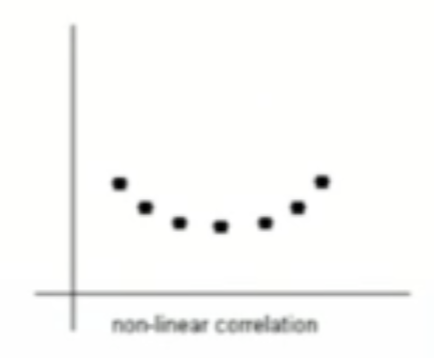
What type of relationship is this?
non-linear correlation
What do the graphs of correlation show us?
The deviations from the mean
What relationship is real data typically?
moderate positive
What are the size/strength of perason correlations of these graphs?
small/weak: r<.30
moderate: .30<r<.49
large/strong: r>.49
correlation _____ mean causation.
DOES NOT
What is the Pearson correlation?
measures the strength and direction of linear relationships between two variables.
properties
identified by “r”→ measures the strength of the relationship
indicates - or + association
0→ no linear relationship
correlation of x with y is the same as y with x (flipping the axises)
agnostic to units
very sensitive to outliers
What is the formula for Pearson correlation?
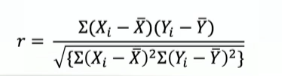
What does the numerator of the Pearson correlation equation mean?
deviations co-occuring, with both variables from the mean.
What does the denominator of the Pearson correlation equation mean?
overall variability in each individual variable.
Is the pearson correlation coefficient computed for sample or population data?
sample data.
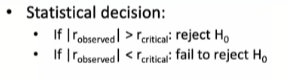
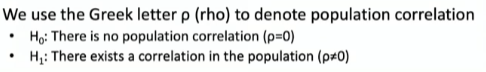
the hypothesis testing for the pearson correlation coefficient is trying to see whether or not…
there is correlation
What does the hypothesis testing look like?
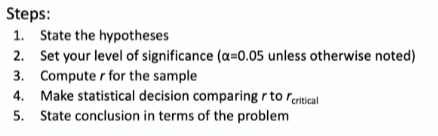
What are the steps for hypothesis testing?
what would the degrees of freedom be for the pearson correlation coefficient?
degrees of freedom=npairs - 2
higher sample size→ more degrees of freedom