Year 11 Economics
1/124
There's no tags or description
Looks like no tags are added yet.
Name | Mastery | Learn | Test | Matching | Spaced | Call with Kai |
|---|
No analytics yet
Send a link to your students to track their progress
125 Terms
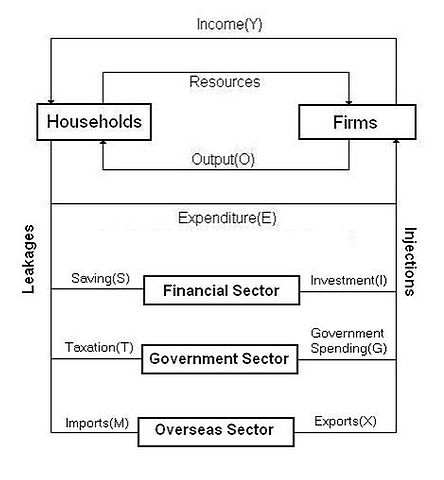
Circular Flow Model
How Goods, Services and Money flow through an economy
Qualitative Measures (Personal Preference)
Genuine progress indicator (GPI)
Total Quality of Life Index (TQLI)
Human Development Index (HDI)
Quantitive Measures (No./Stats)
Economic Growth
Level of Unemployment
Inflation
Need
Resource necessary for survival e.g. shelter
Want
Resource not needed for survival e.g. phone
Good
Tangible item/object e.g. pen
Service
act that someone performs e.g. gardener
Consumer
purchases and uses goods/services
Producer
creates/invents goods/services
Resources/Factors of Production
Capital - Tools
Enterprise - Idea
Land - Natural Resources
Labour - Human effort
Current Production
Production in the current period. GDP includes only income and expenditure that takes place in a specific interval of time.
Opportunity Cost
The missed choice/event when picking between things [or] next best thing that is forgone
Monetary Cost
Financial cost of choice/event
Economics
The study of how people, the government and businesses choose to use their scarce resources to satisfy their unlimited needs and wants.
Economic Systems
The structures that a country uses to make economic decisions; generally divided into capitalist (Producers Choice) and Socialist (Government Production)
Economic Problem
Unlimited needs and wants but limited resources.
Economic Growth
The ability of the economy to produce increasing quantities of goods and services. The key features are the factors of production.
Employed
Individuals over the working age of 15 that work at least one hour per week.
Final Goods/Services
GDP - new good/service which is the end product of the production process that is purchased by final user.
GDP (Gross Domestic Product)
The Market Value of all Final goods/services produced in a country during a period of time.
Inflation
Sustained increase in price for goods and services in an economy.
Labour Force
Individuals over the working age who are willing and able to work. (Employed + Unemployed)
Market Value
Production is valued in dollar terms as assigning monetary values provides a common measure for combining dissimilar goods.
Participation Rate (PR)
% of working age population in labour force
(Labour force/Working age Population) x 100 = PR
Scarcity
When wants are far greater than the available supply of time, goods, services, resources and income.
Surplus
Too much of a product/supply in the market.
Unemployment
% of population who aren’t working but are actively looking for work or work less than 1 hour per week. Target Rate - 4.5%. Current Rate - 4%
Unemployment Rate (UR)
% of Labour Force unemployed.
No. of unemployed/Labour force x 100 = UR
Economic Growth Importance/Effects
Population Growth
Improvement in product quality
Replace goods and services that have been consumed
Measuring GDP
Aggregate Demand = [C+I+G+X-M] (Consumer Expenditure + Investments + Government Expenditure + Export - Imports)
Less than 1 contracting, more than 1 expanding.
Limitations of GDP
Doesn’t measure other living factors such as the environment
Doesn’t include non-market production
Doesn’t provide info about distribution of products
Involves Estimation of production
Rates of Growth
3-4% is Australia’s ideal growth rate. Less than 3% is too slow for our growing population but 4% is unsustainable and will lead too our economy crashing.
Unemployment Causes
Cyclical
Structural
Seasonal
Frictional
Cyclical Unemployment
When the level of consumer expenditure falls. Reasons for this can be high interest rates, poor economic conditions overseas, reduction in income.
Structural Unemployment
Changes in ways goods/services are produced, e.g. machines take over jobs
Seasonal Unemployment
Termination of jobs at the same time each year due to seasons changing. e.g. farming
Frictional Unemployment
Occurs during the period when people finish one job and starts another.
Effects of Unemployment
Deteriorating living standards
Decreased national production
Changed government budget position.
Production Possibility Frontier
Demonstrates concept of opportunity cost, scarcity and GDP
Simplifies real world economy
Demand Pull Inflation
Demand > Supply, Price increases
Causes of Demand Pull
Increase in income
Increase in business confidence
Increase in consumer optimism
Low interest rates
Increase in exports
Cost Push Inflation
Increase in price of goods and services due to increase in price of production
Causes of Cost Push
Increase in wages
Increase in resources
Increase in taxes
Increase in utilities
Trading partners experiencing inflation
Measuring Inflation
ABS (Australian Bureau of Stats) use Consumer Price Index (CPI). CPI measures average change in price levels of a market basket of goods and services purchased by a typical household
Basket of Goods Content
Food, Clothes, Housing, Transport, Recreation, Communication, Health, Education, Alcohol and Tobacco, Insurance, Furnishing
Effects of Inflation
Causes local producers to lose out to overseas competitors: raise in domestic prices leading others to choose overseas products instead.
Undermines Economic Growth: consumers spend less, producers make less, less investments.
Change in allocation of Resources: when inflation rises people tend to save money and/or spend it on unproductive resources such as houses. This is a bad thing as less money is being spent on goods and services.
Affects Income: purchasing declines, businesses have to let workers go to keep costs low or increase in price to survive causing less power in purchasing.
Government intervention into the economy
Redistributive, Allocative, Stabilisation (RAS)
Redistributive
Government measures redistributed income and provides support to various groups in society by ensuring a minimum level of income for all Australians. [Welfare, progressive tax brackets, provision of health services, compulsory superannuation.]
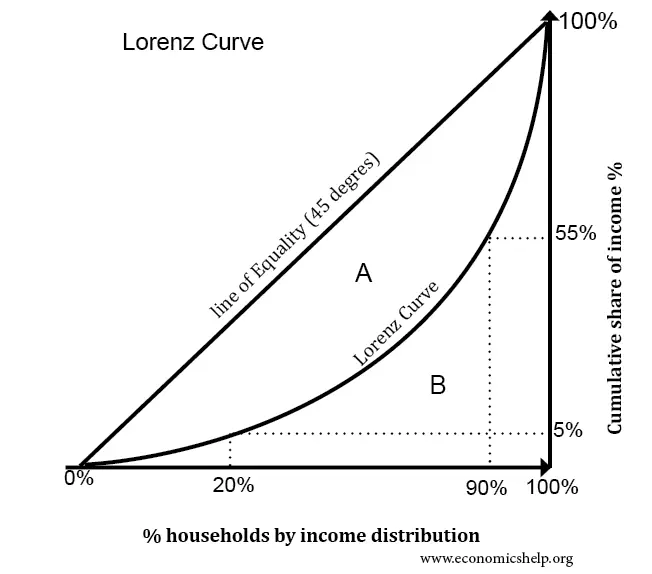
Lorenz Curve
used by governments around the world to measure income distribution in their country
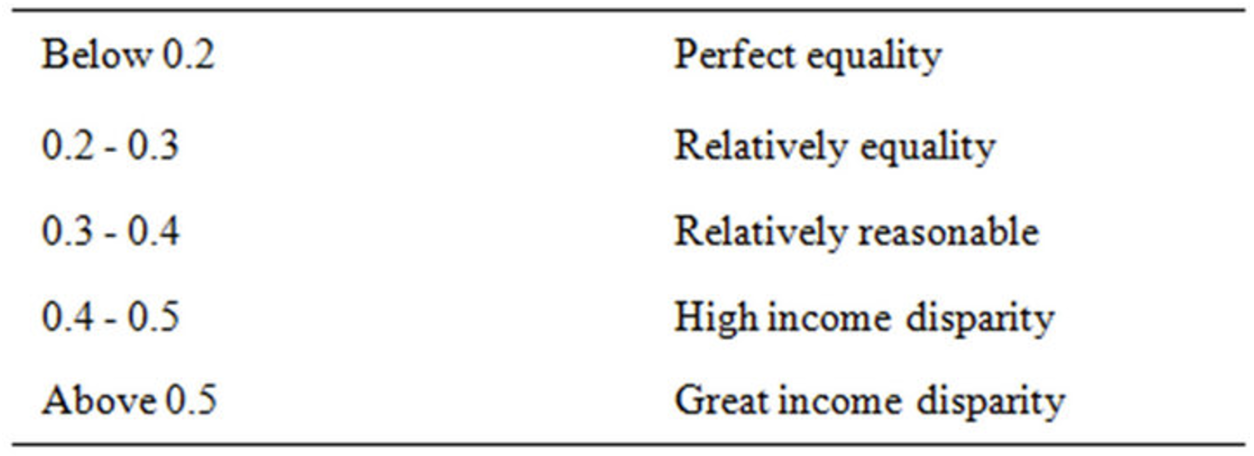
Gini Index
indicates the degree of curvature of the line [in Lorenz curve]. It’s the ratio of the area between the line of equality and the curve and the area of the triangle between the line and total population [on x-axis].
Allocative
when market inefficiency arise the government steps in to reallocate resources to stop market failure e.g. public schools, healthcare, lamp posts, ciggies.
Allocative: Reasons
Market may produce socially undesirable products
Market may not produce socially desirable items
Provide goods and services private sectors don’t
Making sure resources are allocated equitably
[inefficiency is not always a bad things]
Externality
External cost/repercussion of a choice/option or the benefits that come with it [unforeseen consequences (negative or positive)]. Cost or benefit imposed on a third party and not taken into account. Market is not efficient when there is and externality.
Private Cost
expenditure incurred by producers and consumers by producing/buying goods and services.
Private Benefits
profits made by producers and consumers through selling/consuming goods and services
Social Cost
total cost of producing goods/services (private + additional costs on society due to transaction)
Social Benefit
total benefit from consuming goods/services (private + additional benefit on society due to transaction)
Negative Externality
Cost on 3rd party due to economic transaction. When this is in play the government wants to reduce production and consumption [market based policies and command-and-control policies].
Positive Externality
Benefit on 3rd party due to economic transaction. Not always a good thing. The government wants more consumption and production (generally) when a positive externality exists [sometimes they put in subsides].
Market Based Policies
Taxing the final good or service
Command and Control Policies
Regulations such as no advertising certain things e.g. ciggies
Stabilisation
Keep growth steady and sustainability. It regulates economic growth/production/performance and it is shown in budgets.
Australia’s Stabilisation Points
Sustainable economic growth: 3-4%
Stable Inflation: 2-3%
Unemployment: 4-5%
Stabilisation is done because…
Inflation - economy is moving too quickly, demand price is rising and the cost of resources is rising.
Unemployment - economy moving to slowly, demand falls and businesses may lay off workers.
Government Revenue
Personal income 39.0%
State and local tax 19.0%
Company tax 19.0%
GST 12.0%
Other 11.0%
Government Spending
Social security and welfare 35.6%
Other purposes 18.9%
Health 16.7%
All other function 11.3%
Education 7.3%
Defence 5.8%
General public service 4.4%
Fiscal Policy
government intervenes in the economy using government spending to stabilise [depends on growth of economy]
Contractionary Fiscal Policy
Reduce governments spending and/or increase taxes if economy is growing too quickly.
Expansionary Fiscal Policy
increase government spending and/or reduce tax is economy if growing too slowly
Boom and Recession
Boom - growth strong, unemployment low, inflation high
Recession - growth weak, unemployment high, inflation low
Budget Deficit
Spending more than collecting (expansion effect). This increases inflation, decreases unemployment and increases GDP with their being more economic activity.
Budget Surplus
Spending less than collecting (contractionary effect). This decreases inflation, increases unemployment and decreases GDP as there is less economic activity.
Questions when selling
What to produce? [Consumers determine what is produced]
How much? [Level of demand]
How to produce? [Profit motive]
For Whom? [What audience are you reaching]
Price Mechanism
The process by which buyers and sellers interact to determine the goods and services [price, type, amount] in a market. Within a market the force of demand and supply dictates the market price.
Law of Demand
As the price of a good/service decreases, the quantity demanded increases, vice versa. It shows a inverse relationship or a negative relationship.
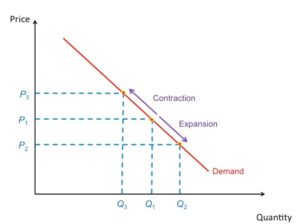
Demand Movement
When price changes for a good. When price falls, quantity demanded rises [expansion]. When price rises, quantity demanded falls [contraction].
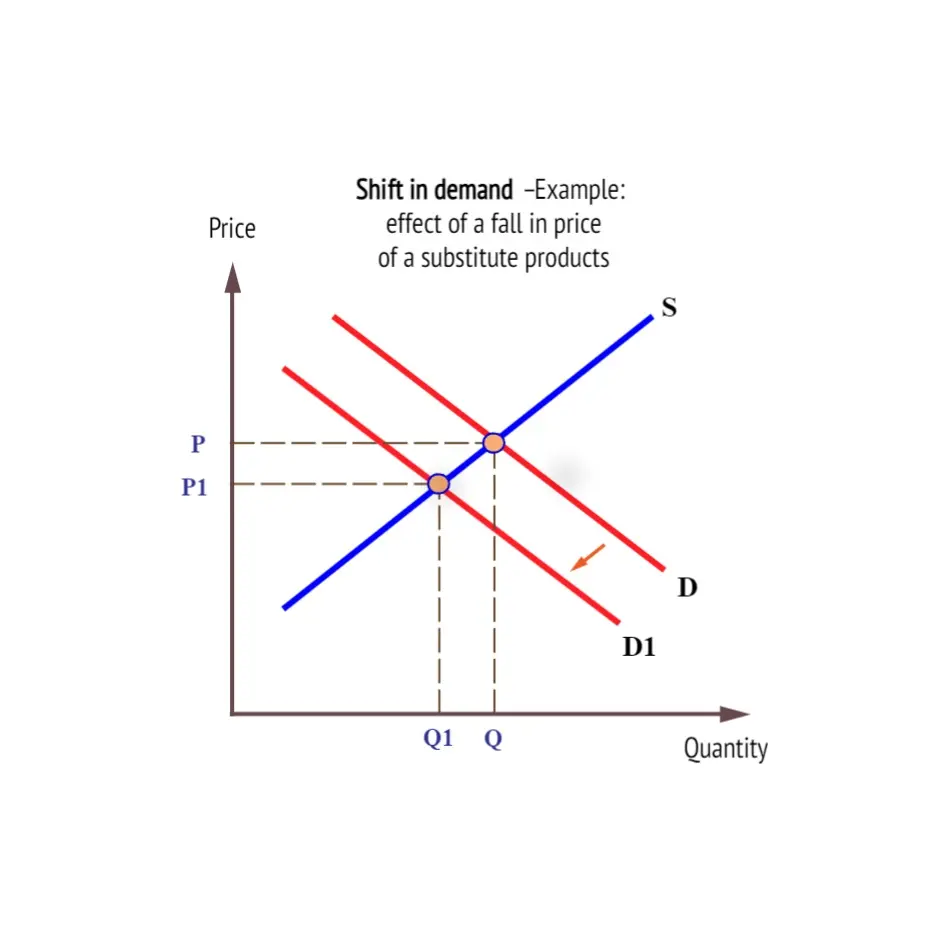
Demand Shift
Occurs when factors other than price, such as consumer preferences, competitors price or income change, leading to an increase or decrease in demand at all price levels.
Law of Supply
When price falls, quantity falls. When price rises, quantity rises. It has a positive relationship between price and quantity.
Price of Inputs
Resources used in production
Price of Substitutes
Alternative products a firm may produce based on profitability
Technology Change
Output increases due to improvements made by technology that increases efficiency of resources and time.
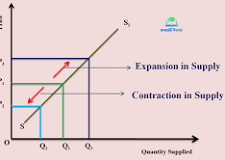
Supply Movement
A change in quantity supplied that is caused by a change in price.
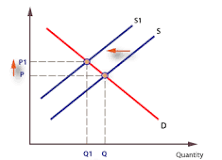
Supply Shift
A change in supply resulting from factors other than price, such as production costs or market conditions.
Equilibrium
The purpose of market is to bring buyers and sellers together hence the price that clears the market is the price that balances the buying intentions of the consumer with the selling intentions of the producer.
Surplus in Graph
Price of good/service is above equilibrium price.
Shortage
Price of good/service is below equilibrium price.
Market
The facilitated area that allows exchange of goods and services between buyer and seller.
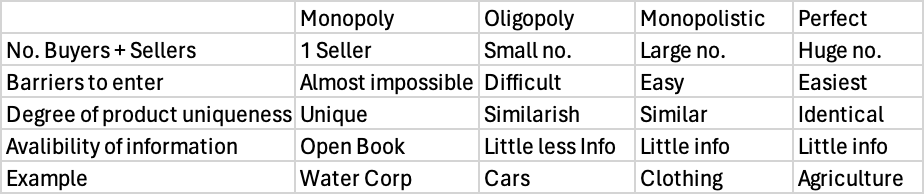
Types of Markets
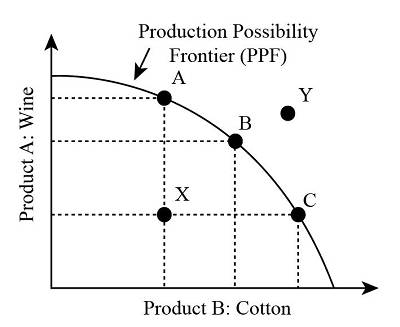
The Production Possibilities Frontier (PPF)
It is a graph that depicts all possible combinations of output from two items utilising existing resources and technology. The PPF encapsulates the ideas of choice, tradeoffs, and scarcity.
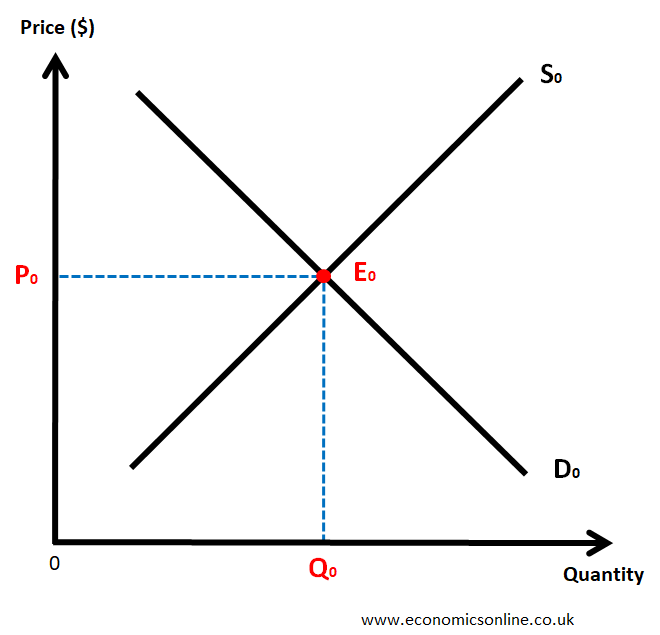
Economy Graph
Expansions happen above the equilibrium. Contractions happen below the equilibrium
Effects of Leakages
Money is leaving the economy which is decreasing the flow of income which could’ve help benefit the economy.
Effects of Injections
Increases the money in the economy, benefitting consumers and producers as there is a greater flow impacting buying and selling.
Demand Pull Effect
Due to the excess increase of demand it causes a rise in price to balance out the quantity supplied vs demanded which increases inflation.
Cost Push Effect
Due to the increase in price of resources it causes and decrease in supply and increase in final product. To balance the demand it causes an increase in inflation.
Reason Governments Intervene in the Economy
To help stabilise markets, regulate transactions, provide institutional frameworks, and enforce rules around contract law and property rights. Governments can also intervene when markets fail in the form of bailouts and other emergency measures.
Microeconomics
Study of decisions made by individuals, households, firms and industries and understanding how markets and prices work to allocate resources between competing industries. It focusses on the singular markets and segments of the economy.
Macroeconomics
Study of performance and decision making of the whole economy (Inflation, Unemployment).
Shortage vs Scarcity
Shortage is when supply is limited while Scarcity is when wants exceed resources.
Capital
The machinery, equipment and physical plant used to produce product e.g. tractors.
Enterprise
Creative ability and ideas individuals harness to seek profit through developing new/existing products.