epi
1/143
There's no tags or description
Looks like no tags are added yet.
Name | Mastery | Learn | Test | Matching | Spaced | Call with Kai | Chat |
|---|
No analytics yet
Send a link to your students to track their progress
144 Terms
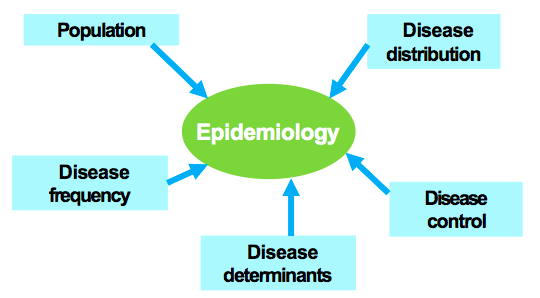
what is epidemiology
the study of the distribution and determinants of health-related states and events in populations and the application of this study to control health problems
looking at how health varies over time
key aspects of epidemiology
population
disease distribution
disease frequency
disease determinants
disease control
basic assumptions of epidemiology
health and disability do not occur at random
causal factors can be identified through systematic investigation of human populations
identifying these factors can lead to preventative interventions
basic vs. clinical vs public health sciences
basic studies cells, tissues, animals
clinical studies patients
public health studies populations or communities
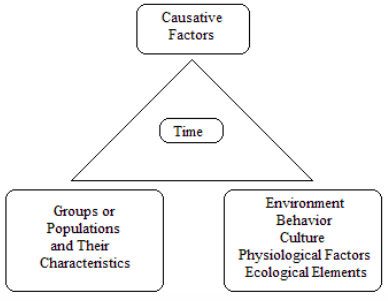
Epidemiologic Triad
there are factors associated with increased risks of human disease
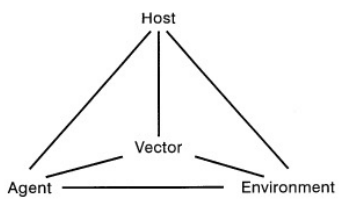
host characteristics influence an individuals’ susceptibility to disease
age
sex
race
religion
customs
occupation
genetic profile
marital status
family background
previous disease
immune status
agent characteristics
infectivity—ability to invade a host
pathogenicity—ability to cause disease
virulence—ability to cause death
types of agents and examples
biologic
bacteria, viruses
chemical
poison, alcohol, smoke
physical
trauma, radiation, factor
nutritional
lack, excess
environmental factors associated with increased risk of human disease
temperature
humidity
crowding
housing
water
food
air pollution
noise
altitude
racism
income and educational disparities
status and social class
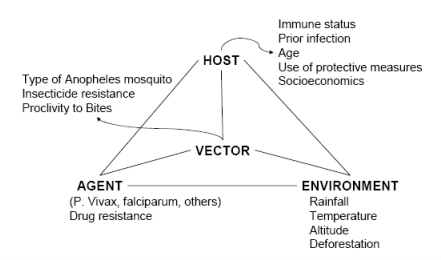
factors involved in malaria transmission
direct modes of transmission
person-to-person contact (respiratory, orogenital, skin)
examples: HIV, measles, influenza
indirect modes of transmission
common vehicle (contaminated air, food, water supply)
single, multiple, or continuous exposure
ex. salmonellosis
vector (animals, insects)
ex. rabies, yellow fever, malaria
fomites—inanimate objects (doorknobs, toothbrushes, etc.)
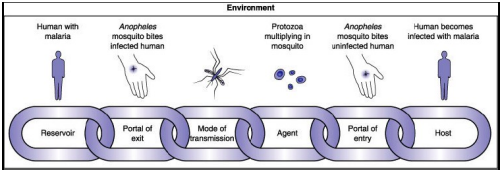
reservoir
the habitat (living or nonliving) of the infectious agent
the reservoir consists of:
symptomatic cases
carriers
animals
inanimate objects (water, food, soil, air)
types of carriers
incubatory (capable of transmitting prior to onset of symptoms)
inapparent (infected but have no symptoms)
convalescent (after acute illness are still infectious)
chronic (harbor infectious agents for an extended period of time, (e.g. typhoid)
chain of infection process—malaria
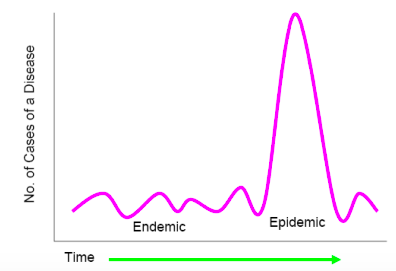
endemic
occurring at or near the usual rate of occurrence
epidemic
occurring in clear excess of normality
pandemic
epidemic affecting several countries or continents
common-vehicle exposure—where all cases are exposed to one agent either via
single exposure—food served at a luncheon
multiple exposure—same food served more than once
periodic exposure—water supply contaminated with sewage bc of leaky pipes, contamination may be periodic depending on changing water pressure in the water supply
continuous—a constant leak leads to persistent contamination
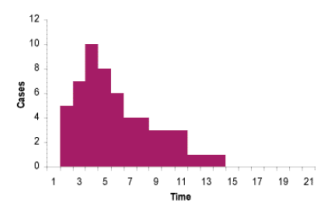
single exposure
typical exposure of a single-exposure, common vehicle outbreak-the most common form is foodborne outbreaks, in which a large population is exposed to the disease agent for a short period of time
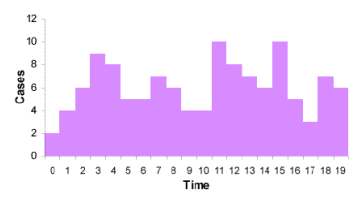
continuous or multiple exposures
in the case of continuous or multiple exposures, there are several peaks, and the incubation cannot be easily expressed
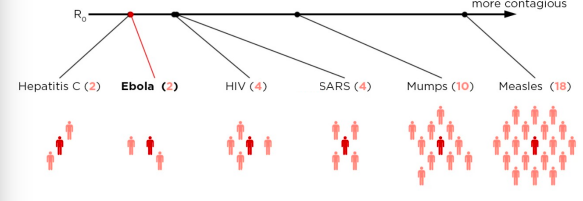
R0—basic reproduction number
represents the average number of individuals infected per single case of a disease
used to describe contagiousness of an infectious agent
in a fully susceptible population, what % of cases that an infected person contacts will become infected?
influenced by host, agent, and environment
R0
the number of people that one sick person will infect (on average) is called R0
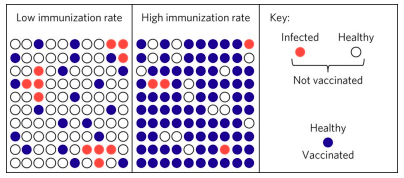
herd immunity
the resistance of a group to an attack by a disease to which a large portion of the members of the group are immune
optimal level will depend on disease itself
must be high (some estimates (95%) to prevent spread of highly contagious diseases (e.g. measles)
must be even higher to prevent spread in highly dense populations (99%)
if lower than optimal levels, can result in disease “targeting” those most susceptible (elderly, immune compromised, pregnant women) and many diseases are more virulent when contracted at older ages thereby raising the mortality rate
requirements for herd immunity
the disease agent must be restricted to a single host species within which transmission occurs
if there is a reservoir in which the agent can exist outside the human host, herd immunity not possible
infections must induce solid immunity
if immunity is only partial, then won’t build up a large population of immune people in the community
depends on random mixing
the probability of an infected person encountering every other individual in the population is the same
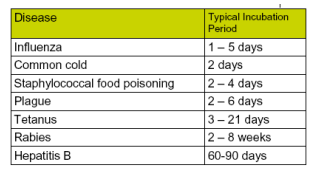
incubation period
the interval from receipt of infection to the time of onset of clinical illness
incubation periods for selected infectious diseases
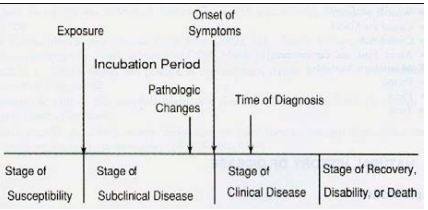
clinical and subclinical disease?
stages in the natural history of disease
stage of susceptibility
exposure
subclinical disease stage
pathologic changes is before the onset of symptoms, there if you look hard enough for it
onset of symptoms
clinical disease stage
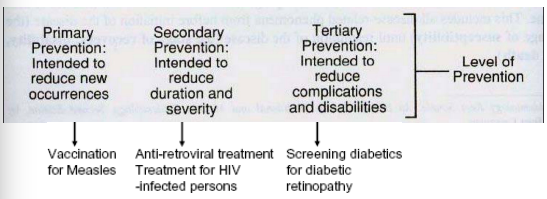
levels of prevention
primary prevention (activities that help prevent a health care problem)
secondary prevention (prevention of progression, e.g., from pre or subclinical to clinical)
tertiary (early treatment of disease and prevention of complications)
major factors contributing to emergence and re-emergence of infectious disease
microbial adaptation and change
human susceptibility to infection
climate and weather
changing ecosystems, human demographics and behavior
international travel and commerce
breakdown of public health measures
poverty and social inequality
war and famine
lack of political will, vaccine hesitancy
bioterrorism
human habits—consuming using animal products
advanced epidemiology triangle
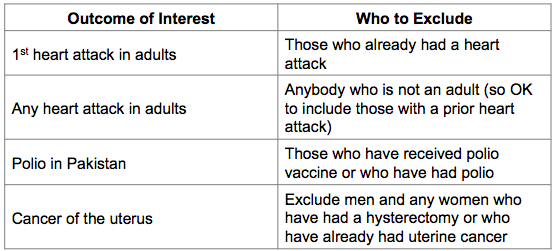
what is a “case”
someone with the outcome of interest
operational definition to validity (accurately) and reliably (consistently) identify who has the health problem
based on self-reported symptoms or behaviors, medical examination/clinical diagnoses (reported various ways)
what is the scope?
geographic area, population, time period
proportion—a part relative to a whole
numerator in denominator
e.g. proportion or % of children in my son’s daycare class with a runny nose
ratio—comparison of any two values
numerator and denominator can be unrelated
e.g. sex ratios
rate—estimate of characteristics of interest (i.e. disease or symptom) in relation to population or period of time
e.g. birth, fertility or morality rates
birth rate
birth rate=(number of live births in a population during a specified time period/population from which births occurred) x 1,000
fertility rate
fertility rate = (number of live births in a population during a specified time period/population of women aged 15-44 years) x 1,000
morbidity
morbidity is used to refer to the extent of disease or disease frequency within a population
two measures of morbidity: prevalence or incidence
prevalence
prevalence is the proportion of new and existing cases of a health condition in a study population at a point in time
describes the ‘burden’ of a disease or health condition in a population during a specified time period
prevalence formula
prevalence = (number of new and existing cases/number of persons in population at a specified time) x 100
types of prevalence
point prevalence
number of existing cases at a point in time
most commonly used
period prevalence
number of existing cases during a defined period (i.e. a five year prevalence)
less frequently used
incidence
incidence measures how frequently new cases of a health condition occur over a period of time (a measure of risk)
an incident case = when an individual changes from being susceptible to being diseased
two ways to express incidence
cumulative incidence: number of new cases per number of persons at risk during a specified period of time
incidence rate (or density): number of new cases in the population at risk per unit of time (person-time units at risk)
cumulative incidence
the proportion of disease-free individuals in a population who become ill during a defined time period
(number of new cases during a specific time period/number of persons at risk of developing disease during that time period) x 100
examples of who’s at risk
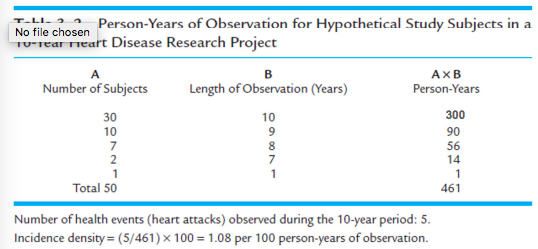
incidence rate (density)
number of new cases during the time time period/total person-time of observation
person-time = sum of periods of time at risk for each member of population (e.g., person-years)
calculating person time example
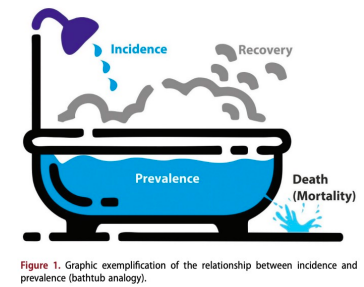
relationship between incidence and prevalence
in a stable population (where rates do not change and in and out migration are equal)
prevalence = incidence x duration of disease
duration of disease determined by mortality and recovery
crude mortality rate
mortality rate from all causes (per 1,000 population) is known as the crude or all-cause mortality rate:
crude mortality rate = (total # of deaths from all causes during a given time period/# of persons in population at that time period) x 1,000
a mortality rate is an incidence rate of deaths since it is the occurrence of new cases divided by the total population at risk over a specified period of time (usually during a year)
specific mortality rates
can specify mortality rates for specific age group
can specify for specific disease
*denominator must reflect the population group studied*
can specify for multiple criteria (age group and specific disease)
cause-specific mortality rate
cause-specific mortality rate = (number of deaths from a specific cause occurring during a given time period/population from which death occurred) x 10^n
maternal mortality rate
maternal mortality rate = total number of maternal deaths during a specific time period/number of live births during that time period) x 100,000
case fatality rate
used when you want to know how many of those infected or inflicted with disease will die (percent)
case fatality rate = (number of deaths from a specific disease during a specific time period/number of cases of the disease during the same time period) x 100
factors that might impact morbidity and mortality rates include
changes to medical and diagnostic standards (revisions in the ICD system, improved screening methods)
place (environmental changes, regional differences in standard of care, etc)
person (age, sex, ethnicity, social habits)
comparing crude mortality rates across populations
we can’t compare crude mortality rates across populations because of age distribution differences across populations
age distribution—the most important factor that influences mortality AND that can differ between populations
must adjust crude death rate by age in order to make appropriate comparisons
public health surveillance
uses data to monitor health problems to prevent and control them
public health surveillance is the continued watchfulness over the distribution and trends of incidence [of a disease] through the systematic collection, consolidation, and evaluation of morbidity and mortality reports and other relevant data
why collect surveillance data?
Assess population health status
monitor temporal trends
detect outbreaks
define objectives, priorities, and strategies
target interventions
evaluate interventions, effectiveness of control efforts
generate research hypotheses
questions that surveillance data can answer
what is the infant mortality rate?
are we advancing towards predefined health goals (ie, reducing cancer rates)?
has there been an increase in unsafe sex among MSMs?
are smoking rates declining in teens?
what factors are associated with West Nile virus?
is flu season here? Is it more severe than usual?
what neighborhood has the highest rate of asthma?
steps in conducting surveillance
Identify, define and measure health problem of interest and objective of surveillance problem
collect and compile data about the problem
analyze and interpret these data
share data with those responsible for control
monitor and evaluate usefulness of surveillance problem
*does not include actions to control the problem
criteria for selecting and prioritizing health problems for surveillance (CDC)
public health importance
incidence, prevalence, severity, consequences/mortality, socioeconomic impact, communicability, public perception, international requirements
ability to prevent, control, treat the problem
capacity of health system to implement control measures
speed of response, economics, availability of resources, ability to ensure people get the treatment they need
case definition slide?
International Classification of Disease (ICD)
standard diagnostic tool for mortality and morbidity (WHO)
used to:
classify disease and other health problems
identify health trends/statistics globally
reimbursement and resource-allocation decisions
recorded in many different health and vital records
most countries in world use it to report mortality data
current version is ICD-11, national adaptations in many countries
sources of data for surveillance
three sources: individuals, environment, healthcare providers/institutions
information about disease course, size of population under surveillance and geography are helpful
collected continuously, periodically, or defined period
types of data sources
Primary—environmental monitoring, syndromic surveillance, notifications, registries (including vital statistics)
Secondary—medical records, school records, other administrative data, surveys
active surveillance
go and collect health data
health department contacts healthcare providers or labs about conditions to identify cases
community-based surveys are conducted to measure particular conditions in a neighborhood
health inspectors go to particular facilities to measure levels of infection
advantage—useful when need to identify all cases
disadvantage—requires more resources
passive surveillance
health departments rely on healthcare provider or labs to report cases of disease
advantage—efficient, requires limited resources
disadvantage—incomplete due to underreporting
sentinel surveillance
monitoring through a specific site or partner
what to do with surveillance data once it’s collected
analyze data by person, time, and place
interpret data
e.g., why might prevalence or incidence have increased or decreased over time
disseminate data and results to key stakeholders
e.g., MMWRs, surveillance reports
evaluate and improve surveillance systems
timely? useful? what resources are needed?
sources of epidemiologic data
statistics from vital registration systems (birth, death)
reportable disease statistics
disease registries
morbidity surveys of general population
insurance data
clinical data sources
school health programs
census data
economic data
peer-reviewed articles and systematic reviews
reports from health organizations (e.g., CDC, WHO), advocacy groups
registries
centralized database for documenting or tracking health events or persons over time
certain registries are required by law (vital statistics)
reported by health care providers, health care facilities, morticians/funeral directors, patients
examples:
vital statistics
immunizations/genetic conditions
disease-specific or treatment-specific (e.g., specific cancers)
exposure-specific (9/11)
vital statistics registration system in the US
All deaths are recorded and reported to local health departments and to the state office of vital statistics
Reports of vital event statistics including deaths are reported to the National Center for Health Statistics
death certificate data
Date of birth and of death (for accurate age)
Stated age
Place of death
Place of residence
Occupation
Sex
Marital status
Cause of death (ICD-11)
Other information may include type of injury, place and time of injury, etc.
limitations of death certificates
certification of cause of death (e.g., for an elderly person with a chronic illness, cause of death may be unclear)
lack of standardization of diagnostic criteria
stigma associated with certain diseases, e.g., AIDS, suicide, which may lead to inaccurate reporting
coding errors and changes in coding (e.g., ICD codes)
surveys
systematic, structured method of gathering information to quantitatively describe population
census (entire population) vs. sample
typically cross-sectional, some conducted periodically
many are population-based
Uses
understand extent of health problem
conduct surveillance and examine trends
estimate and target needed resources
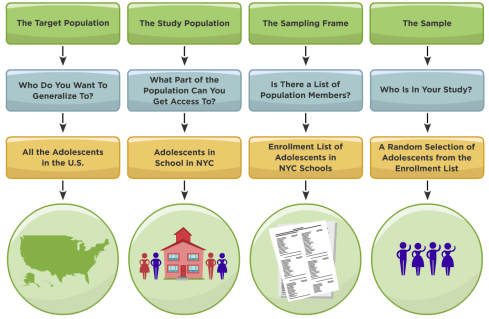
sampling methodology
strengths and limitations of surveys
Strengths:
population-based/representative
many conducted periodically, can be used for surveillance
cover wide breadth of important public health topics and include many demographics
often use validated measures
Limitations:
not fully representative
not always generalizable
self-reported information
could change over time reflect demographic change only?
not timely
not easy to add or change survey questions
objective of epidemiological studies
quantify the burden/risk of disease in specific populations
identify causes of disease to inform prevention
test strategies for prevention and control
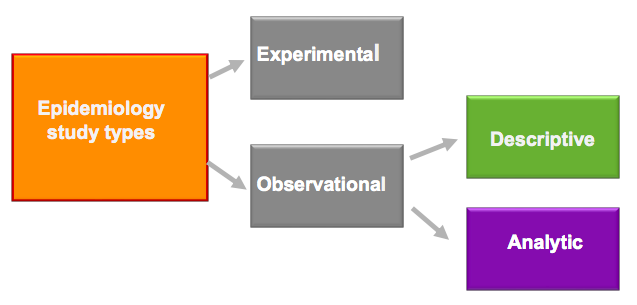
types of study and approach
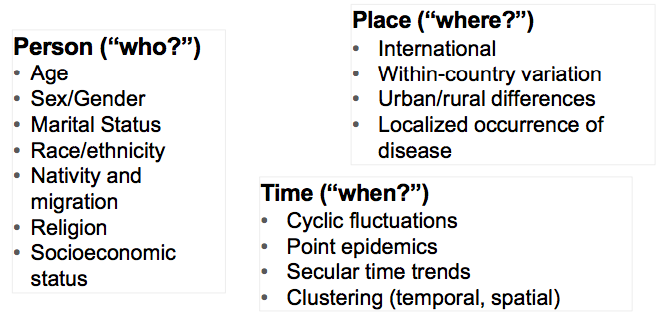
descriptive epidemiology questions
person, time, and place
When was the population affected?
Where was the population affected?
Who was affected?
person, place and time characteristics
types of descriptive and experimental studies
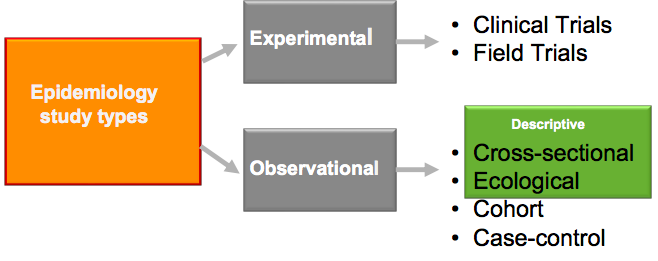
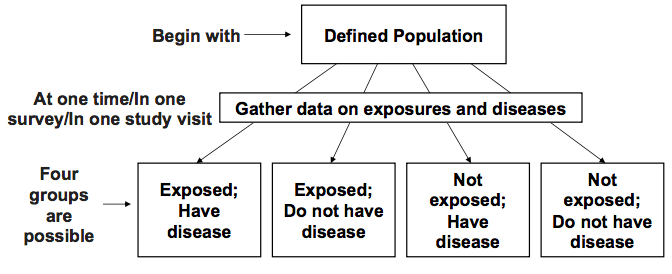
cross-sectional study
a snapshot of the population at a certain point in time
exposure and disease measured simultaneously at the individual level
also known as a prevalence study
purpose
estimation of the magnitude and distribution of a health problem
planning health services and administering medical care facilities and other intervention planning
if conducted serially (ie, annually) can help compare trends over time
hypothesis generation-seeing what factors are associated with outcome of interest
cross section study process
Cross sectional studies advantages
Inexpensive
Easy to conduct
Quantity health problems
Useful for planning (e.g., needs assessments) and resource allocation
examine many associations at once
hypothesis generating
intervention planning
disadvantages of cross-sectional studies
identifying prevalent cases, not incident cases → cases with a longer duration are more likely to be detected
non-response bias—people who respond to questionnaires are systematically different than those who do not
not possible to establish temporality (and thus causality)
threat of reverse causality*
*beware-looking at linear trends over time → the same people aren’t surveyed each time
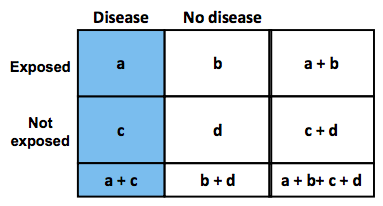
describing disease occurrence, by exposure status:
prevalence of disease among the exposed: a/(a+b)
prevalence of disease among the unexposed: c/(c+d)
odds of disease in the exposed: a/b
odds of disease in the unexposed: c/d

odds formulas (cross-sectional study)
odds of disease in the exposed: a/b
odds of disease in the unexposed: c/d
comparing disease occurrence, by exposure status
prevalence (risk) ratio: compares prevalence in exposed to prevalence in the unexposed
= (a/(a+b))/(c/(c+d))
odds ratio: compares odds of having disease if you’re exposed to odds of having disease if you’re unexposed
= (a/b)/(c/d) = ad/bc
prevalence ratio and risk ratio
prevalence ratio in cross-sectional studies is comparable (same formula) to the risk ratio in cohort studies
ecologic studies
units of analysis are “groups” or “aggregates”
countries provinces, states, counties, regions, neighborhoods
organizations: hospitals, school districts, schools, classrooms, etc
both exposure and outcome are measured for each group, usually at the same time
in this sense similar to cross sectional studies
types of group-level variables
summary of individual-level data
e.g., median. household income, % with high school diploma, HIV seroprevalence, etc.
property of the aggregate
e.g., neighborhood grocery stores, seat belt legislation, community norms, etc
ecologic fallacy
drawing inferences about associations between exposure and outcome at the individual level based on an observed association at the group level
remember: with ecologic studies, we only have data at the group level not the the individual level
strengths of ecologic studies
some exposures may vary very little, or not at all, within a given group
by comparing groups (e.g. countries) ecologic studies allow us to study a greater range of exposures
ex. if diet varies very little within countries, it may not appear to be an important risk factor for CHD. The true relationship between diet and CHD can only be seen by comparing countries with very different diets
some variables are only defined (and can only be measured) for groups
the influence of these exposures can only be studied if we have similar information for different groups
exposures such as income inequality, level of industrialization, physicians per capita, policies, are all things that characterize countries and are relevant to health
why conduct outbreak investigations?
control and prevention
severity and risk to others
research opportunities to gain additional knowledge
training opportunities
program considerations
public, political, or legal concerns
outbreak investigation steps
define the epidemic
describe your data
develop and test hypothesis
recommend control measures and communicate findings
further outbreak investigation steps
recommend control measures
control of present outbreak
prevention of future similar outbreaks
communicate findings
brief local health officials
the community
outbreak investigation step 1: define the epidemic
verify the existence of an outbreak
do cases in a certain time and place exceed what is expected?
verify the diagnosis
clinical features: is the disease known
what are its serologic/cultural aspects? Clinical symptoms?
are the causes partially understood?
establish a case definition (define the numerator)
pathology (microscopic examination)
clinical characteristics (symptoms)
specific disease agent (e.g., virus)
international classification of disease (ICD)
also define the denominator: what population is at risk of developing disease
case definition examples
case definition should be practical, reliable, and applied without bias
outbreak investigation step 2: describe your data
identify and count cases
examine the distribution of cases by:
Time
Place
look for time-place interactions
look for combinations of relevant variables