PSYCHOLOGICAL STATISTICS REVIEWER (PSYCHNOTES)
0.0(0)
Card Sorting
1/112
Earn XP
Description and Tags
Last updated 3:46 PM on 4/2/25
Name | Mastery | Learn | Test | Matching | Spaced | Call with Kai |
|---|
No analytics yet
Send a link to your students to track their progress
113 Terms
1
New cards
Statistics
it is a science of data, and in statistics it involves summarizing, analyzing, and interpreting the information or numerical info.
is a way of viewing reality as exists around us in a way that we otherwise could not.
is a way of viewing reality as exists around us in a way that we otherwise could not.
2
New cards
Population
set of all individuals or group of people of interest in a particular study
3
New cards
Parameter
\- a numerical value that describe a population,
4
New cards
Sample
set of individuals selected from the population that intended to represent the population.
5
New cards
Statistic
\- a numerical value that describe a sample
6
New cards
Variable
it is a characteristic that changes or has different values for individuals.
7
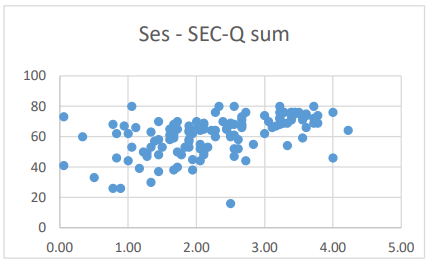
New cards
GENERALIZED
Remember (THE RESULTS FROM THE SAMPLE ARE ________ TO THE POPULATION)
8
New cards
Constant
does not vary, it is the same for every individuals.
9
New cards
Values
possible number or category that a score can have.
10
New cards
Score
particular sample’s value on variable.
11
New cards
Data
(plural) - are measurements or observations
12
New cards
Datum
(singular) - single measurement or observation or this what we called score or raw score.
13
New cards
Data set
collection of measurement or observation
14
New cards
Descriptive Statistics
statistical procedures used to summarize, organize, and simplify data.
It gives glance look to the whole data set gathered from the respondents
It gives glance look to the whole data set gathered from the respondents
15
New cards
Frequency Distribution
it is an organized tabulation of the number of individual located in each category on the scales measurement.
16
New cards
Frequency Table
an ordered listing of number of individuals having each of the different values for particular variable
17
New cards
samples
n= for treating ______
18
New cards
Population
N= _______ data
19
New cards
Median
middle score for a set of data arranged in order of magnitude.
20
New cards
Mean (Average)
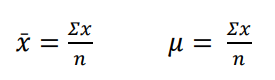
most often used in continuous data and discrete data. (Denoted by μ)
21
New cards
Mode
\- is a value which occurs most often or most frequently occurring observation. (𝐷𝑒𝑛𝑜𝑡𝑒𝑑 𝑏𝑦 𝑀𝑜)
22
New cards
Unimodal
one mode or one peak in the distribution
23
New cards
Bimodal
Bimodal
24
New cards
Multimodal
\- three or more peaks in the distribution
25
New cards
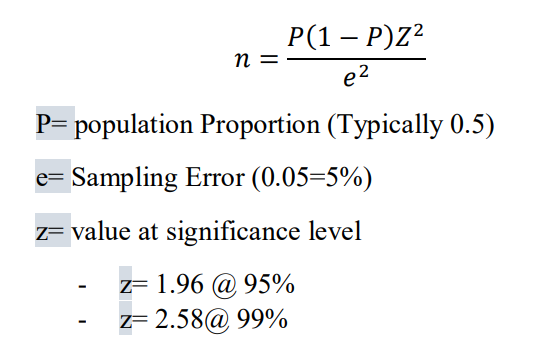
Cochran’s Formula
it is use when the population is known (The value should be rounded into hundreds)
26
New cards
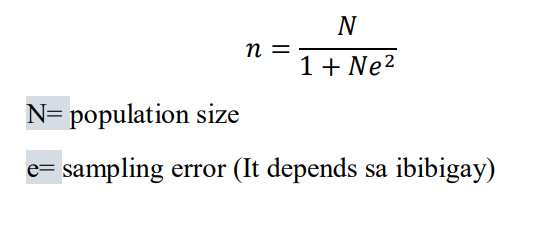
Slovin’s Formula
to calculate the sample size necessary to achieve a certain confidence interval when sampling a population.
27
New cards
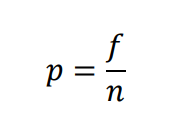
Proportion
\- it measures the fraction of the total group that is associated with each score
28
New cards
Percentage
it expressed as a number out of 100
Multiply the value of proportion to 100
Multiply the value of proportion to 100
29
New cards
Range
a set of data that is the difference between the highest and the lowest values in the set.
R= = 𝐻𝑖𝑔ℎ𝑒𝑠𝑡 𝑠𝑐𝑜𝑟𝑒 − 𝐿𝑜𝑤𝑒𝑠𝑡 𝑆𝑐𝑜𝑟E
R= = 𝐻𝑖𝑔ℎ𝑒𝑠𝑡 𝑠𝑐𝑜𝑟𝑒 − 𝐿𝑜𝑤𝑒𝑠𝑡 𝑆𝑐𝑜𝑟E
30
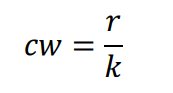
New cards
Class Size
\- it gives the size of the table
𝑘 = 1 + 3.32𝑙𝑜𝑔(𝑛)
𝑘 = 1 + 3.32𝑙𝑜𝑔(𝑛)
31
New cards
Class Interval
it determine the width of any class in particular distribution
32
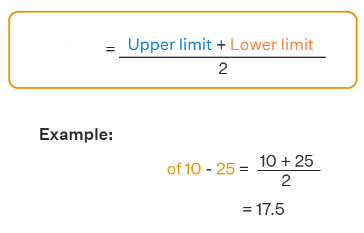
New cards
class mark
\- this is the value between lower limit and upper limit
33
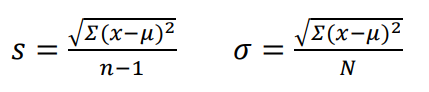
New cards
Standard Deviation
\- is a measure of how dispersed the data is in relation to the mean.
34
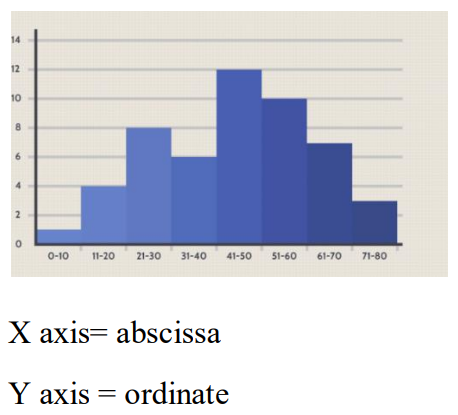
New cards
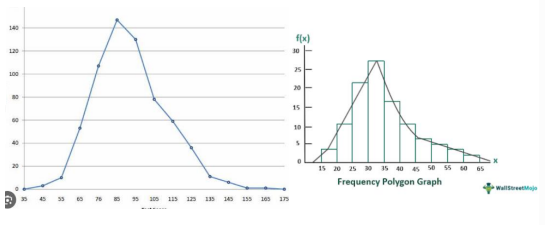
Histogram
Bar like graph of a frequency distribution in which the values are plotted along x-axis and the high of each bar is the frequency of the value(No space ang bars)
35
New cards
Frequency Polygon
continuous line that represents the frequencies of scores within a class interval (it is always based on Histogram)
36
New cards
Column Chart
A data visualization where each category is represented by a rectangle (May space ang mga bars)
37
New cards
Bar Graph
Identical to column charts, but in this chart CATEGORIES are organized vertically on y axis and values are shown in x axis.
38
New cards
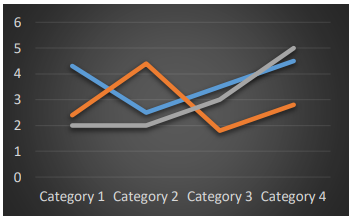
Line Graph
(Line plot or line chart)- it is a graph uses a lines to connect individual data points that display quantitative values over a specified time interval. (If our variable is about time this graph is appropriate)
39
New cards
Scatter Plot
uses dots to represent values for two different numeric variables.
40
New cards
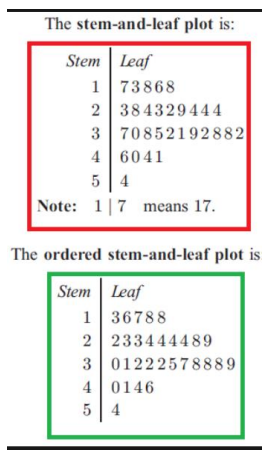
Stem and Leaf
is a device for presenting quantitative data in a graphical format, similar to a histogram, to assist in visualizing the shape of a distribution.
41
New cards
Gaussian Curve
is a probability distribution that is symmetric about the mean, showing that data near the mean are more frequent in occurrence than data far from the mean. In graphical form, the normal distribution appears as a "bell curve”
42
New cards
Karl Friedrich Gauss
He coined the term Gaussian Curve
43
New cards
Abraham de Moivre
Who introduce the first concept of Normal Curve
44
New cards
Skewness
is the degree of asymmetry observed in a probability distribution.
45
New cards
Z-Score
a statistical measurement that describes a value's relationship to the mean of a group of values. ____ is measured in terms of standard deviations from the mean. If a ______ is 0, it indicates that the data point's score is identical to the mean score.
46
New cards
Z-Table
tools used to get exact proportion or probability
47
New cards
𝑧 = 𝑥 −MEAN / SD
Formula for z
48
New cards
𝑆𝐷 = x - mean / z
formula For SD
49
New cards
z x Sd + μ
formula for x
50
New cards
x + sd x z
formula for mean
51
New cards
Kurtosis
a measure of the tailedness of a distribution
52
New cards
Mesokurtic
Medium tail
53
New cards
Platykurtic
Flat tail
54
New cards
Leptokurtic
Thin tail
55
New cards
Inferential Statistics
consist of techniques that allow us to study samples and then make generalizations about the populations from which they were selected
56
New cards
T- Test
a statistical test that is used to compare the means of two groups. It is often used in hypothesis testing to determine whether a process or treatment actually has an effect on the population of interest, or whether two groups are different from one another.
57
New cards
Z-test
a statistical test to determine whether two population means are different when the variances are known and the sample size is large. A z-test is a hypothesis test in which the z-statistic follows a normal distribution. A z-statistic, or z-score, is a number representing the result from the z-test.
58
New cards
Difference
A z-test is used to test a Null Hypothesis if the population variance is known, or if the sample size is larger than 30, for an unknown population variance. A t-test is used when the sample size is less than 30 and the population variance is unknown
59
New cards
Similarity
z-tests, t-tests are calculations used to test a hypothesis, but they are most useful when we need to determine if there is a statistically significant difference between two independent sample groups.
60
New cards
Pearson correlation coefficient
assesses the linear relationship between variables,
61
New cards
Spearman correlation coefficient
evaluates the monotonic relationship
62
New cards
Sampling error
is the naturally occurring discrepancy, or error, that exists between a sample statistic and the corresponding population parameter.
63
New cards
Discrete variable
A discrete variable consists of separate, indivisible categories. No values can exist between two neighboring categories.(Categorical like male/ female, names and more)
64
New cards
Continuous variable
For a continuous variable, there are an infinite number of possible values that fall between any two observed values. A continuous variable is divisible into an infinite number of fractional parts. (Decimals )
65
New cards
Nominal, Ordinal, Interval, Ratio
Levels of Measurements
66
New cards
Descriptive Statistics
\- One group with one or more separate variables measured for each individual Numerical or category Describing the individual variable
67
New cards
Behavioral Observation
observes and systematically records the behaviour of individual to describe the behaviour.
68
New cards
Frequency
kung ilan
69
New cards
Duration
kung gaano kahaba
70
New cards
Interval
period of time between the events
71
New cards
Naturalistic or non-participant, Participant observation, Contrived or structured
Types of observation
72
New cards
Naturalistic
or non-participant- Observe in a natural setting as unobtrusively as possible
73
New cards
Participant observation
engages in the same activity.
74
New cards
Contrived
or structured - arranged specifically to facilitate the occurrence of specific behaviors.
75
New cards
Open-ended, Restricted, Rating scale
Types of Questions
76
New cards
Open-ended
– Anything you want to answer
77
New cards
Restricted
Multiple choices, or something have a restricted question, have a limitations.
78
New cards
Rating scale
Likert- scale
79
New cards
Case study
case study may involve an intervention or treatment administered by the researcher
80
New cards
CASE HISTORY
Not include any treatment
81
New cards
Correlational Research
One group with two variables measured for each individual (determining whether there is a relationship between the two variables)
Limitation
Demonstrate the existence of relationship No explanation
It does not establish the cause and effect
Limitation
Demonstrate the existence of relationship No explanation
It does not establish the cause and effect
82
New cards
Predictive research design
Predicting the outcome.
83
New cards
Comparative research design-
comparing two or more groups with one variable.
84
New cards
Experimental Research Design
to answer the cause and effect questions about the relationship between two variables.
85
New cards
Manipulation
something purposefully change by the researcher in the environment
86
New cards
Control
used to prevent outside factors from influencing the study outcome
87
New cards
random selection
equal chance and assignment. Equal chance of being assign in treatment
88
New cards
Control condition or group
does not receive ant treatment instead they received neutral or placebo
Purpose= to provide baseline for comparison group
Purpose= to provide baseline for comparison group
89
New cards
Experimental condition
or group- do receive the experimental treatment
90
New cards
Quasi-experimental Research
uses some of the rigor and control that exist in experiments;
always contain a flaw prevents from obtaining an absolute cause and effect answer
always contain a flaw prevents from obtaining an absolute cause and effect answer
91
New cards
Pre- test / post-test design
= you will giving before and after treatment and then you will observe if there is any changes of the given treatment or condition
92
New cards
Longitudinal Design
= involved repeted observation of the same variables over short or long period of time. (For years)
93
New cards
Target Population
researcher’s specific interest with the individual share one characteristics.
94
New cards
Accessible Population
can be accessed by the researchers
95
New cards
Representativeness
the characteristics of the sample accurately reflect the char. of the population.
96
New cards
Representative sample
= same characteristics as the population.
97
New cards
Biased sample
different characteristics from population
98
New cards
Selection bias or sampling bias
= are selected in a manner that increases the probability of obtaining a biased sample
99
New cards
Probability sampling
= the entire population is known ( alam mo na dito yung participants mo)
100
New cards
Simple random sampling
= equal chance of being selected. (RANDOM NUMBER GENERATOR)
A second requirement that is sometimes added is that each selection is independent of the others.
A second requirement that is sometimes added is that each selection is independent of the others.