Chapter 9: Inventory Management Overview
1/83
There's no tags or description
Looks like no tags are added yet.
Name | Mastery | Learn | Test | Matching | Spaced | Call with Kai |
|---|
No analytics yet
Send a link to your students to track their progress
84 Terms
Inventory
Stock of goods held for sale or use.
What are key inventory management decisions?
Deciding how much to order and when to order.
Example: Imagine you have a toy store. You need to decide how many toys to keep in stock and when to get more so you don’t run out.
What are lot-sizing decisions?
Deciding the quantity of items to order at once.
Example: If you bake cookies, do you buy 10 bags of flour at a time or 1 bag?
How does an ABC Analysis inform inventory management decisions?
It helps you group items into three categories:
A items: Most important, need close attention.
B items: Less important.
C items: Least important.
Example: In a store, expensive electronics (A) need close tracking, mid-range items (B) are ordered regularly, and low-cost pens (C) can be stocked less often
What are the key assumptions to using the EOQ formula for lot-sizing decisions?
The demand is constant, the ordering cost doesn’t change, and the holding cost is fixed.
Example: If you always sell 10 cupcakes a day and your costs stay the same, EOQ helps find the perfect number of ingredients to order.
How does the EOQ change when demand, ordering cost/setup cost, or holding costs change?
If demand goes up, EOQ increases.
If ordering cost goes up, EOQ increases.
If holding cost goes up, EOQ decreases.
Example: If cupcake sales double, you need more ingredients, so you order more at once.
At EOQ, what is the relationship between Annual Ordering Cost and Annual Holding Cost?
They are equal at the EOQ point.
Example: The money spent ordering supplies is the same as the money spent storing them.
How does a Q System differ from a P System for monitoring inventory?
Q System: You reorder when inventory reaches a certain level.
P System: You reorder at specific time intervals.
Example: In a Q system, you restock milk when there are only 5 cartons left. In a P system, you reorder every Monday.
inventory-associated costs
with simple examples:
Unit Product Cost
The cost to buy or make one item.
Example: Each toy in your toy store costs $5 to buy from the supplier.
Ordering (Setup) Cost
The cost to place an order or set up production.
Example: It costs $10 for the paperwork and shipping fees every time you order new toys.
Warehouse (Storage) Cost
The cost to store your inventory, like rent, utilities, and security.
Example: You pay $100 a month to keep toys in your warehouse.
Holding (Carrying) Cost
The cost of keeping items in stock, including storage and any losses from damage or spoilage.
Example: If you don’t sell the toys fast, you pay $2 per toy each month to keep them safe.
Stockout (Shortage) Cost
The cost when you run out of items and can't meet customer demand.
Example: Customers want toys, but you sold out, so you lose $50 in potential sales.Ordering Frequency
How often you place an order. More frequent orders mean lower holding costs but higher ordering costs.
Example: Ordering toys every week keeps storage costs low, but ordering costs go up.
Darn it! They have sold out!
This happens when a stockout occurs, and you can’t meet customer demand, causing lost sales.
Example: A customer wanted a popular action figure, but you had none left—lost the sale!
Inventory Spoilage Cost
The cost of goods that go bad or become unusable while in storage.
Example: You store food items, and some spoil after a week, leading to losses.
Lost Sales Cost
The cost of missing out on sales because items are out of stock.
Example: Running out of toys means losing customers who will buy from another store.
Insurance Cost
The cost of insuring your inventory in case of theft, damage, or disaster.
Example: You pay $30 a month to insure all the toys in your warehouse.
types of inventories
with simple examples:
Accounting Inventories
Inventories tracked for financial reporting purposes.
Example: Your store counts all the toys on hand at the end of the month for accounting records.
Operational Inventories
Inventories needed for daily business operations.
Example: The toys in your store's backroom that you’ll sell throughout the week.
Cycle Inventory
The portion of inventory you sell regularly based on replenishment cycles.
Example: The 100 toys you order every month to keep up with demand.
Anticipation Inventory
Extra stock you keep to meet future demand increases.
Example: You order more toys before the holiday season, expecting higher sales.
Safety Stock Inventory
Extra items kept to avoid running out when demand is unpredictable.
Example: You keep an extra 20 toys just in case more customers than expected come in.
Pipeline Inventory
Items that are in transit or being processed but not yet available for sale.
Example: The toys you ordered are on a truck and on their way to your store.
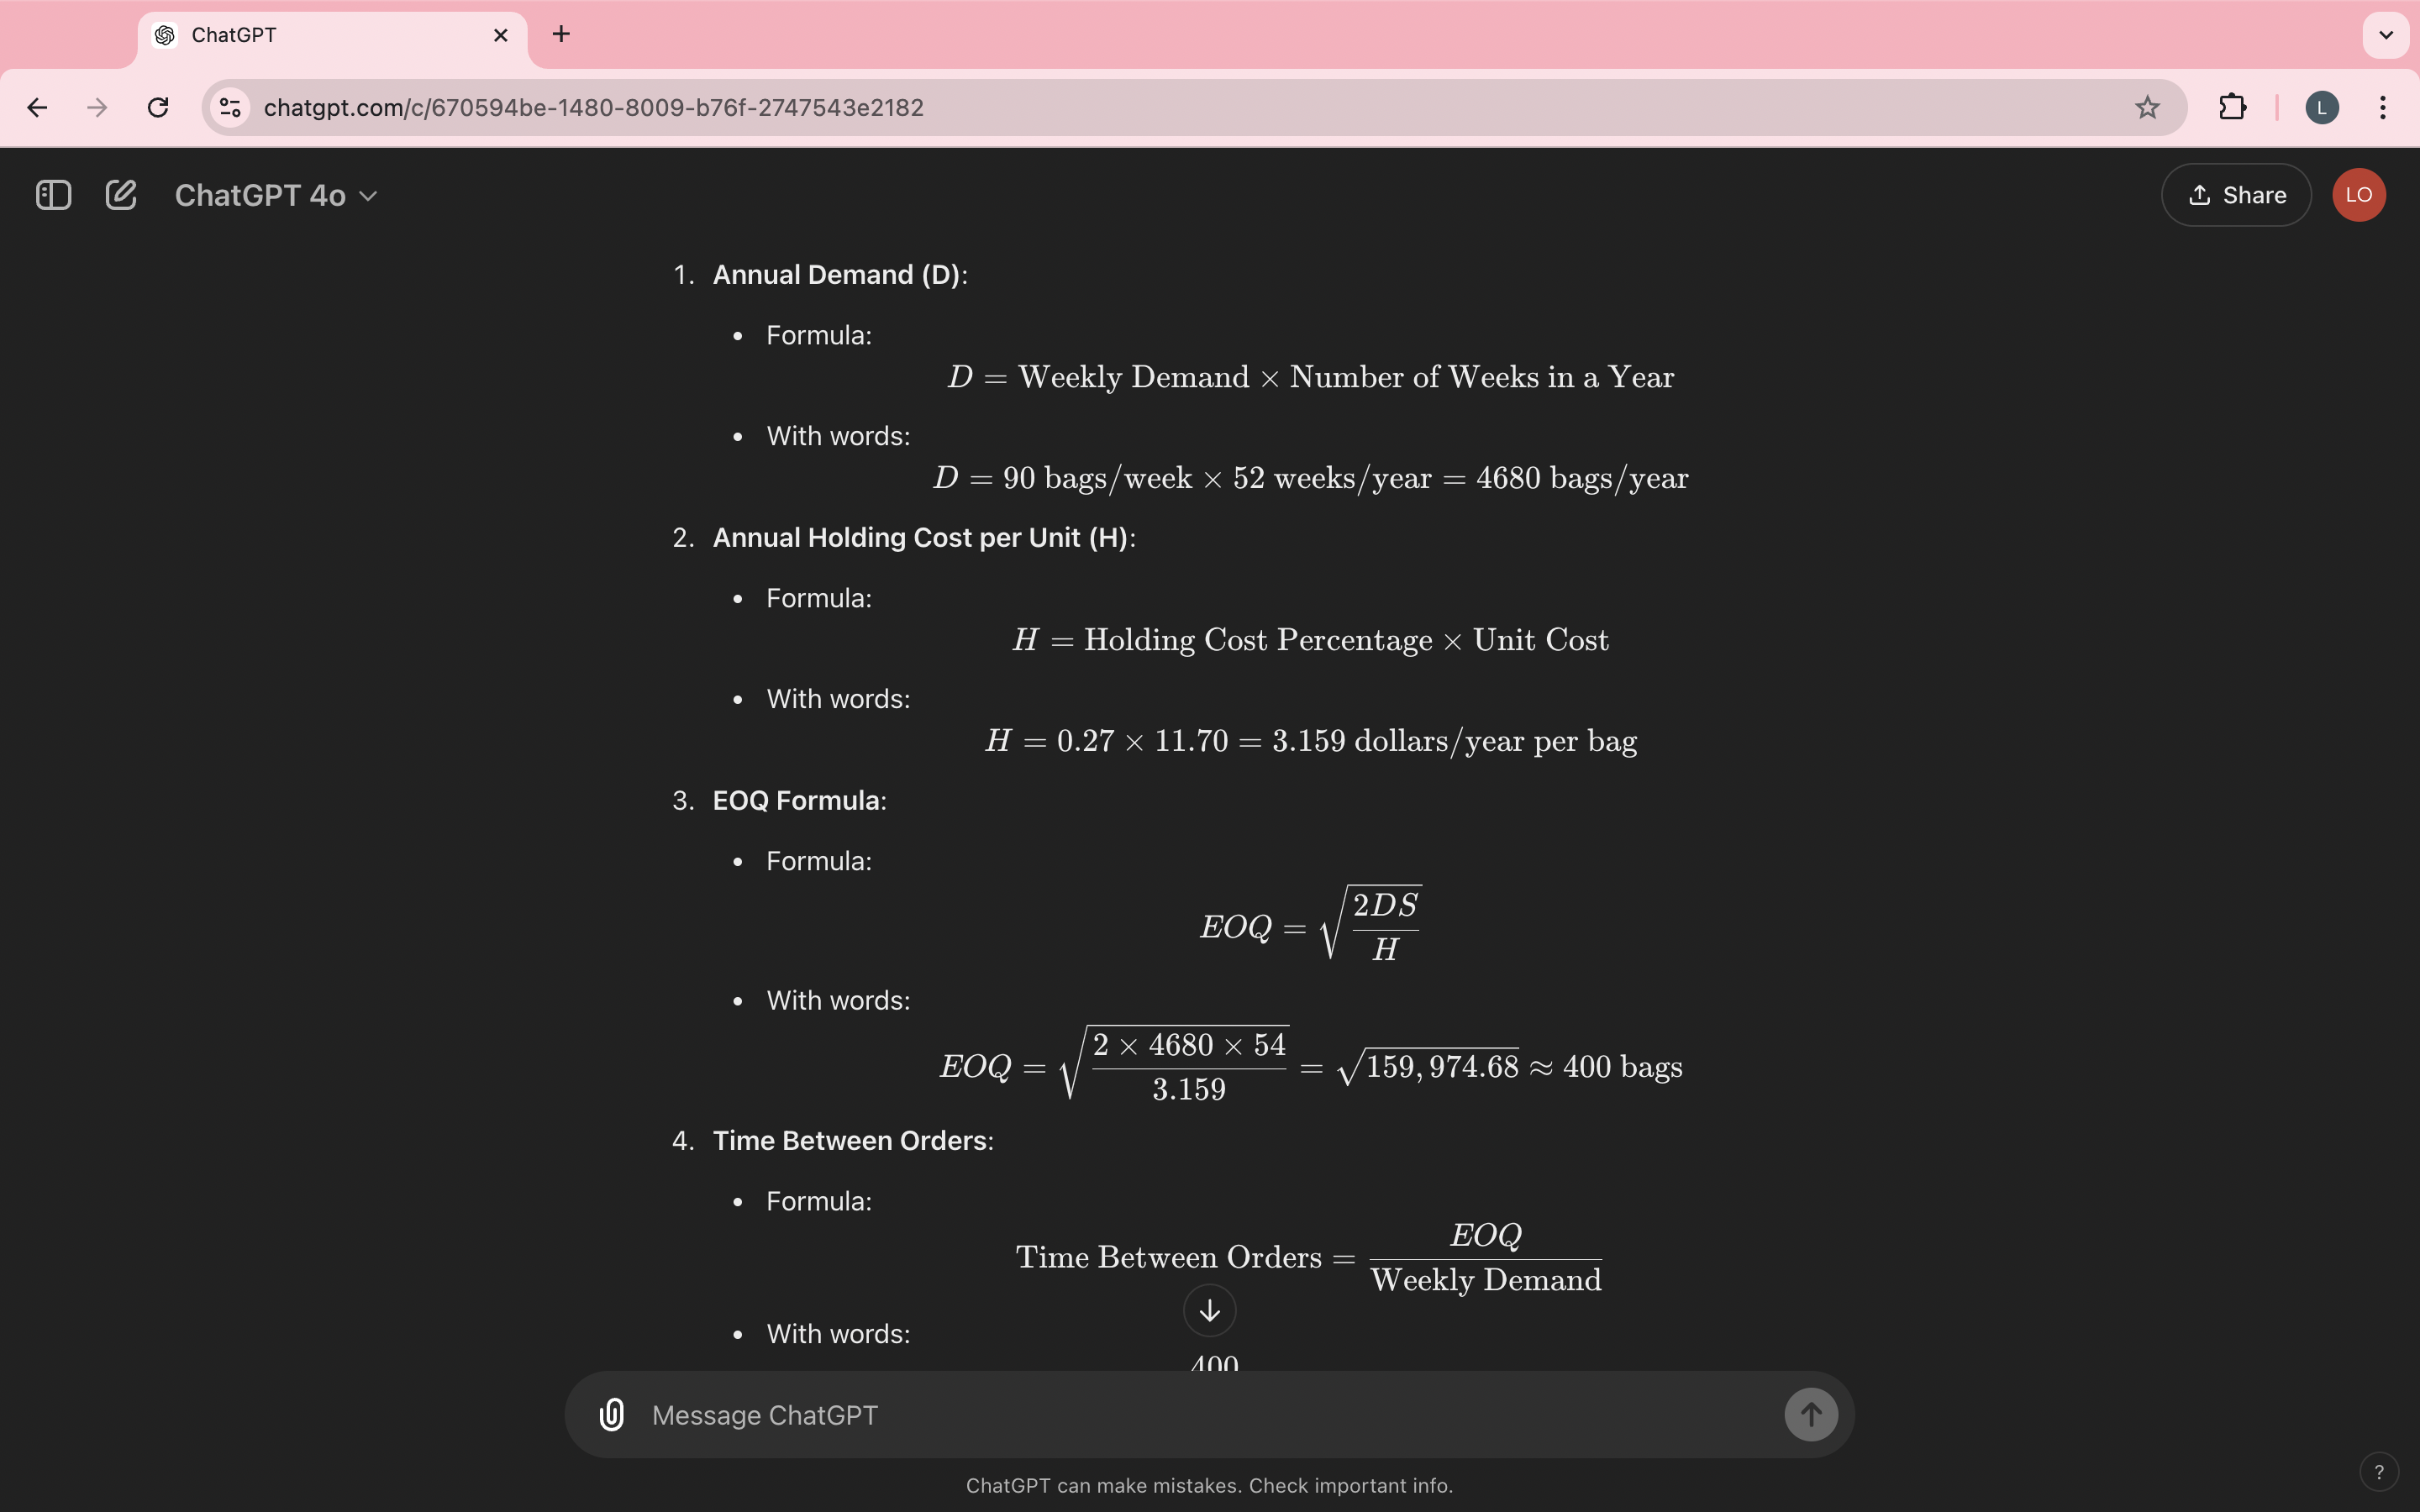
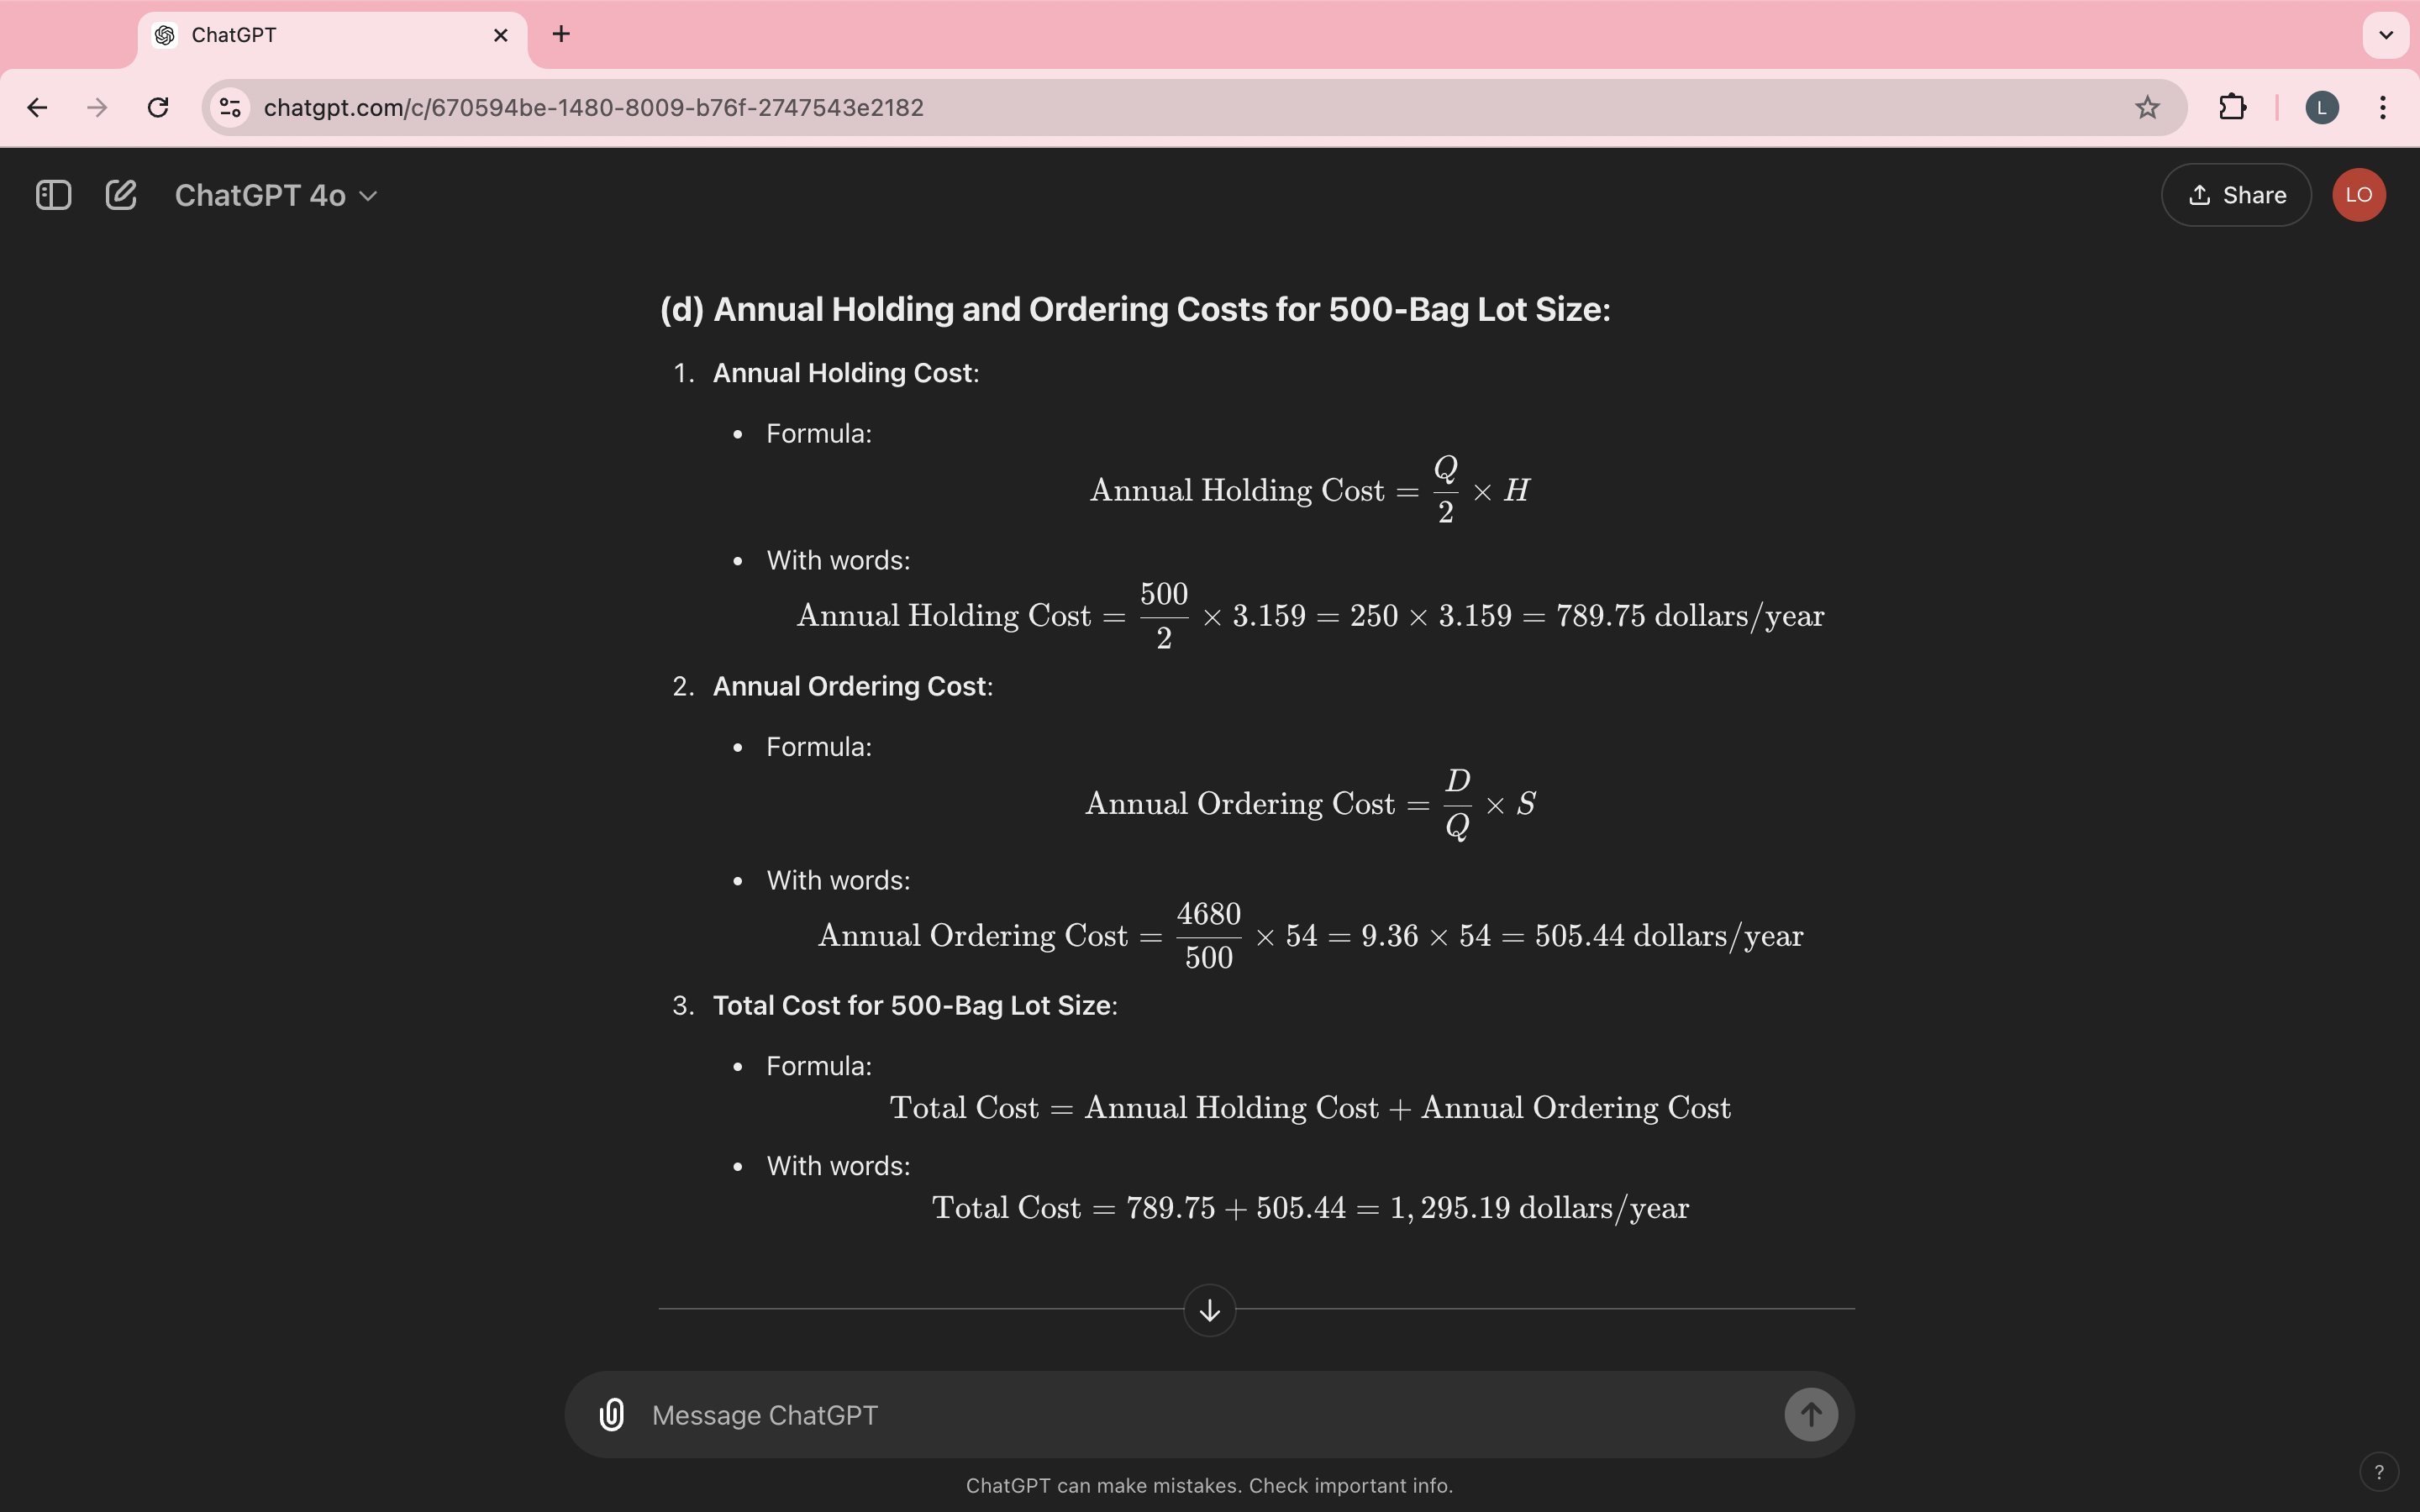
Annual Holding Cost formula
Annual Holding Cost=(Average Cycle Inventory)×(Unit Holding Cost)
Annual Holding Cost= (Q/2)×H
This is based on the assumption that on average, you hold half of your order quantity (Q/2) in stock at any time.
H is the cost to hold one unit in inventory for a year.
Average Cycle Inventory is how many items you usually keep in stock between orders (often half of the order size).
Unit Holding Cost is the cost of storing one item for a year.
Example: If you usually keep 50 toys in stock and it costs $2 to store each one, the annual holding cost is:
50×2=100 dollars/ year
Annual Ordering Cost:
This is the cost of placing orders throughout the year.
The formula:
Annual Ordering Cost=(Number of Orders per Year)×(Ordering or Setup Cost)
Number of Orders per Year is how often you place orders.
Ordering or Setup Cost is how much it costs to place each order (like paperwork, shipping, etc.).
Example: If you place 10 orders per year and each order costs $5 to process, the annual ordering cost is:
10×5=50 dollars/year
Total Annual Cycle Inventory Cost:
This is the total cost of holding and ordering inventory for the whole year.
The formula:
D/Q x S
D is the total demand for the year, and Q is the order size.
S is the cost of placing one order (fixed cost).
Total Costs=Annual Holding Cost+Annual Ordering Cost
Example: If your holding cost is $100 and your ordering cost is $50, your total cost for the year is:
dont use EOQ
make to oder strategy
order size is constraint
Modify eoq
quantity discounts
replenishment is not instantaneous
use the eoq
make to stock strategy with relativley stable demand
carrying and setup costs are known and relatively stable
Total Annual Cost Formula:
This formula combines the holding and ordering costs to give the total cost of managing inventory for a year:
Total Cost=Annual Holding Cost+Annual Ordering
Average time between orders (in weeks):
Time between orders= EOQ / weekly demand
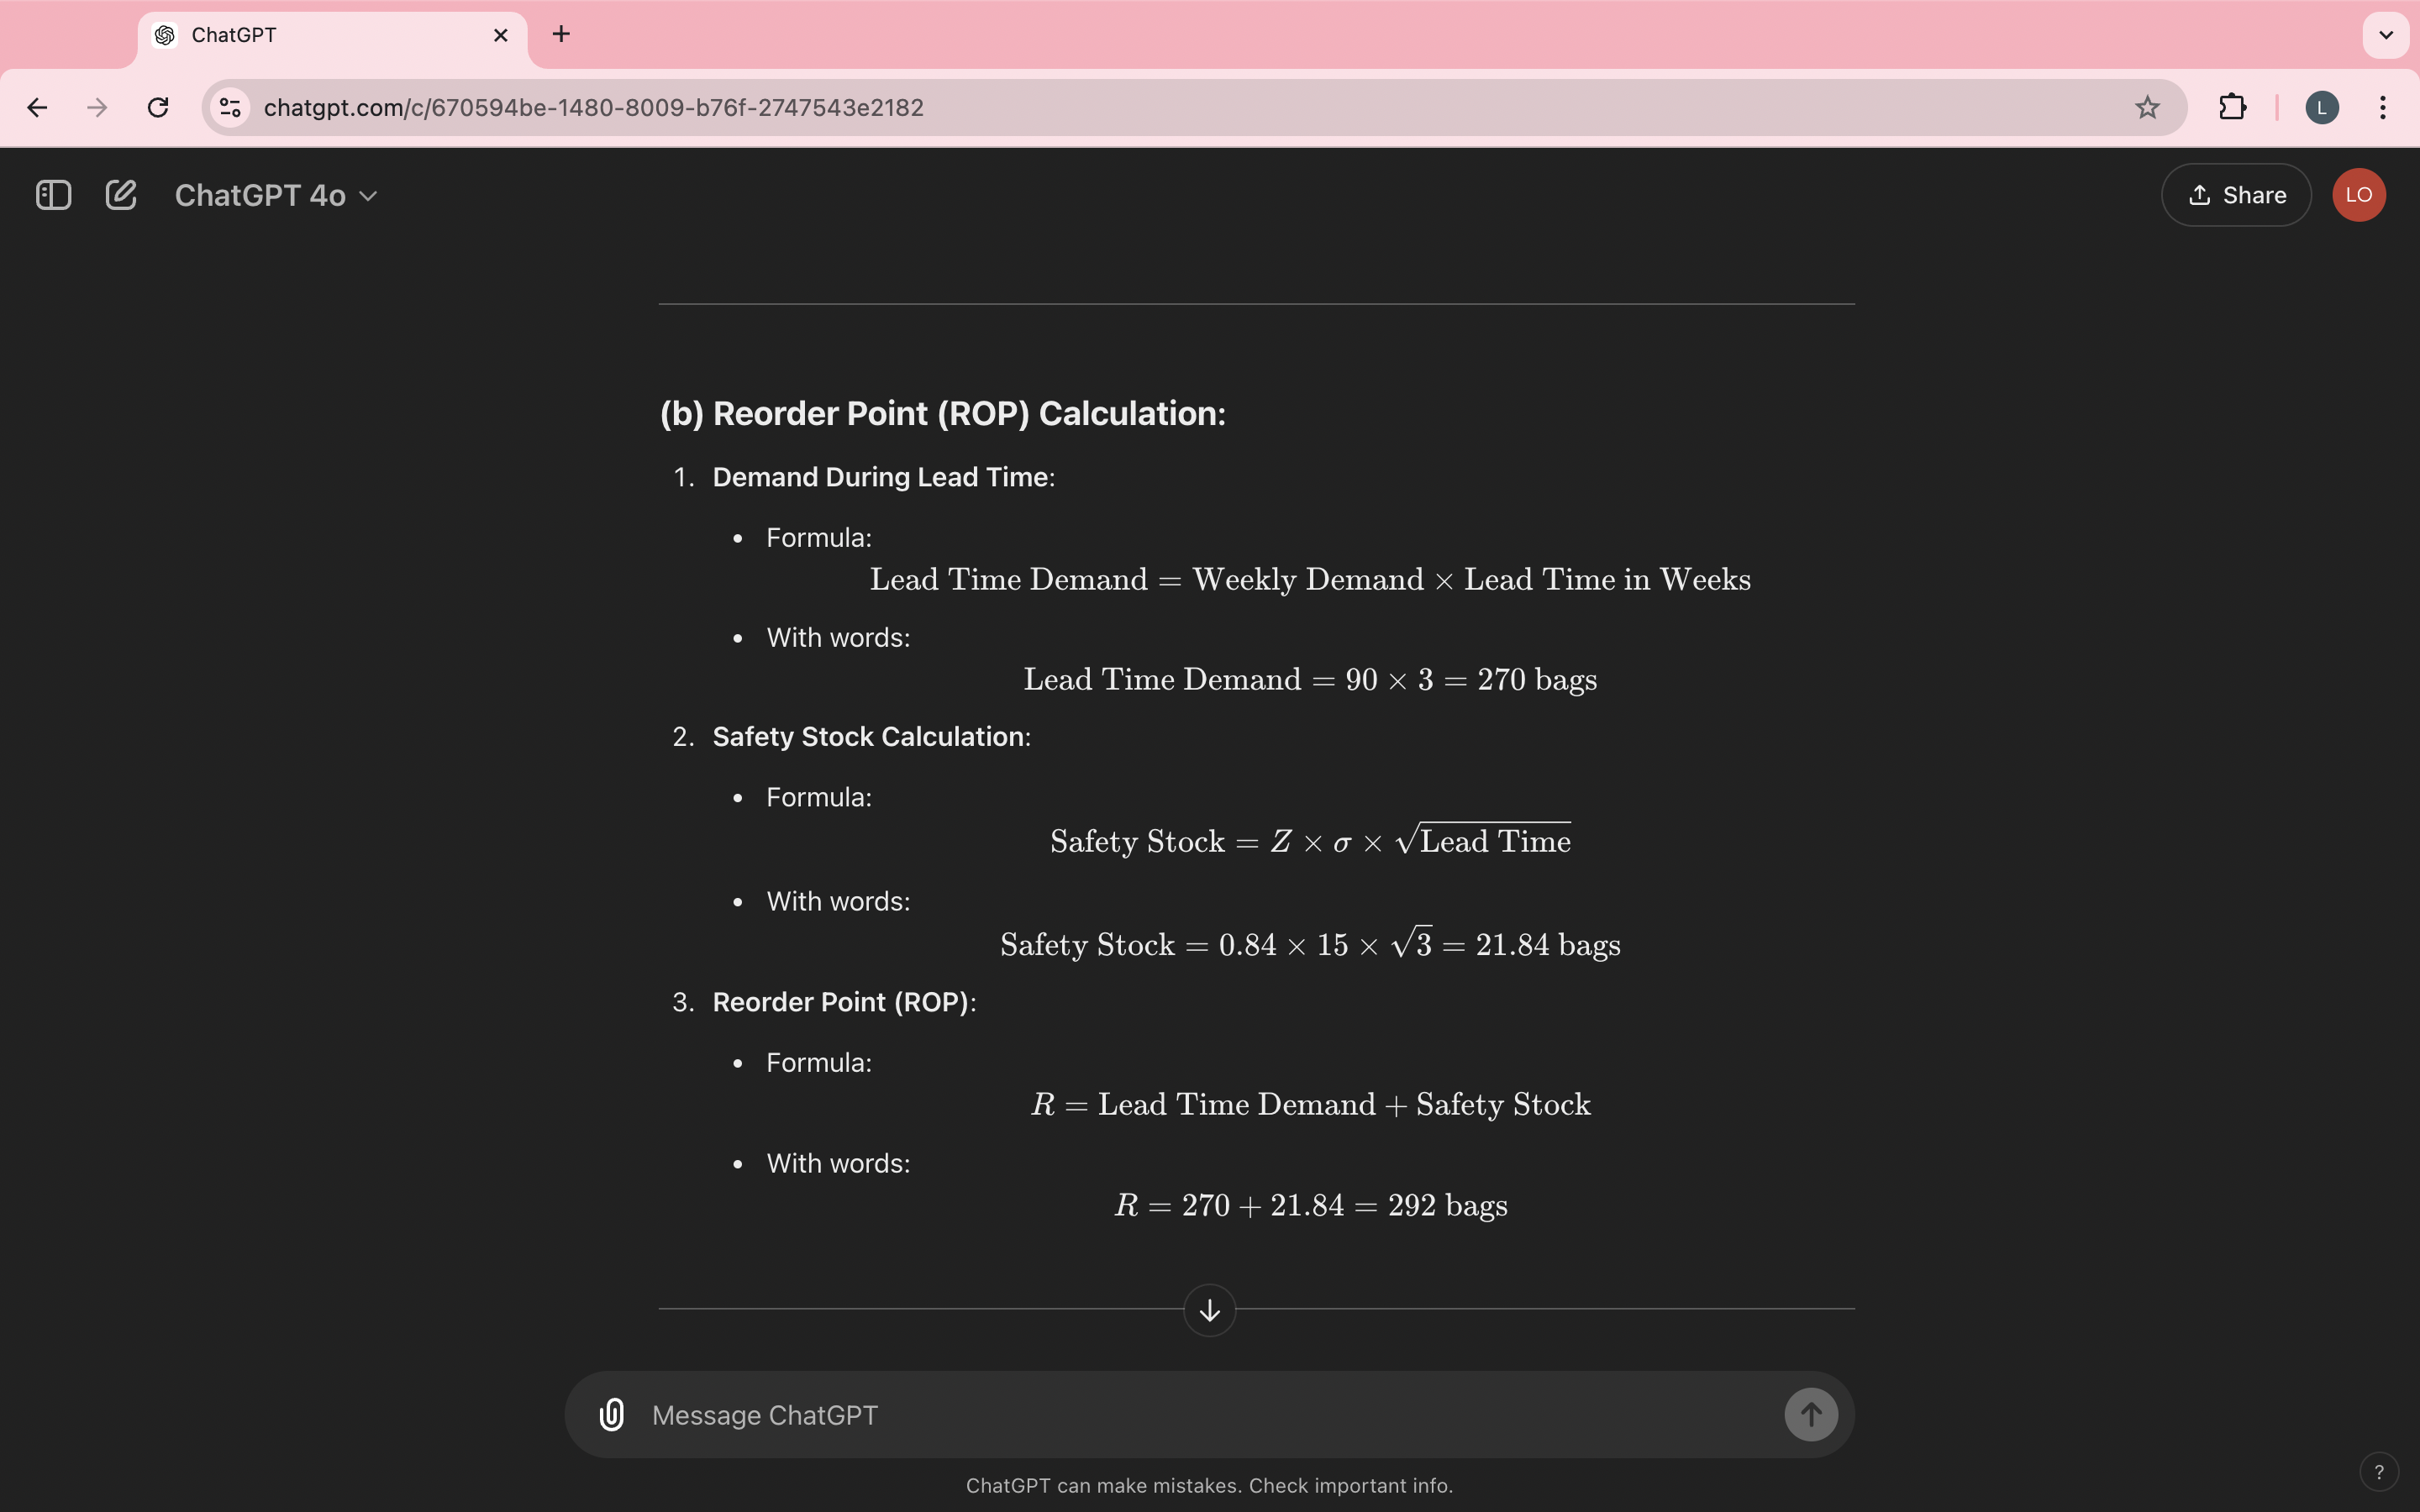
(Reorder Point)
R=(Demand during lead time)+(Safety Stock)
Demand during lead time:
Lead time = 3 weeks
Demand per week = 90 bags/week
Demand during lead time=90×3=270 bags
The reorder point R is when you need to place an order. It depends on the lead time and demand during lead time, plus safety stock.
safety stock formula:
Safety Stock= Z × σ × strt Lead Time
Z is based on the cycle-service level (80%). The Z-value for 80% is approximately 0.84.
Standard deviation (σ\sigmaσ) of weekly demand = 15 bags
Lead time = 3 weeks
Continuous Review (Q) System:
This is a system where the inventory levels are monitored constantly.
Every time the inventory reaches a specific point (called the Reorder Point, ROP), an order is placed for a fixed quantity (Q).
Example: Imagine you run a toy store, and you decide to always reorder 100 toys when your stock drops to 20 toys. You’re watching the inventory constantly, so the moment you have 20 toys left, you order 100 more.
Reorder Point System (ROP):
The Reorder Point (ROP) is the specific inventory level where you know it’s time to reorder more stock.
When the inventory hits this level, you place an order for more items.
Example: If you sell 10 toys per week and it takes 2 weeks to get new toys from the supplier, your reorder point would be 20 toys. This way, you still have enough stock to sell while waiting for the new shipment.
Fixed Order Quantity System:
In this system, you always order the same quantity (Q) whenever you reach the reorder point (ROP).
The quantity (Q) is fixed, meaning it doesn’t change based on demand fluctuations.
Example: Every time you hit the reorder point of 20 toys, you always order 100 toys, no more, no less.
EOQ (Economic Order Quantity) Calculation:
(b) Reorder Point (ROP) Calculation:
Annual Holding and Ordering Costs for 500-Bag Lot Size:
Five Assumptions of EOQ:
Demand rate is constant and known with certainty:
We assume the company always knows how many items it will need and that this number doesn’t change.
Example: A store knows it sells 100 units every week, no surprises.
No constraints are placed on the size of each lot:
The company can order as many or as few units as needed, with no restrictions on order size.
Example: You can order 1,000 or 10,000 units—there’s no limit.
The only two relevant costs are the inventory holding cost and the fixed cost per lot for ordering or setup:
EOQ only considers two costs:
Holding costs: The cost of storing inventory (like rent or spoilage).
Ordering costs: The fixed cost of placing an order or setting up production (like paperwork or shipping).
Other costs like marketing or production are not included in EOQ calculations.
Decisions for one item can be made independently of decisions for other items:
Each product’s inventory is managed separately, so what you decide for one item (e.g., books) doesn’t affect other items (e.g., electronics).
Example: The way you manage your toy inventory has no impact on how you manage your clothes inventory.
The lead time is constant and known with certainty:
Lead time (how long it takes to receive an order) is always the same and predictable.
Example: If it takes 2 weeks to get an order from the supplier, this will always be true—no delays or early deliveries.
Q System
Reorder when stock falls to a certain level.
Example: You reorder toys when only 20 are left.
P System
Reorder at fixed intervals.
Example: You place an order every Monday, regardless of stock levels.
EOQ (Economic Order Quantity)
Helps calculate the optimal order size to minimize costs.
Example: EOQ tells you to order 300 toys at a time to balance ordering and holding costs.
ELS (Economic Lot Size)
Used for determining the best batch size for producing items.
Example: If your factory makes toys, ELS calculates the best batch size to minimize production costs.
Reorder Point
The stock level at which you need to place a new order.
Example: When you have 10 toys left, it’s time to reorder.
Safety Stock
Extra stock kept to prevent running out during demand spikes.
Example: You keep 50 extra toys in case of unexpected high demand.
ABC Analysis
Classifying items by importance: A (most important), B (moderately important), C (least important).
Example: Expensive electronics are A items, pens are C items.
Cycle Inventory
Reduces lot size
• Reduce ordering and setup costs and allow Q to be reduced
• Increase repeatability to eliminate the need for changeovers
Anticipation inventory - inventory reduction tactics
• • Match demand with production rates
Add new products with different demand cycles '
• Provide off-season promotional campaigns
• Offer seasonal pricing plans
Pipleline inventory
reduces lead times aka shipping time
Find more responsive suppliers and select new carriers
• Change Q in those cases where the lead time depends on the lot size
demand items? Independent vs dependent
Which are independent demand items?
Items that are ordered based on market demand, not dependent on other products.
Example: Toys in your store are independent demand items because their sales don’t rely on another product.
Which are dependent demand items?
Items needed to produce or support other items.
Example: The wheels for a toy car are dependent demand items, as they are needed to complete the toy car.
Safety Stock
places orders closer to the time they must be received
• Improve demand forecasts
• Cut lead times
• Reduce supply uncertainties
• Rely more on equipment and labor buffers
ABC Analysis calculated
Calculate Annual Dollar Usage:
Multiply Dollar Value by Annual Usage for each SKU.
Rank SKUs by Annual Dollar Usage:
List SKUs from highest to lowest based on Annual Dollar Usage.
Classify into A, B, and C Classes:
A items: Top 20% (highest dollar usage).
B items: Next 30% (moderate dollar usage).
C items: Bottom 50% (lowest dollar usage).
Example Classification:
A items: SKU 4, SKU 7
B items: SKU 5, SKU 2
C items: SKU 6, SKU 8, SKU 3, SKU 1
This keeps the process clear and straightforward!
What is EOQ?
EOQ is like figuring out the perfect number of toys to buy at once so that you don’t spend too much money keeping them in your room (holding costs) or having to go to the store too often (ordering costs).
If you buy too many toys at once, you’ll need a lot of space to keep them, and that costs money (holding cost).
If you buy just a few toys at a time, you have to keep going to the store over and over, and that also costs money (ordering cost).
Economic Order Quantity (EOQ)
Optimal order quantity minimizing total inventory costs.
ABC Analysis
Classification of inventory based on dollar usage.
Reorder Point (ROP)
Inventory level triggering a new order.
Continuous Review System
System monitoring inventory levels continuously.
Lot-sizing Decisions
Determining order quantities for inventory.
Forecasting Errors
Discrepancies between predicted and actual demand.
Demand Patterns
Trends in customer demand over time.
Holding Costs
Costs associated with storing inventory.
Ordering Costs
Costs incurred when placing orders.
Stockout Costs
Costs from running out of inventory.
Linear Regression
Statistical method for forecasting based on trends.
Weighted Moving Average
Forecasting method giving more weight to recent data.
Exponential Smoothing
Forecasting method using a smoothing constant.
Multiplicative Seasonal Method
Forecasting seasonal patterns using multiplication.
Additive Seasonal Method
Forecasting seasonal patterns using addition.
Causal Relationship
Connection between variables affecting demand.
Demand Rate
Rate at which inventory is consumed.
Lead Time
Time between placing and receiving an order.
Class A Items
High-value items in ABC Analysis.
Class B Items
Moderate-value items in ABC Analysis.
Class C Items
Low-value items in ABC Analysis.
Fixed Order Quantity
Constant amount ordered each time.
Variable Order Quantity
Order size varies based on conditions.
Fixed Interval Reorder System (Periodic System):
Place orders at regular times: You order items at the same time (e.g., every week or every month), no matter how much you have in stock.
Order different amounts: The number of items you order changes depending on how many you need to fill up your inventory.
Easy to plan: It’s simple because you know exactly when you’ll place an order (like on the same day every week).
Risk of running out: Since you’re not checking the stock all the time, you might run out if you don’t order enough before the next scheduled order.
Can order too much: If you don’t sell as much as expected, you could end up with too many items sitting in storage.
How should we order items that have a limited selling season?

Many items have a limited selling season and a long enough lead time that precludes the possibility of a second order:
Clothing at many retailers
Sporting goods for a seasonal sport
Holiday items
Items for a one-time event
Etc.

Single-Period Inventory Decisions
(also called the Newsvendor Problem) involve managing inventory for items that have a limited selling period—meaning you only have one chance to order the right amount of stock. Once the selling period ends, the items lose their value, or you can’t sell them anymore.When are Single-Period Decisions Used?
These decisions are common when you’re dealing with:
Perishable goods (like food or flowers).
Seasonal items (like Christmas trees, Halloween costumes, or newspapers).
Limited-time products (event merchandise or concert tickets).
What type of information would be relevant for this problem? NEWSVENDOR
Profit per unit sold
Loss per unit not sold or sold at a discount
Probability for different levels of demand
Demand | 100 | 200 | 250 |
Probability | 0.25 | 0.45 | 0.3 |
single period t shirts
Calculate Profit per Unit:
Subtract the cost from the selling price.
Determine Profit for Each Demand Scenario:
If demand ≤ order quantity, multiply demand by profit per unit; if demand > order quantity, multiply order quantity by profit per unit.
Multiply Each Profit by Probability:
For each demand level, multiply the calculated profit by its probability.
Add Expected Profits and Compare:
Sum the expected profits for each order quantity and choose the one with the highest total.
Outsourcing and ofshoring sins

enviorments
Factor | Efficient Supply Chains | Responsive Supply Chains |
Demand | Predictable, low forecast errors | Unpredictable, high forecast errors |
Competitive priorities | Low cost, consistent quality, on-time delivery | Development speed, fast delivery times, customization, volume flexibility, variety, top quality |
New-service/product introduction | Infrequent | Frequent |
Contribution margins | Low | High |
Product variety | Low | High |
What is a supply chain?
A supply chain is all the steps and people involved in moving a product or service from the idea stage to the customer. It includes suppliers, manufacturers, warehouses, and transportation.
What is supply chain management?
=
Supply chain management is the process of managing and coordinating all the activities in a supply chain to improve efficiency and customer satisfaction.
Do only manufactured products have supply chains?
No. Both products and services have supply chains because they all involve processes like sourcing materials, production, and delivery.
How do internal pressures affect supply chain design?
dynamic sales volume: Adjusting to fluctuating demand.
Customer service levels: Balancing speed and quality.
Service/product proliferation: Managing a wide range of products/services.
Emerging markets: Adapting to new market conditions.
Efficient vs. Responsive Supply Chains
Efficient supply chains: Focus on minimizing costs, often used for products with steady demand.
Responsive supply chains: Focus on flexibility and speed, often used for products with fluctuating demand.
How do efficient and responsive supply chains relate to product types?
Efficient: Best for standard, predictable products.
Responsive: Best for custom, unpredictable products or services.
Are vertical integration, make-buy, and outsourcing the same?
No. They are related but different:
Vertical integration: Owning more of the supply chain.
Make-buy: Deciding whether to produce in-house or buy from a supplier.
Outsourcing: Hiring an external company to perform a function.
Outsourcing vs. Offshoring?
Outsourcing: Hiring a third party to do a job.
Offshoring: Moving the job to another country.
Outsourcing + Offshoring: Hiring a foreign company to do the job.
U.S. firm sourcing from Africa
This is an example of offshoring.
Factors to consider in outsourcing/offshoring
Quality control, cost savings, supply chain risks, and cultural differences.
Types of Sourcing
Domestic in-house: Doing the work within the company in the same country.
Offshore in-house: Doing the work within the company in a different country.
Domestic outsourcing: Hiring an external company in the same country.
Offshore outsourcing: Hiring an external company in a different country.
Supply Chain Types:
Efficient supply chain: For products made to stock (MTS), where demand is predictable.
Responsive supply chain:
Assemble-to-order (ATO): Assemble products after receiving orders.
Make-to-order (MTO): Make products after orders are placed.
Design-to-order (DTO): Design custom products from scratch for customers.
Why engage in backward or forward integration?
=
Backward integration: Controlling suppliers (e.g., buying a factory that makes raw materials) to lower costs and improve reliability.
Forward integration: Controlling distribution (e.g., buying a retail store) to get closer to the customers and control the sales process.