IB Economics II Partial I
0.0(0)
Studied by 2 peopleCard Sorting
1/114
Earn XP
Description and Tags
Last updated 3:40 AM on 3/27/23
Name | Mastery | Learn | Test | Matching | Spaced | Call with Kai |
|---|
No analytics yet
Send a link to your students to track their progress
115 Terms
1
New cards
Excludability
Not available to everybody so some people are exluded from accesing it.
2
New cards
Rivalry
People need to compete for a good due to its consumption by one reduces the amount available for others.
3
New cards
Non-excludable
Public acess goods, common access goods.
4
New cards
Excludable
Quasi-public goods, private goods.
5
New cards
Non-rivalrous
Public goods quasi-public goods.
6
New cards
Rivalrous
Common acces goods, private goods
7
New cards
Public Goods
This are non-excludable and non-rivalrous, usually goods offered by the government. Like the police force and fire protection.
8
New cards
Quasi-Public Goods
This are excludable and non-rivalrous. Meaning most people can use them but can be restricted if beccesary. Like museums and roads.
9
New cards
Common acces goods
They are non exludable and rivalrous. Meaning virtually anyone can use them this may lead to exploitation and overuse which can be a threat to sustainability. Like water and fish.
10
New cards
Private Goods
They are excludable and rivalrous. Meaning the ownership is restricted to the person who bought the good. Like cars and computers.
11
New cards
Sustainability
The ability of something to be maintained ore preserved.
12
New cards
Sustainability in Economics
Refers to the preservation of humankind’s ability. to provide goods and services to satisfy needs and wants into the future.
13
New cards
Sustainable Development
Development that meets the need of the present without compromising the ability of future generations to mmet their own needs.
14
New cards
Sustainable Resource Use
When resources are used at a rate that allows them to reproduce themselves, so that they don’t become degrated or depleted.
15
New cards
Pollution of Affluence
Environmental degradation as the result of production and consumption activities from economic growth. Main causes are industrial production and high-income consumption patterns that use fosil fuels or common access resources.
16
New cards
Pollution of Poverty
Arises from production and consumption activiries that are due to poverty like through over-exploitation of land for agriculture creating a threat to sustainability.
17
New cards
Overuse of Common Access Resources
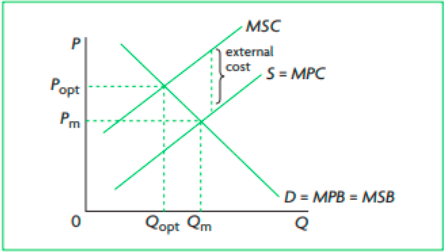
The exploitation of common acces resources and their degradatiin are the external costs of industrial production and high-income consumption activities. This negative externality results in the overallocation of resources.
18
New cards
Pverty as Threat to Sustainability
* Important cause of environmental destruction due to overuse of scarce environmental resources by poor people.
* Lack of modern agricultural inputs depleting soil.
* Higher birth rates creates more pressure to open lands for agriculture.
* Deforestation in search of new farmland causing soil erosion and overgrazing of animal depleteing soil as well.
* Lack of modern energy sources
* Lack of modern agricultural inputs depleting soil.
* Higher birth rates creates more pressure to open lands for agriculture.
* Deforestation in search of new farmland causing soil erosion and overgrazing of animal depleteing soil as well.
* Lack of modern energy sources
19
New cards
Government Responses to Threats to \n Sustainability
* Legislation
* Carbon taxes
* Cap & trade schemes
* Funding for clean technologies
* Carbon taxes
* Cap & trade schemes
* Funding for clean technologies
20
New cards
Legislation
Laws and regulations that limit emissions and pollutants. Ex. Hunting permits or licenses.
21
New cards
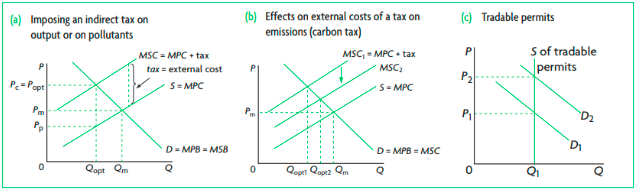
Carbon Taxes
This are implemented to control the use of fossil fuels the more carbon they emit the higher the tax.
22
New cards
Cap & Trade Schems
They are tradable permits as they sound caps to the amount of emissions a producer can emit. This permits can be bought or sold.
23
New cards
Taxes and Tradable Permits
Market based policies to correct negative production externalities.
24
New cards
Funding for Clean Technologies
When the government invests in research, development, demonstration and deployment for clean energies
25
New cards
Carbon Taxes vs. Cap & Trade Schemes
Economist prefer taxes because they make nergy prices more predictable, easir to implement, can be applied to all users of fossil fuels, no manipulation by the government and others, less likely to restrict competition. Trade schemes are more likely to be pressured into being set higher. But also taxes may be too low, cannot target a particular level of carbon reduction, regressive and need adjusting for inflation.
26
New cards
Assymmetric Information
Situations where buyers and sellers don’t have equal acces to information resulting in an under or over allocation of resources.
27
New cards
Government Responses to Asymmetric Information
* Regulations. Ex. Food quality standards.
* Provision of Information Ex. Nutriotinal labellng
* Provision of Information Ex. Nutriotinal labellng
28
New cards
Moral Hazard Problem
Buyers not disclosing your future intentions when buying. Resulting in the underallocation of resources.
29
New cards
Adverse Selection Problem
Buyers not disclosing pre existing conditions to the sellers. Sellers will try to counteract by setting policies against this.
30
New cards
Labour Market (Safety in the workplace?
Sellers/producers not disclosing all the risks of working for them or in a place.
31
New cards
Monopoly
Type of market structure where there is a single firm dominating the market with little possibility for others to enter preserving the monopoly position.
32
New cards
Monopoly Power
The ability of a firm or groups of firms to control the price of the product they sell.
33
New cards
Is Monopoly Power Desirable?
* Welfare loss
* Allocative inefficiency
* Productive inefficiency
* Lower output and igher prices
* Allocative inefficiency
* Productive inefficiency
* Lower output and igher prices
34
New cards
Government Responses to Monopoly Power
* Legislation- anti-monopoly laws
* Regulations- regulation of natural monopolies that can satisfy the entire market at a lower costs
* Nationalisation- transfering a firm form the private sector to the government.
* Trade liberasation- removal of barriers for international trade, increasing competition to domestic firms.
* Regulations- regulation of natural monopolies that can satisfy the entire market at a lower costs
* Nationalisation- transfering a firm form the private sector to the government.
* Trade liberasation- removal of barriers for international trade, increasing competition to domestic firms.
35
New cards
Negative Production Externality
Overallocates resources
36
New cards
Negative Consumption Externality
Overallocates resources
37
New cards
Positive Production Externality
Underallocates resources
38
New cards
Positive Consumption Externality
Underallocates resources
39
New cards
Merit Goods
Underallocates resources
40
New cards
Demerit Goods
Overallocates resources
41
New cards
Public goods
Underallocates resources or allocates no resources.
42
New cards
Overuse of Common Access Resources
Overallocates resources
43
New cards
Assymmetric reosurces
Usually underallocates resources
44
New cards
Monopoly Power
Underallocates resources
45
New cards
Government Failure
Occurs when government intervention in markets results in less efficient outcomes than those that would have resulted without the intervention.
46
New cards
Short Run
The short run is a time period during which at least one input is fixed and cannot be changed by the firm.
47
New cards
Long Run
The long run is a time period when all inputs can be changed.
48
New cards
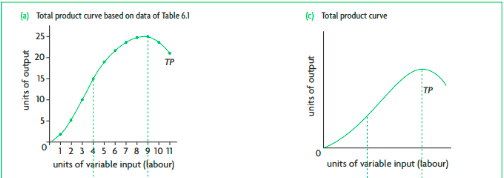
Total Product (*TP* or *Q*)
The total amount of product (output) produced by a firm.
49
New cards
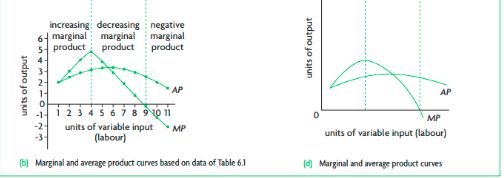
Marginal Product (*MP*)
The additional product produced by one additional unit of variable input.
MP= ΔTP / Δ units of variable input
MP= ΔTP / Δ units of variable input

50
New cards
Average Product (*AP*)
Product per unit of variable input.
AP= TP/units of variable input
AP= TP/units of variable input
51
New cards
Law of Diminishing Returns
In the short run as more and more units of a variable input are added to one or more fixed inputs, the marginal product of the variable input at first increases, but there comes a point when it begins to decrease.
52
New cards
Relationship betwen the Marginal and Average Product Curves
When the marginal product curve lies above the average product curve (MP > AP), average product is increasing; and when the marginal product curve lies below the average product curve (MP < AP), average product is decreasing. This means the marginal product curve always intersects the average product curve when this is at its maximum.
53
New cards
Economic Costs
All production costs are opportunity costs. There are teo types explicit and implicit and added are the economic costs.
54
New cards
Explicit Costs
Payment from a firm to an outsider for a resouce needed in production. Also known as accounting costs but are alsso opportunity costs. The opportunity cost of using resources not owned by the firm is equal to the amount paid to acquire them.
55
New cards
Implicit Costs
is the sacrificed income or opportunity cost arising from the use of self \n -owned resources by a firm.
56
New cards
Factors of Production
* Land- natural resources and land
* Labour- workers physical and mental effort
* Capital- manmade factor of production
* Entrepreneurship- innovation in development as well as the organing of the other 3 factors
* Labour- workers physical and mental effort
* Capital- manmade factor of production
* Entrepreneurship- innovation in development as well as the organing of the other 3 factors
57
New cards
Fixed Costs
Come from the use of fixed inputs and don‘t change as output changes.
58
New cards
Variable Costs
Come from the use of variable inputs and vary as output increases or decreases.
59
New cards
Fixed and Variable Costs in the Short and Long Run
Short Run: Total costs= Fixed costs + Variable costs \n Long Run: Total costs= Variable costs
60
New cards
Average Costs
Costs per unit of output, or total cost divided by the number of units of output. They tell us how much each unit of output produced costs on average.
61
New cards
Total Fixed Cost (*TFC*)
Costs that do not change as output changes.
62
New cards
Total Variable Cost (*TVC*)
Costs that vary (change) as output changes; arise from the use of variable inputs.
63
New cards
Total Cost (*TC*)
The sum of the fixed and variable costs.
TC= TFC+TVC
TC= TFC+TVC
64
New cards
Average Fixed Cost (*AFC*)
Fixed costs per unit of output.
AFC= TFC/Q
AFC= TFC/Q
65
New cards
Average Variable Cost (*AVC*)
Variable cost per unit of output.
AVC= TVC/Q
AVC= TVC/Q
66
New cards
Average Total Cost (*ATC*)
Total cost per unit of variable.
ATC= AFC+AVC
ATC= AFC+AVC
67
New cards
Marginal Cost (*MC*)
The change in the cost arising from one additional unit of output.
MC= ΔTC/ΔQ = ΔTVC/ΔQ
MC= ΔTC/ΔQ = ΔTVC/ΔQ
68
New cards
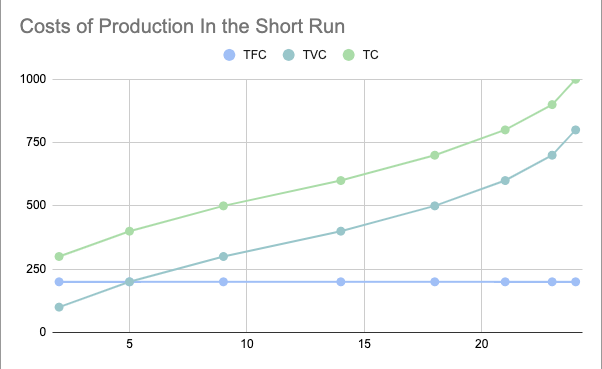
Graphs Costs (TFC, TVC, TC)
* TFC parallel to x axis
* TVC doesn’t increase at constant rate as the output.
* TC is the vertical sum of TFC and TVC so the difference is TFC
* TVC doesn’t increase at constant rate as the output.
* TC is the vertical sum of TFC and TVC so the difference is TFC
69
New cards
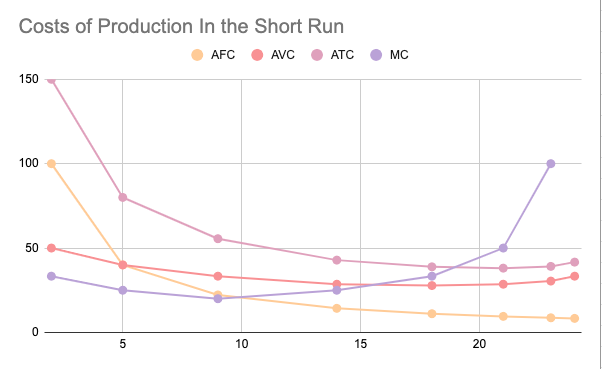
Graphs Costs (AFC, AVC, ATC, MC)
* AFC falls continously as output increases
* AVC, ATC, MC all follow the pattern of falling then they reach a minimum and they start to rise.
* MC intersects with AVC and ATC at their minimum.
* MC
* AVC, ATC, MC all follow the pattern of falling then they reach a minimum and they start to rise.
* MC intersects with AVC and ATC at their minimum.
* MC
70
New cards
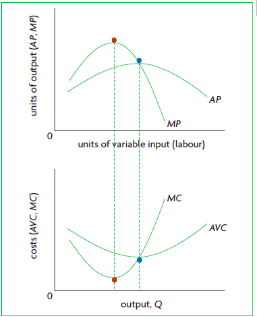
Relating Costs and Product Curves
Product curves and cost curves are mirror \n images due to the law of diminishing returns.
71
New cards
Shifts in the Cost Curves
* Change in resource prices
* Change in technology
* Change in technology
72
New cards
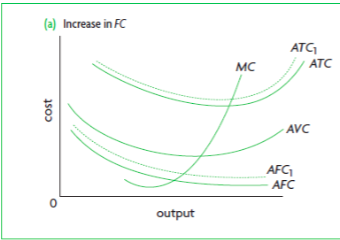
Increase in Fixed Costs
Affects TFC, TC, AFC, ATC, all of which shift \n upward. Variable costs and marginal cost remain unaffected.
73
New cards
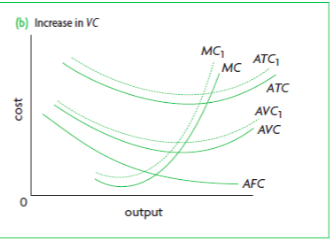
Increase in Variable Costs
Affects TVC, TC, AVC, ATC and MC, all \n of which shift upward.
74
New cards
Output in the Long Run
* Constant return to scale
* Increasing return to scale
* Decreasing return to scale
* Increasing return to scale
* Decreasing return to scale
75
New cards
Constant Return to Scale
Output increases in the same proportion as all inputs.
76
New cards
Increasing Return to Scale
Output increases more than in proportion to the increase in all inputs: given a percentage increase in all inputs, output increases by a larger percentage.
77
New cards
Decreasing Return to Scale
Output increases less than in proportion to the increase in all inputs: given a percentage increase in all inputs, output increases by a smaller percentage.
78
New cards
Diminishing returns vs. Decreasing Return to Scale
* Diminishing Returns- Short run, it shows what happens to output as a variable input is added to a fixed input.
* Decreasing Returns to Scale- Long run, it shows what happens to output when all inputs are variable.
* Decreasing Returns to Scale- Long run, it shows what happens to output when all inputs are variable.
79
New cards
Production Expansion
If a firm wants to expand it has to avoid diminishing returns so it has to increase fixed inputs. The particular size it selects will be the one that minimises costs for that level of output.
80
New cards
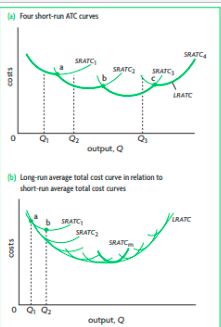
Long Run Average Total Cost
A curve showing the lowest possible average cost that can be attained for any level of output when all of the firm’s inputs are variable. It wil be on the point where the Short Run Average Total Cost touches the Long Run curve
81
New cards
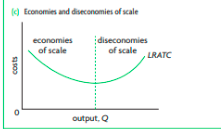
Economies and Diseconomies of Scale Long Run
The U-shape of the LRATC curve can be found in economies and diseconomies of scale relate tu increasing or decreasing returns to scale.
82
New cards
Economies of Scale
They are decreases in the average costs of production over the long run as a firm increases all its inputs. (Downward slope). This means increasing returns to scale.
83
New cards
Diseconomies of Scale
They are increases in the average costs of production as a firm increases its output by increasing all its inputs. (Upward slope). This means decreasing returns to scale.
84
New cards
Reasons for Economies of Scale
Specialisation of labour, specialisation of management, efficiency of capital equipment, indivisibilities of capital equipment, indivisibilities of efficient processes, spreading of certain costs, such as marketing, over larger volumes of output.
85
New cards
Reasons for Diseconomies of Scale
Co-ordination and monitoring difficulties, communication difficulties, poor worker motivation.
86
New cards
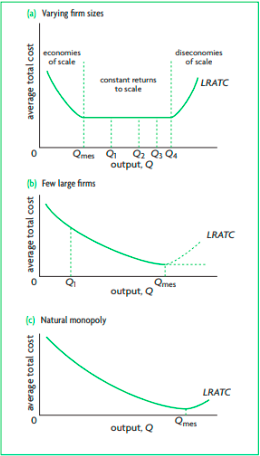
Constant Returns to Scale
May appear in a LRATC curve if there is a horizontal segment between the upward and downward sloping. In this range, as output increases (with all inputs increasing), average costs do not change.
87
New cards
Minimum Efficient Scale
The level of output at which economies of scale are exhausted. Where average costs will be constant or decrease.
88
New cards
Revenue
Payments firms receive when they sell goods and services they produce over a given time period.
89
New cards
Total Revenue
The total earnings of a firm from the sale of its output.
TR= P x Q
TR= P x Q
90
New cards
Marginal Revenue
The additional revenue of a firm arising from the sale of an additional unit of output.
MR=ΔTR/ΔTQ
MR=ΔTR/ΔTQ
91
New cards
Average Revenue
Revenue per unit of output.
AR= TR/Q
AR= P
AR= TR/Q
AR= P
92
New cards
Analysis of Revenue Cosniderations
* The firm has no control over price, and price is constant as output varies.
* The firm has some degree of control over price, and price varies with output.
* The firm has some degree of control over price, and price varies with output.
93
New cards
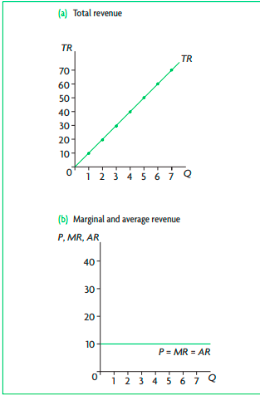
Revenue Curve when a Firm has no Control over Price
Constant price, perfect competition.
94
New cards
Revenue Curve when a Firm has some Control over Price
Variable price, all market model except perfect competition.
95
New cards
Economic Profit
It considers economic costs.
Profit = TR- (Explicit + Implict costs)
Profit = TR- (Explicit + Implict costs)
96
New cards
Normal Profit
Also known as break-even point. Mimimum amount of revenue to keep the firm running. Covers economic costs.
When total revenue = economic costs. It is not profit per say is more a cost of production.
When total revenue = economic costs. It is not profit per say is more a cost of production.
97
New cards
Continue Operating when Normal Profit
When a firm is earning normal profit, it is earning just the \n necessary revenues to cover payment for entrepreneurship (a cost) and all other implicit costs of self-owned resources, after revenues have also covered explicit costs. The firm has covered all its opportunity costs and will continue to operate.
98
New cards
Positive Economic Profit
When the TR > economic cost; The firm earns supernormal profit (or abnormal profit).
99
New cards
Zero Economic Profit
TR = economic cost; The firm earns normal profit.
100
New cards
Negative Economic Profit
TR < economic cost; The firm makes a loss.