Statistics in Psychology UTA (Hernandes)
1/75
There's no tags or description
Looks like no tags are added yet.
Name | Mastery | Learn | Test | Matching | Spaced | Call with Kai |
|---|
No analytics yet
Send a link to your students to track their progress
76 Terms
What are the four levels of measurement?
Nominal, Ordinal, Interval, Ratio.
Define nominal measurement and provide an example.
Nominal measurement classifies data into distinct categories without a specific order; e.g., types of fruit.
Define ordinal measurement and provide an example.
Ordinal measurement involves ordered categories where distances between categories are not uniform; e.g., rankings in a race.
Define interval measurement and provide an example.
Interval measurement has ordered categories with equal distances between them, but lacks a true zero point; e.g., temperature in Celsius.
Define ratio measurement and provide an example.
Ratio measurement has ordered categories with equal distances and a true zero point; e.g., weight or height.
What is sampling error?
Sampling error is the difference between the sample statistic and the actual population parameter.
Give a hypothetical example of sampling error.
If a survey shows that 70% of sampled students prefer pizza, but the actual population preference is 60%, the 10% discrepancy is the sampling error.
What is the difference between descriptive statistics and inferential statistics?
Descriptive statistics summarize data; inferential statistics make predictions or inferences about a population based on a sample.
Provide an example of descriptive statistics.
Calculating the average test score of a class.
Provide an example of inferential statistics.
Using the class average to predict the performance of all students in the school.
What is a sample?
A subset of a population used for statistical analysis.
What is a population?
The entire group of individuals or instances about whom we hope to learn.
What does a parameter refer to?
A parameter is a numerical characteristic of a population.
What does a statistic refer to?
A statistic is a numerical characteristic of a sample.
For two variables to be correlated, both variables should be __________.
measurable.
Give an example of two positively correlated variables.
Height and weight.
Give an example of two negatively correlated variables.
Hours studied and number of mistakes on a test.
Give an example of two variables that have zero correlation.
Shoe size and intelligence.
What is the correlation coefficient (r)?
A measure of the strength and direction of a relationship between two variables.
What does it mean if the correlation coefficient is positive vs negative?
A positive r indicates a direct relationship; a negative r indicates an inverse relationship.
What does a higher absolute value of the correlation coefficient indicate?
A stronger correlation between the two variables.
What is an illusory correlation?
When two variables appear to be related but are not; often due to a third variable.
What is a third-variable problem?
A situation where a third variable influences both variables, leading to a false causal relationship.
What are independent variables?
Variables that are manipulated in an experiment to observe their effect on dependent variables.
What are dependent variables?
Variables that are measured in an experiment to see if they change due to the independent variable.
Give an example of a true-experimental design.
A study that randomly assigns participants to a treatment or control group.
What are key features of a true experimental design?
Random assignment, control groups, and manipulation of the independent variable.
Why/how can true-experimental design determine causation?
It controls for confounding variables and establishes a cause-and-effect relationship.
What is a quasi-experimental design?
A study that resembles an experimental design but lacks random assignment.
Give an example of a quasi-experimental design.
A study comparing test scores of students in different schools without random assignment.
What is simple random sampling?
A sampling method where every member of the population has an equal chance of being selected.
What is convenience sampling?
A sampling method that selects individuals who are easiest to reach.
What is stratified sampling?
A sampling method that involves dividing the population into subgroups and randomly sampling from each.
What causes sampling error?
Sampling error can be caused by the size of the sample, the method of selection, and variability within the population.
What does the symbol 'n' refer to?
'n' refers to the sample size, or the number of individuals in the sample.
What does the symbol 'r' refer to?
'r' represents the correlation coefficient.
What does the symbol 'M' stand for?
'M' denotes the mean of a sample.
What does the symbol 'x̄' (x-bar) represent?
'x̄' is the sample mean.
What does the symbol 'μ' represent?
'μ' is the population mean.
What does the symbol 'SD' mean?
'SD' stands for standard deviation, which measures the dispersion of a set of scores.
What does the symbol 'σ' represent?
'σ' is the population standard deviation.
What does the symbol 'Σ' mean?
'Σ' is the summation symbol, indicating the sum of a set of values.
What does the symbol 'z' represent?
'z' represents the z-score, which indicates how many standard deviations a value is from the mean.
What do line graphs help display?
Line graphs show changes over time or continuous data. Group Comparisons
What do bar graphs help display?
Bar graphs compare discrete categories or groups.
What do histograms help display?
Histograms show the distribution of numerical data by grouping scores into intervals.
What do scatterplots help display?
Scatterplots show the relationship between two quantitative variables.
What do box plots help display?
Box plots summarize the central tendency, spread, and outliers of a data set.
What do stem-and-leaf displays help display?
Stem-and-leaf displays show the distribution of quantitative data while retaining the original data values.
What do frequency polygons help display?
Frequency polygons visualize the distribution of a frequency or relative frequency distribution.
What is denominator neglect?
Denominator neglect is the tendency to ignore the size of the denominator in a fraction when making judgments.
Why does denominator neglect happen?
It often occurs due to cognitive biases or simplifying complex information.
When should you use mean vs median as your measure of central tendency?
Use mean for normally distributed data and median for skewed distributions or with outliers.
What is variability?
Variability refers to how spread out or dispersed the data points are in a data set.
What can influence the amount of variability in a set of scores?
The range of data, presence of outliers, and the size of the sample can influence variability.
What is a z-score?
A z-score indicates how many standard deviations a data point is from the mean.
How do you interpret z-scores?
Positive z-scores indicate above average values; negative z-scores indicate below average values.
When can z-scores be used?
Z-scores can be used in normal distributions to identify relative standing and areas under the curve.
What are the benefits of using z-scores?
Z-scores standardize scores across different distributions, making comparisons easier.
What is the 68-95-99.7 approximation?
It is the empirical rule stating that in a normal distribution, approximately 68% of data falls within one standard deviation, 95% within two, and 99.7% within three.
When can the 68-95-99.7 approximation be used?
It can be used when the data is normally distributed.
What is a Normal Distribution?
A Normal Distribution is a bell-shaped distribution where most observations cluster around the central peak.
What are the characteristics of a normal distribution?
Symmetry about the mean, bell-shaped curve, mean = median = mode, and 68-95-99.7 rule.
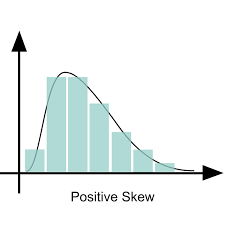
What is positive skew?
Majority of the data is on the left side
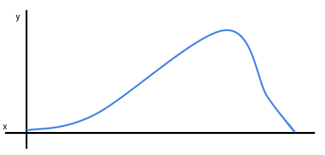
What is negative skew?
Negative skew is when the majority of the data is on the right side of the distribution
How can you tell which skew is which?
By observing where the bulk of the data is concentrated and the direction of the tail.
What are ceiling effects and floor effects?
Ceiling effects occur when scores can’t go higher than a certain point; floor effects occur when scores can’t go lower.
How do the mean, median, and mode compare in positive skew?
In positive skew, mode < median < mean.
How do the mean, median, and mode compare in negative skew?
In negative skew, mean < median < mode.
What are the measures of variability?
Range, standard deviation, and variance.
When and why are measures of variability used/reported?
They are used to describe the spread of data and understand the consistency of scores.
What is a confound?
A confound is an external variable that correlates with both independent and dependent variables.
How does a confound interfere with the results of a study?
It can create a false impression of a relationship between the variables being studied.
What is the effect of noise variables on variability?
Noise variables can increase the variability of the data, making it harder to draw conclusions.
How do you calculate variance?
Variance is calculated as the average of the squared differences from the mean.
How do you calculate standard deviation?
Standard deviation is the square root of the variance.