Chapter 9B: Marketing objectives and strategy
1/7
Earn XP
Description and Tags
Name | Mastery | Learn | Test | Matching | Spaced | Call with Kai |
|---|
No study sessions yet.
8 Terms
Boston matrix
2×2 matrix model ➡ analyzes product portfolio ➡ according to growth rate of market + relative market share of products ➡ within the market
Boston matrix diagram
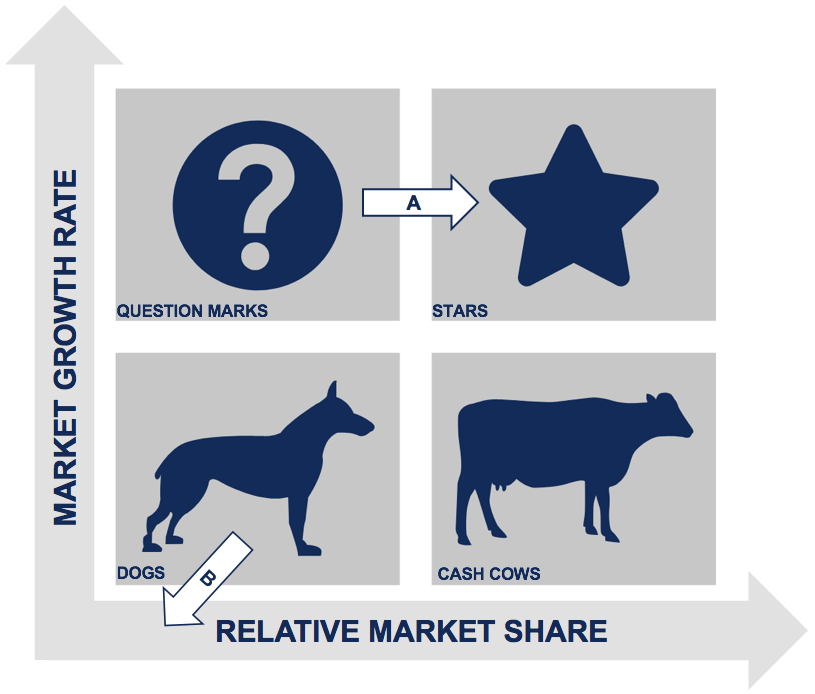
Question marks
Known as ‘problem child’
Low market share
Fast growing market
Profits may be low — weak market share
Can turn into a star
Investment can achieve increased sales
Stars
High market growth
High market share
Fast growing market
High profits
Business needs to invest ➡ to keep sales and profits high
Net cash flow = profits = investment in product and promotion
Cash cows
Low market growth
High market share
Slow growing market ➡ saturation
Strong positive cash flow
Dogs
Low market share
Low market growth
Poor sales
Poor profits
May earn some profit with investment
Net cash flow ➡ zero or negative
Disadvantages of Boston matrix
Snapshot of current position
Little or no predictive value
Focus on market share + market growth ➡ ignores issues ➡ e.g. developing sustainable competitive advantages