ACC333 Exam 1
5.0(1)
5.0(1)
Card Sorting
1/101
Earn XP
Description and Tags
Last updated 7:47 PM on 3/1/23
Name | Mastery | Learn | Test | Matching | Spaced | Call with Kai |
|---|
No analytics yet
Send a link to your students to track their progress
102 Terms
1
New cards
we need nonfinancial measures to evaluate:
* quality assessment
* employee statistics
* customer relationships
* supplier relationships
* employee statistics
* customer relationships
* supplier relationships
2
New cards
benefits of nonfinancial performance measures
* relate to true drivers of business profitability
* limitless potential to measure different aspects of the business, especially with big data, and not constrained by GAAP
* facilitate business experiments where companies can get a broad view of the effect of business initiatives
* less prone to management manipulation due to broad use throughout the organization
3
New cards
consistently creating long-term organizational value requires that stakeholder issues be:
* identified and understood clearly
* measured qualitatively and quantitatively
* communicated internally and externally
* measured qualitatively and quantitatively
* communicated internally and externally
4
New cards
balanced scorecards
* multi-level performance strategy
* used for detailing strategy and aligning everyone with the details
* used for detailing strategy and aligning everyone with the details
5
New cards
typical categories of balanced scorecards:
* financial perspective
* customer perspective
* internal operations perspective
* learning and growth
* customer perspective
* internal operations perspective
* learning and growth
6
New cards
“enterprise business processes” are;
customer service driven model for value creation
7
New cards
for a manufacturer, distributor, or seller of tangible products, common processes include:
* inbound logistics (procuring inputs)
* operations (inputs→ products)
* marketing and sales (selling products)
* outbound logistics (products→ customers)
* service (keeping customers happy after the sale)
* financial management
* human resource management
* technology and information management
non-process organizations: geographic regions, product divisions, etc.
8
New cards
process owner
has end-to-end responsibility for each process (i.e., manages the process)
9
New cards
process owners vs unit owners
* process owners manages the process, monitors performance of the process and motivates the frontline workers who perform the process
* unit owners (regional mangers, vps, etc.) continue to manage their own workforces who perform the process
* most employees will be happy with change; unit owners will not
* critically important to manage unit owners properly
* unit owners (regional mangers, vps, etc.) continue to manage their own workforces who perform the process
* most employees will be happy with change; unit owners will not
* critically important to manage unit owners properly
10
New cards
what’s it going to take?
* leadership and teamwork
* “buy in,” communication skills, shared workspace
* performance measurement
* with processes to measure and how to measure them, tie measures to strategic objectives
* links to compensation
* share measures with employees to reinforce process culture, reward/punish employees based on measures
* training
* employees must understand entire process and how their individual actions contribute to (or detract from) its success
11
New cards
potential benefits on focusing on business processes
* enhanced flexibility, efficiency and customer focus
* decreased product launch time
* improved customer service
* increased cost savings
* decreased product launch time
* improved customer service
* increased cost savings
12
New cards
potential costs on focusing on business processes
* being different from other companies could hurt attractiveness to employees and investors, or attract regulatory scrutiny
* internal resistance to change
* blurred/changing lines of authority or accountability
* internal resistance to change
* blurred/changing lines of authority or accountability
13
New cards
what must you think carefully about when dealing with the cost from focusing on business processes and there are blurry lines of authority or accountability?
* which measure(s) will capture success or failure of our core business processes
* how to capture such measures
* to whom we should communicate such measures
* motivating each employee with such measures
* how to capture such measures
* to whom we should communicate such measures
* motivating each employee with such measures
14
New cards
financial perspective- balanced scorecard
describes the economic consequences of actions taken in the other three perspectives
15
New cards
the customer perspective- balanced scorecard
defines the customer and market segments in which the business unit will compete
16
New cards
the internal business process perspective
describes the internal processes needed to provide value for customer owners
17
New cards
learning and growth (infrastructure) perspective
defines the capabilities that an organization needs to create long-term growth and improvement
18
New cards
strategy
specifies management’s desired relationships among the four perspectives
19
New cards
strategy translation means
specifying objects, measures, targets, and initiatives for each perspective
20
New cards
performance measures are derived from
a company’s vision, strategy, and objectives
21
New cards
these performance measures must be balanced between the following measures:
* performance driver measures and outcome measures
* objective and subjective measures
* external and internal measures
* financial and nonfinancial measures
* objective and subjective measures
* external and internal measures
* financial and nonfinancial measures
22
New cards
the framework needed for internal (process) perspective
process value chain
23
New cards
process value chain is made up of these three processes:
* the innovation process anticipates the emerging and potential needs of customers and creates new produces and services to satisfy those needs
* the operations process produces and delivers existing products and services to customers. it begins with a customer order and ends with the delivery of the product or service
* the post-sales service process provides critical and responsive services to customers after the product or service has been delivered
24
New cards
learning and growth perspective has three major objectives:
* increase employee capabilities- have the requisite knowledge, skills, and abilities
* increase motivation, empowerment, and alignment- have the freedom, motivation, and initiative to use skills effectively
* increase information systems capabilities- so that employees can improve processes and effectively execute new processes
* increase motivation, empowerment, and alignment- have the freedom, motivation, and initiative to use skills effectively
* increase information systems capabilities- so that employees can improve processes and effectively execute new processes
25
New cards
cost
the amount of cash or cash equivalent scarified for goods and/or services that bring a current or future benefit to the organization
26
New cards
expired costs
aka expenses- as costs are used up in the production of revenues, they are said to expire
27
New cards
cost object
any item such as a product, customer, department, project, geographic region or plant, for which costs are measured and assigned
28
New cards
______ is the way that a cost is linked to some cost object
assigning costs
29
New cards
direct costs
costs that can be easily and accurately traced a cost object
30
New cards
indirect costs
costs that cannot be easily and accurately traced to a cost object
31
New cards
allocation
means that an indirect cost is assigned to a cost object by using a reasonable and convenient method
32
New cards
variable cost
one that increases in total as output decreases
33
New cards
fixed cost
cost that does not increase in total as output increases and does not decrease in total as output decreases
34
New cards
opportunity cost
the benefit given up or sacrificed when one alternative is chosen over another
35
New cards
products
goods produced by converting raw materials through the use of labor and indirect manufacturing resources, such as the manufacturing plant, land, and machinery
36
New cards
services
tasks or activities performed for a customer or an activity performed using an organization’s products or facilities
37
New cards
services differ from from products in many ways
* services are intangible
* services are perishable
* services require direct contact between providers and buyers
* services are perishable
* services require direct contact between providers and buyers
38
New cards
product costs
both direct and indirect, of producing or acquiring a product and preparing it for sale--only costs in the production section of the value chain are included in product costs, inventoried
39
New cards
period costs
everything that is not product cost, not carried in inventory
40
New cards
product costs have three components
* direct materials
* direct labor
* overhead
* direct labor
* overhead
41
New cards
direct material
materials that are a part of the final product and can be directly traced to the goods being produced
42
New cards
direct labor
the labor that can be directly traced to the goods being produced
43
New cards
manufacturing overhead
all product costs other than direct materials and direct labor, also known as factory burden, support, or indirect manufacturing costs
44
New cards
per unit product cost=
total product cost/ number of units produced
45
New cards
prime cost=
dm+dl
46
New cards
conversion cost=
dl+moh
47
New cards
period costs are expensed
in the period in which they are incurred
48
New cards
common period costs
* selling costs
* administrative costs
* non-production pp&e
* administrative costs
* non-production pp&e
49
New cards
selling costs
those costs necessary to market, distribute, and service a product or service
50
New cards
administrative costs
include research, development, and general administration of the organization and cannot be assigned to either selling or production
51
New cards
enon-production pp
delivery trucks, corporate headquarters- depreciated over estimated useful life
52
New cards
uses of cost information
* cost volume profit analysis
* responsibility accounting (cost management)
* pricing decisions
* evaluating alternative choice decisions
* litigating or defending cost-related legal issues
* responsibility accounting (cost management)
* pricing decisions
* evaluating alternative choice decisions
* litigating or defending cost-related legal issues
53
New cards
cost behavior
describes whether a cost changes when the level of output changes, it is the foundation upon which managerial accounting is built
54
New cards
fixed cost
a cost that does not change in total as output changes
55
New cards
variable cost
increases/decreases in total with an increase/decrease in output
56
New cards
mixed cost
has both fixed and variable components (ex. renting a car with a flat fee and a rate per mile)
57
New cards
cost driver
a causal factor that measures the output of the activity that leads (or causes) costs to change. identifying and managing drivers helps mangers better predict and control costs
58
New cards
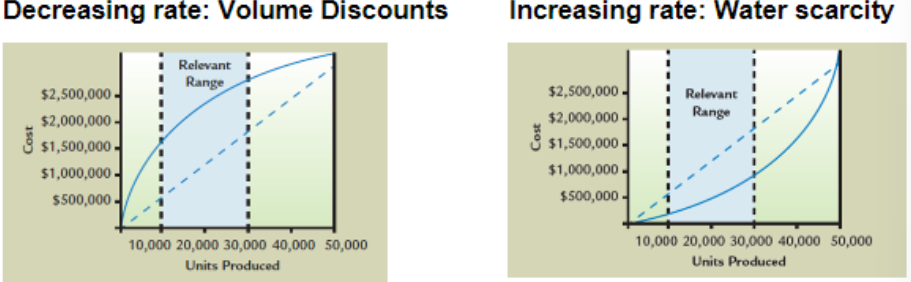
relevant range
range of output over which the assumed cost relationship is valid for the normal operations of a firm
59
New cards
two types of fixed costs
1. discretionary fixed costs
2. committed fixed costs
60
New cards
discretionary fixed costs
fixed costs that can be changed or avoided relatively easily in the short run at management discretion (ex. advertising)
61
New cards
committed fixed costs
fixed costs that cannot be easily changed (ex. lease)
62
New cards
semi-variable costs
variable costs that increase/decrease with output, but not at a constant/linear rate
63
New cards
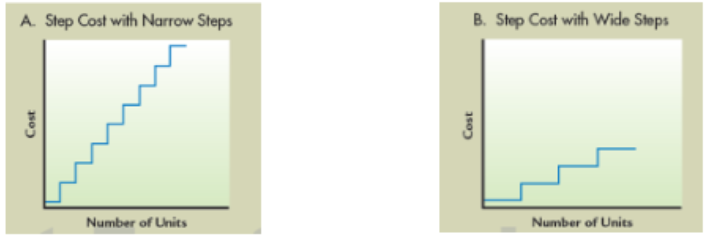
step costs
discontinuous cost functions, display a constant level of total cost for a range of output and then jump to a higher level (or step) of total cost at some point, where they remain for a similar range of output before jumping/stepping again
64
New cards
purpose of a cost formula
provide a quantitative estimate of both total fcs and the vc per unit of the cost driver(s), with the cost formula, managers can predict total costs at variable levels of output
65
New cards
the three commonly used methods of separating a mixed cost into its fixed and variable components
* the high low method
* the scatter graph method (eyeballing)
* the method of least squares (regression)
* the scatter graph method (eyeballing)
* the method of least squares (regression)
66
New cards
the simplifying assumption of a linear cost relationship
total cost= total fixed cost + (variable rate x units of output)
67
New cards
high low method
method of separating mixed costs into fixed and variable components by using just the high and low data points, provides managers with a quick way to estimate cost behavior
68
New cards
high low method equation for variable rate
variable rate= (high point cost- low point cost)/ (high point output- low point output)
69
New cards
calculation to find the fixed cost using the variable rate found with the high low equation
fixed cost= total cost at high point- (variable rate x output at high point) (essentially y=mx+b reframed to b=y-mx)
70
New cards
what does the goodness of fit test tell us
how well the independent variable (s) predict(s) the dependent variable on a 0.00- 1.00 scale
71
New cards
the percentage of variability in the dependent variable explained by an independent variable is called the
coefficient of determination (R squared)
72
New cards
what does a high R squared suggest?
your independent variable is a strong cost driver
73
New cards
what does a low R squared suggest?
your independent variable is not strongly associated with the costs you are trying to predict
74
New cards
the method of least squares (regression)
a statistical way to find the best-fitting line through a set of data points
75
New cards
what is managerial judgement used for
determining cost behavior and is by far the most widely used method in practice
76
New cards
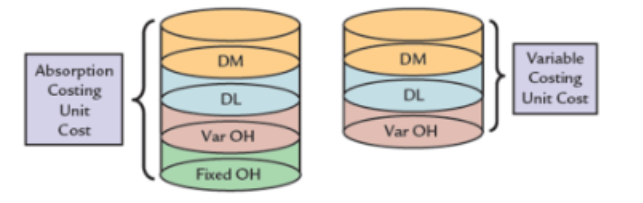
absorption costing
* required by gaap
* assigns all manufacturing costs to the product
* dm, dl, vmoh & fmoh define the cost of a product
* fixed overhead is viewed as a product cost, assigned to the product, and not expensed until the product is sold- inventoriable
* assigns all manufacturing costs to the product
* dm, dl, vmoh & fmoh define the cost of a product
* fixed overhead is viewed as a product cost, assigned to the product, and not expensed until the product is sold- inventoriable
77
New cards
variable costing
* assigns only variable manufacturing costs to the product; these costs include dm, dl, & vmoh
* rationale that fmoh is a cost of capacity, seen as expiring that period, charged in total against the revenues of the period
* rationale that fmoh is a cost of capacity, seen as expiring that period, charged in total against the revenues of the period
78
New cards
main difference between variable & absorption costing
treatment of fixed factory overhead
79
New cards
if production > sales
absorption income > variable income
80
New cards
production < sales
absorption income < variable income
81
New cards
if production = sales
absorption income = variable income
82
New cards
cost-volume-profit (cvp) analysis
estimates how changes in the following three factors affect a company’s profit:
* costs (both variable and fixed)
* sales volume
* price
* costs (both variable and fixed)
* sales volume
* price
83
New cards
what do companies use cvp for?
to help them calculate and reach important benchmarks, such as breakeven point
84
New cards
breakeven point
where total rev= total costs (the pt of 0 profit), level of sales at which cm just covers fixed costs so net income is 0
85
New cards
contribution margin
the difference between sales and variable expense, the amt of sales revenue left over after all the variable expenses are covered that can be used to contribute to fixed expense and op income
86
New cards
two options for calculating break even point in units:
* op income= (price *# of units sold) - (variable cost per unit* number of units sold) - total fixed cost
* break even units= fixed costs/ unit cm
* break even units= fixed costs/ unit cm
87
New cards
to find breakeven revenue
multiply breakeven units by selling price (because price \* units sold is sales rev)
OR
break even sales= total fixed expenses/ cm ratio
OR
break even sales= total fixed expenses/ cm ratio
88
New cards
variable cost ratio
variable cost per unit/ selling price per unit
89
New cards
cm ratio
total contribution margin/ total sales
OR
cm per unit/ selling price per unit
OR
cm per unit/ selling price per unit
90
New cards
why would we want to solve for break even point in sales dollars?
sales are typically recorded immediately, so the manager does not have to wait to have an income statement prepared in order to see how close the company is to breaking even
91
New cards
to find target income
same equations as breakeven, but we add the target income to the numerator (+ fixed costs)
92
New cards
what are the benefits of graphing cvp
* helps managers clearly see the difference between vc and revenue
* also helps them to understand quickly what impact an increase or decrease in sales will have on the breakeven point/ profit
* also helps them to understand quickly what impact an increase or decrease in sales will have on the breakeven point/ profit
93
New cards
cvp analysis assumptions
1. linear revenue and cost functions remain constant over the relevant range
2. selling prices and costs are known with certainty
3. all units produced are sold; there are not finished goods inventories
4. sales mix is known with certainty for multiple product break even settings
94
New cards
sales mix
the relative combination of products being sold by a firm
95
New cards
break-even packages =
total fc/ package cm
96
New cards
cvp analysis is a tool that managers use to handle:
risk and uncertainty
97
New cards
sensitivity analysis
a “what-if” technique that examines the impact of changes in underlying assumptions on an answer
98
New cards
margin of safety
the units sold or revenue earned above the break-even volume aka sales- break even units
99
New cards
operating leverage
the use of fixed costs to extract higher percentage changes in profits as sales activity changes, the measure of the proportion of fixed costs in a company’s cost structure, used as an indicator of how sensitive profit changes in sales volume
100
New cards
degree of operating leverage=
total cm/ op income